Brixmor Property Group - Investor Presentation - Beneva Village Shoppes | Sarasota, Florida
←
→
Page content transcription
If your browser does not render page correctly, please read the page content below
Brixmor Property Group
Investor Presentation
Quarter Ended March 31, 2021

 Beneva Village Shoppes | Sarasota, Florida
Brixmor Overview                                                                                            Portfolio Quick Facts
                                                                                                            Number of shopping centers                              389
High quality, diversified, open-air retail portfolio                                                        GLA                                                  68M SF
                                                                                                            Average shopping center size                        176K SF
› One of the largest open-air retail landlords in the US                                                    Percent billed                                        87.8%

   o Nationally diversified portfolio of 389 shopping centers spanning 130 discrete MSAs                    Percent leased                                        90.8%
                                                                                                            Percent leased – Anchors / Small shops 2       93.8% / 84.2%
   o ~5,000 national, regional and local tenants
                                                                                                            Average grocer sales PSF 3                            ~$600

› Focus on properties that are the “centers of the communities we serve” and well-positioned to meet the    Average grocer occupancy cost 3                        < 2%

 needs of today’s consumer

   o Thoughtfully merchandised with non-discretionary essential and value-oriented retail                   Leading landlord to vibrant retailers

                                                                                                            Top Retailers by ABR     Stores     % of ABR       % of GLA
        •   ~70% of centers are grocery-anchored
                                                                                                                                         87         3.5%         3.9%

   o Convenient locations in close proximity to households, effectively serving as last mile distribution                                49         2.8%         4.8%
                                                                                                                                         125        1.8%         2.1%
        •   Drive-up format easily enables click-and-collect or curbside pickup
                                                                                                                                         30         1.8%         2.2%
                                                                                                                                         29         1.4%         1.9%
                                      Flexible Retail Format 1
                                                                                                                                         38         1.4%         1.5%
                                                                                                                                         15         1.3%         0.9%
                                                            13% Power center
                                    75%                                                                                                  20         1.3%         1.6%
                           Community /
                    Neighborhood center                      11% Grocery-anchored                                                        14         1.1%         1.2%
                                                             regional center
                                                                                                                                         26         1.0%         0.9%
                                                            1% Other                                        Top 10 Total                 433     17.4%          21.0%

                                                                                                                                                                        Page 2
Positioned To Drive Sustainable
Outperformance
Positioned To Drive Sustainable Outperformance
Cycle-tested portfolio and optimized platform

Actions taken over last five years have positioned Brixmor to navigate today’s dynamic environment and continue to create value for stakeholders

 Pre-COVID                                                                                 COVID and Recovery
  2016                                      2019                                            2020 and beyond
  ›   Management transition completed       ›   Growth inflected in mid-2019 as             ›   Brixmor outperformed throughout the disruption due to inherent portfolio strengths and
                                                the reinvestment program became                 proactive improvements made to the portfolio and platform since 2016
  ›   Balanced business plan and                a net contributor to growth
      strategy established                                                                      • Sector leading rent collection levels     • Continued execution of value-enhancing
                                                • 4Q19 same property NOI of 5.1%                                                              reinvestment activity
      • Acceleration of value-enhancing                                                         • Muted net occupancy impact
        reinvestment activity and prudent                                                                                                   • Robust liquidity and financial capacity
        capital recycling

        Portfolio and Platform Transformation 2016 - Today

         Rationalized portfolio                    Accelerated value-enhancing                        Increased exposure to                         Strengthened balance
               footprint                                  reinvestments                                  thriving tenants                                   sheet

                  $1.9B                                        >$550M                                          9.6M SF                                        $1.6B
           of dispositions over the                 of accretive reinvestment projects               of new anchor leases executed                      of available liquidity
                last five years                     stabilized over the last five years1                 over the last five years

                                                                                                                                                                                   Page 4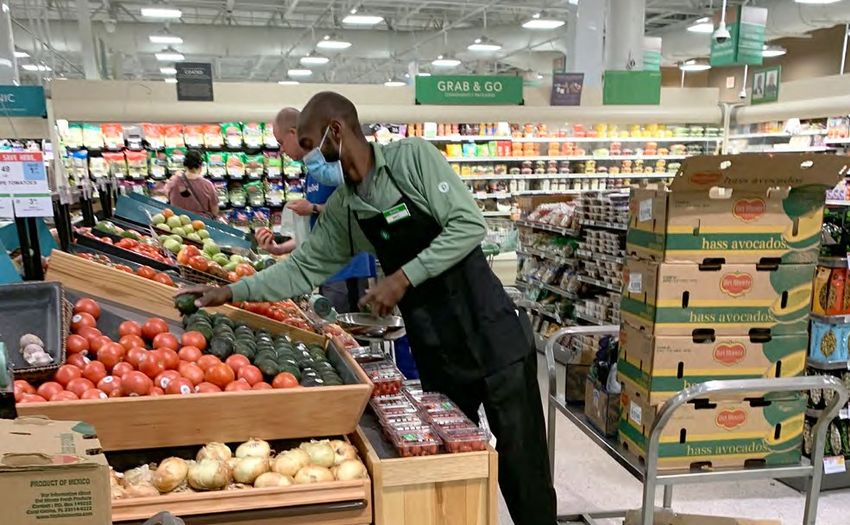
Positioned To Drive Sustainable Outperformance
Brixmor is well-positioned to capitalize on the recovery

      1                                       2                               3
     Well-located, open-air                  Best-in-class platform           Accretive reinvestment
     portfolio benefits from the             capitalizes on attractive rent   program drives substantial
     acceleration of pre-COVID               basis and delivers sector        value creation
     trends                                  leading leasing productivity

      4                                       5                               6
     Disciplined capital allocation          Highly liquid and flexible       Strength of our culture,
     delivers attractive risk-               balance sheet supports           people, and commitment to
     adjusted growth                         continued execution              ESG excellence benefits all
                                                                              stakeholders

                                                                                                            Page 5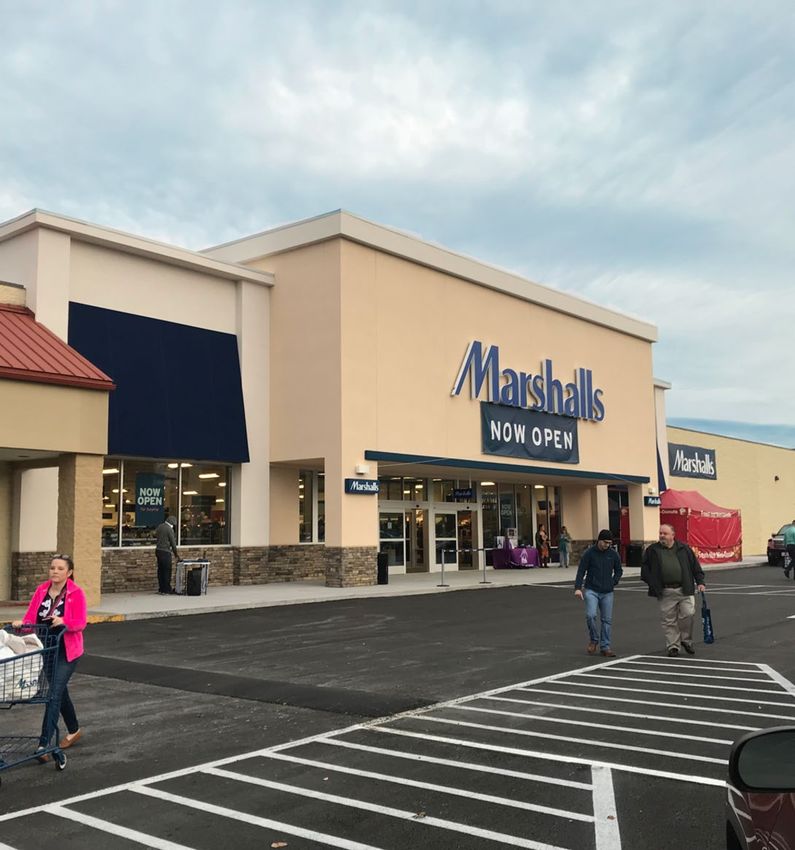
Positioned To Drive Sustainable
Outperformance

Well-located, open-air portfolio benefits
from the acceleration of pre-COVID trends
Positioned To Drive Sustainable Outperformance
Benefiting from the acceleration of pre-COVID trends

  Consumers                                                              Retailers

   ›   Importance of convenience and ease of use                          ›   Renewed focus on proximity and being local

   ›   Accelerated shift to buy online, pick-up in store (“BOPIS”) and        o Increased need for last mile delivery and micro-fulfillment
       curbside pickup                                                          capabilities

   ›   Added work-from-home flexibility and trend toward                  ›   Further shifting of sales from department stores to off-price /
       suburbanization is reallocating daytime traffic from urban to          value retailers
       suburban markets
                                                                          ›   Relocation of traditional enclosed mall retailers to open-air
                                                                              formats

         Brixmor’s well-located shopping centers are the centers of the communities they serve, featuring a high
         proportion of essential tenants, including productive grocers and a diverse mix of relevant, high credit retailers

                                                                                                                                                Page 7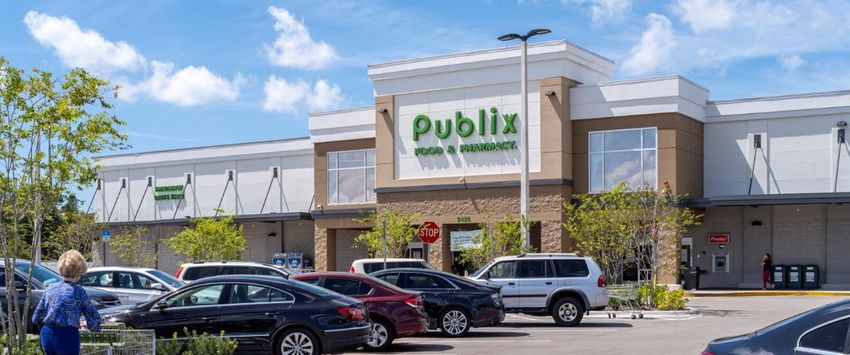
Positioned To Drive Sustainable Outperformance
                                                                                                                               Announced Store Growth Plans
Shopping center format is ideal for the changing needs of thriving retailers
                                                                                                                     Ross Stores to open 60 stores in 2021; ‘very optimistic’ about
 Retailers are refining their growth strategies                                                                      longer-term growth

                                                                                                                     Dollar Tree to open 600 stores in 2021; expanding new
 › Consumer accessibility                                                                                            ‘combination store’ concept

                                                                                                                     National Vision to open 75 new stores per year
    o Seamless omni-channel options

                                                                                                                     Burlington Stores to open 100 stores in 2021; cites
    o Knowledgeable staff and personal service                                                                       ‘significant market share opportunity’

                                                                                                                     Sprouts plans 10% store growth per year, including new smaller
 › Efficiency and profitability                                                                                      format

    o Last mile distribution capabilities (BOPIS, curbside pickup, delivery, etc.)                                   Ulta Beauty to open 40 net new stores per year

                                                                                                                     Target to invest $4 billion annually on store expansion, remodels,
    o Technology investments focused on marketing and reducing friction at checkout
                                                                                                                     online

    o Omni-channel sustainability benefits                                                                           Bath & Body Works to open 50-75 new stores a year,
                                                                                                                     primarily off-mall

          • Bulk shipments to retail centers result in fewer truck trips and the ease of returns at retail centers
                                                                                                                     Dick’s Sporting Goods opened four stores in March and
            reduces waste and greenhouse gas emissions                                                               launching new off-price concept

                                                                                                                     Five Below to open 170-180 new stores in 2021; says new stores
                                                                                                                     remain top growth opportunity
                                                                                                                                                                                 Page 8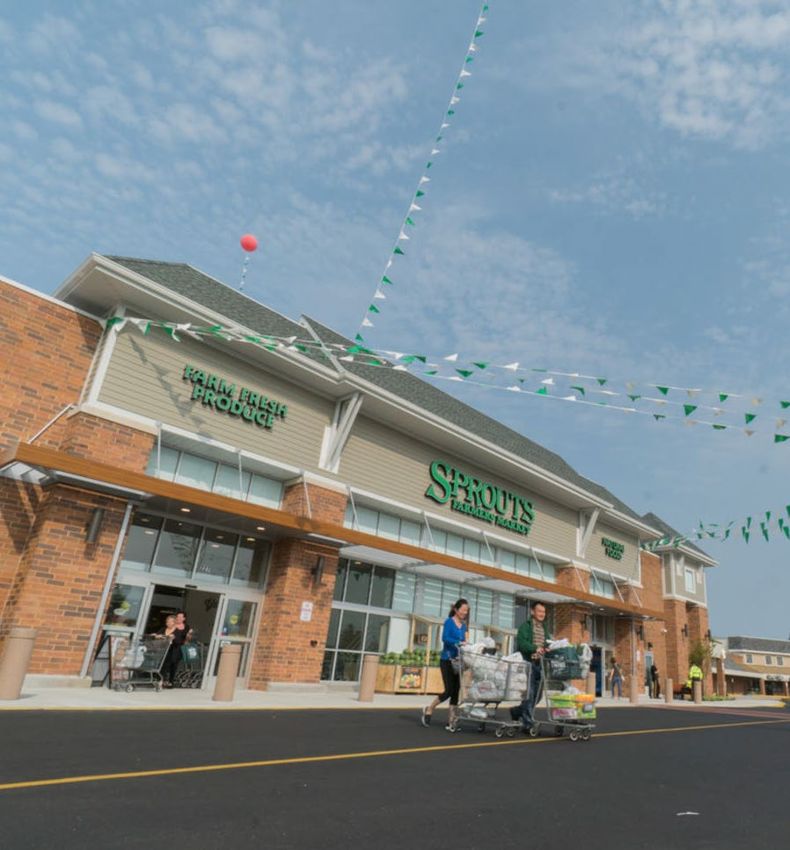
Positioned To Drive Sustainable Outperformance
Importance of brick & mortar

 Brixmor’s flexible retail format and proximity to consumers help tenants drive sales and engage with customers

                                                         We have created what we believe to be an
 Our number one asset is our stores.                                                                                  Our performance in the first quarter was outstanding on every                 More than 95
                                                         industry-leading store pickup experience that
 They are our number one asset due to                                                                                 measure, and showcased the power of putting our stores at the                 percent of Target's
                                                         our customers value and now expect from
 their proximity to our customers and                                                                                 center of our strategy… Importantly, market-share gains of more than          first quarter sales
                                                         us. So our stores will look different over time
 the uplifting customer experience they                                                                               $1 billion in the first quarter, on top of $1 billion in share gains a year   were fulfilled by its
                                                         in terms of function, size and possibly even
 enable our associates to deliver.                                                                                    ago, demonstrate Target’s continued relevance with our guests, even           stores
                                                         quantity, but they remain incredibly valuable
                                                         at a cornerstone of our strategy.                            as they have many more shopping options compared with a year ago

                                                                                       You can't create omni-customers without stores.
                                                                                       So stores matter, they really do and they remain a              These same-day services, along with ship-from-store, are
                                                                                       very important underpinning of our strategy. We'll              fully enabled by our stores, which are the hub of our
 We believe that history will demonstrate that the physical manifestation              continue to open new stores.                                    industry-leading omnichannel experience, both serving our
 of a brand will prove to be the most compelling and capital efficient way                                                                             in-store athletes and providing over 800 forward points of
 to engage and inspire customers in a physical world.                                                                                                  distribution for digital fulfillment.

                                                                                         Starbucks has always excelled at meeting
              Digital sales growth was strong, up 22%, and                               our customers where they are, even as                     Currently, about 85% of our stores in the United States are
              accounted for 42% of net sales versus 31% last year.                       transactions in the current environment                   located in open-air centers, which we believe gives us an
              Our stores played a critical role in supporting this                       have migrated from dense metro centers                    advantage relative to our mall-based competitors. Open-air
              heightened digital demand by fulfilling nearly 45%                         to suburbs and from cafes to drive-thrus.                 centers provide a better, more convenient experience for
              of digital sales, up significantly from 35% last year                                                                                same-day pickup and curbside pickup of online purchases.

                                                                                                                                                                                                                    Page 9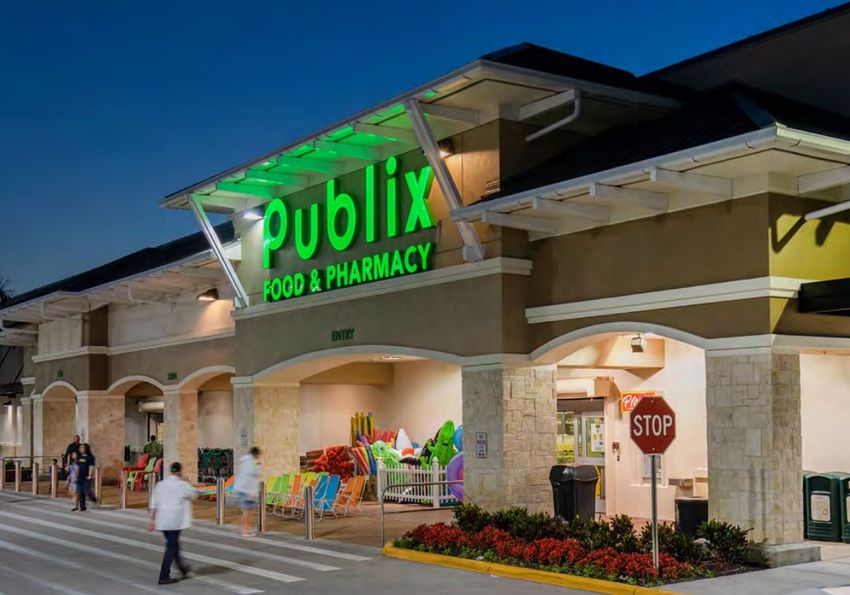
Positioned To Drive Sustainable
Outperformance

Best-in-class platform capitalizes on
attractive rent basis and delivers sector
leading leasing productivity
Positioned To Drive Sustainable Outperformance
One of the largest retail landlords in the US, while remaining nimble and   › 389 shopping centers
proactive at the asset level
                                                                            › 68M SF
                                                                            › 480 employees1
                                                                            › 78 leasing professionals in
                                                                             proximity to the real estate
                                    Leasing

                                                                            › 4 regional offices each with
                                                                             operating capabilities
                       Capital
                                                 Operations                    o Leasing
                      Recycling

                                                                               o Reinvestment

                                                                               o Construction
                                  Reinvestment
                                                                               o Transactions

                                                                               o Legal

                                                                                                             Page 11
Positioned To Drive Sustainable Outperformance
Best-in-class, fully integrated national operating platform supported by a depth of local market knowledge
National Accounts Leasing Local Market Leasing
› Utilizes deep relationships with retailers to › Provides best-in-class leasing and operational
understand their evolving needs service
o Near and long-term o Site and demographic criteria Sector Leading Leasing › Embodies an ownership mindset, allowing the
expansion plans Productivity (1Q21) platform to quickly react to changes in local
o New store concepts / market conditions
o Market strategies prototypes >650K SF $17.06 20%
of new new lease new lease › Targets and cultivates relationships with successful
› Drives superior asset management outcomes leases ABR PSF rent local merchants and entrepreneurs
executed spreads
o New and renewal o Use and development › Maintains valuable partnerships with
leasing consents municipalities to expedite various permitting and
business formation processes
o Coordination o Conflict resolution
throughout deal
process (ex. legal, o Specialty leasing initiatives
construction)
› Sponsorship is highly important to retailers as they
execute on their real estate strategies in an increasingly
dynamic environment
Page 12Positioned To Drive Sustainable Outperformance
Vibrant new retailers added over the last three years
Page 13Positioned To Drive Sustainable Outperformance ABR PSF Trajectory
$18.20
Ability to generate attractive long-term growth with lower relative risk $17.06
$16.27
$15.05
Mark-to-market opportunity
In place TTM 1Q21 New Lease
New Leases New Leases Pipeline
› Attractive rent basis due to historic portfolio under-investment and under-management
o TTM new lease spreads of 19% Revenue Growth Opportunity
o Significant revenue growth opportunity from near-term expiring leases 24% $17.06
Spread
$13.76
› Ability to drive small shop occupancy and rate as a result of portfolio improvements made over
the last five years
In Place ABR PSF 1Q21
1
Expiring 2021 - 2023 New Leases
Tailwinds from executed leasing
› $40M of ABR from leases signed but not yet commenced Expected Commencement of Leases Signed
But Not Yet Commenced ($M)
o 50% anchor / 50% small shop Commencing in Period
$40
Previously Commenced
$28 $12
o Average ABR PSF of $16.82
$10 $18
$28
o ~70% expected to commence by year-end 2021 $10
1H21 2H21 1H22+
Page 14Positioned To Drive Sustainable Outperformance
BRX portfolio billed occupancy of 87.8% is
Significant remaining occupancy opportunity against a backdrop of 210bps below peer group average1
accelerating leasing demand
89.9%
› Positioned to grow occupancy by capitalizing on robust, broad based leasing demand
87.8%
› Productivity is accelerating across nearly all categories and tenant types (anchor and small shop)
o Specialty grocery, home, general merchandise, value apparel, pet, restaurants, and health and wellness,
among others BRX Peer Average
› 1Q21 leasing volumes were on par with pre-pandemic levels
New lease volume (by count)
Broad Based Demand
Small Shop Anchor
147 140
14 15
133 103
125
14
89
1Q19 1Q20 1Q21
Page 15Positioned To Drive Sustainable Outperformance Accretive reinvestment program drives substantial value creation
Positioned To Drive Sustainable Outperformance
Leading value-add player in the open-air retail space
                                                                                                                          Village at Mira Mesa | San Diego, CA

› Brixmor’s reinvestment opportunity stands apart within the open-air retail sector based on magnitude and velocity

› Reinvestment pipeline is an attractive value multiplier that will drive significant value creation over the long-term

   o Granular, shorter duration projects with minimal risk

                                                                                                                          Beneva Village Shoppes | North Port, FL

        Proven track record of                   Anticipated acceleration                  Long-term value creation
         execution since 2016                            in 2021                                  potential

    • >170 projects completed                 • 39 projects expected to stabilize       • >$1B reinvestment pipeline
                                                in 2021
    • >$550M invested (~$4M                                                             • $150 - $200M annual delivery
      average project size)1                  • $184M of net estimated costs1              goal                           Florence Plaza-Florence Square| Cincinnati, OH

    • 11% incremental NOI yield2              • 11% expected incremental NOI
                                                yield2
    • ~$440M of value created3

                                                                                                                                                                 Page 17
Positioned To Drive Sustainable Outperformance
Flexible, lower risk reinvestment program Creating value at lower risk
Substantial value creation Effectively pre-leased
BRX Redevelopment Representative Representative Redevelopment vs. Highly accretive returns
Only Ground-up Development Ground-up Development
Total investment $200M $600M ~1/3 the amount invested
Smaller project sizes / shorter timelines
Yield ~9% ~7%
Residual cap-rate 6.0% 6.0% Incremental follow-on growth impact
Value creation $100M $100M Same value creation
Small percent of enterprise value in
Risk of value destruction program, with outsized impact
Residual cap-rate 6% - 8% 6% - 8%
No new ground-up development
Value creation $25 - $100M ($75) - $100M
No mixed-use projects
Driving accretive returns Improving intrinsic value Expanding future growth
Page 18Positioned To Drive Sustainable Outperformance
Roseville Center | Minneapolis, MN
Reinvestment case study: Roseville Center - before
Value creation at lower risk BEFORE
Impetus for Reinvestment
› Located in a densely populated market
› Lack of direct competition; under-served population; notable voids in pet, fitness and grocery
› Center was 57% leased with no anchor
› Outdated appearance (last renovated in 1980s)
Reinvestment Transformation
› Invested $7M at an incremental NOI yield of 9%1,2
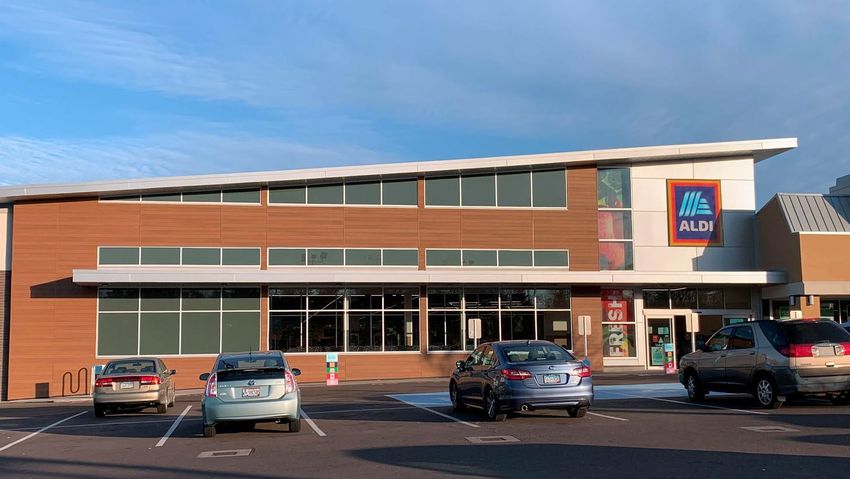
o Demolished 26K SF of retail space to accommodate the construction of a new 25K SF ALDI
o Reconfigured underutilized small shop space and completed shopping center upgrades
o Compressed cap rate by ~250bps3
Minimal Risk
› Leases executed and costs locked in prior to commencement
› Expected completion in under three years
› Follow-on accretive value creation:
o Addition of a new US Bank outparcel
o Potential upside from low rent near-term small shop expirations
Page 19Positioned To Drive Sustainable Outperformance
~$4 M
Reinvestment case study: Roseville Center - after of value created1
AFTER
Operational improvements
Percent leased up 3,850bps ABR PSF increased 26%
$19.87
95.7%
$15.79
57.2%
2yrs Prior to As of 3/31/21 2yrs Prior to As of 3/31/21
Reinvestment Reinvestment
Page 20Positioned To Drive Sustainable Outperformance Disciplined capital allocation delivers attractive risk-adjusted growth
Positioned To Drive Sustainable Outperformance
Demonstrated track record of disciplined capital allocation

   Capital Recycling                                                             Investment Strategy

  ›   Disciplined execution focused on maximizing the risk-adjusted hold IRR     ›   $409M of in process reinvestment projects with ~$1B of projects
      of the portfolio                                                               identified in the future pipeline

      o Taking advantage of liquidity in the transaction market to capture NAV   ›   Prudent acquisitions

  ›   Rationalizing portfolio footprint and disposing of higher risk assets          o Acquisitions from identified target list can leverage the platform to
                                                                                        drive growth and long-term value
                         $1.9B                     > 25%
                  of dispositions over          of 2016 portfolio                    o $384M of acquisitions completed over the last five years (including
                   the last five years           has been sold                          The Center of Bonita Springs acquired in April 2021)

  ›   Harvesting capital from centers where value has been maximized             ›   Outstanding indebtedness reduced by ~$1B over the last five years

  ›   Demographics on dispositions have been well below portfolio average

      o Population (5-mile) ~30% below

      o Avg. HH income (5-mile) ~16% below

                                                                                                                                                               Page 22
Positioned To Drive Sustainable Outperformance
Acquisition Case Study
National platform provides large opportunity set for potential acquisitions The Center of Bonita Springs
Fort Myers, FL
Plymouth Square
Philadelphia, PA
Arborland Center • Acquired April 2021 for $48M
Ann Arbor, MI
• 281K SF community shopping center located
Upland Town Square
Riverside, CA in the high-income market of Bonita Springs
• Anchored by a highly-productive Publix and
a Bealls Outlet|Home Centric
Value add opportunity
› Complements Brixmor’s four other assets in
the market
› Below-market rent opportunity
The Center of Bonita Springs
Fort Myers, FL › Small shop occupancy upside
Plaza by the Sea
Los Angeles, CA › Potential to add density
Centennial Shopping Center
Denver, CO
Venice Village
North Port, FL
Page 23Positioned To Drive Sustainable Outperformance Highly liquid and flexible balance sheet supports continued execution
Positioned To Drive Sustainable Outperformance
Highly liquid and flexible balance sheet                                                                              Capitalization & Ratios (at 3/31/21)
                                                                                                                      Debt Statistics
                                                                                                                       Weighted avg. stated interest rate           3.7%
› Substantial liquidity, fully unencumbered balance sheet and no near-term debt maturities, providing                  Weighted avg. maturity                     5.5 years
 critical financial and operational flexibility
                                                                                                                       Fixed / Variable                          100% / 0%

                                                                                                                       Unencumbered ABR                            100%
   o $1.6B of available liquidity, comprised of ~$370M of cash and ~$1.2B of revolver capacity
                                                                                                                      Leverage & Coverage Ratios1
› Well-covered dividend                                                                                                Net principal debt to adjusted EBITDA        6.5x

                                                                                                                       Fixed charge coverage                        3.7x
   o Dividend payout ratio (as a % of NAREIT FFO) of 48.9% for the three months ended March 31, 2021
                                                                                                                      Credit Ratings
   o Dividend yield of 4.3% at March 31, 2021                                                                          Fitch                                   BBB- / Stable

                                                                                                                       Moody’s                                 Baa3 / Stable

                                                                                                                       S&P                                     BBB- / Stable

                                                                   Minimal Near-term Debt Maturities ($M)

                                                  Available Cash         Revolver Availability      Unsecured Notes            Term Loans
                            $1,617

                            $1,245
                                                                           $800        $700                                         $753        $800
                                                               $500                              $608
                                                                                                          $400        $358
                                                    $250
                             $373        $0

                           Liquidity    2021        2022       2023       2024        2025       2026     2027        2028         2029         2030
                                                                                                                                                                           Page 25
Corporate Responsibility Strength of our culture, people, and commitment to ESG excellence benefits all stakeholders
Positioned To Drive Sustainable Outperformance
Prioritizing the well-being of our stakeholders
› We strive to create partnerships that improve the social, economic and environmental well-being of all our stakeholders: our communities, employees, tenants, and investors
› Our Board of Directors is actively engaged in overseeing our commitment to operating in a socially responsible manner
   o Senior management provides frequent updates to the Board of Directors on our progress on each of our ESG initiatives

   o Supported by the ESG Steering Committee, which is comprised of individuals from multiple disciplines across the Company and led by our Senior Vice President,
     Operations & Sustainability

        •   Focuses on setting, implementing, monitoring, and communicating the Company’s CR strategy and related initiatives

                               Our Culture                                Our Properties                           Our Stakeholders
                               Fostering an inclusive and collaborative   Redeveloping and managing assets while   Creating true partnerships that improve
                               workplace with deep employee               minimizing environmental impact and      the social, economic and environmental
                               engagement and high ethical standards      integrating seamlessly into our          well-being of all while generating stable
                                                                          communities                              long-term growth

                   View Brixmor’s Corporate Responsibility Report at: https://www.brixmor.com/why-brixmor/corporate-responsibility                                       Page 28
Positioned To Drive Sustainable Outperformance
Helping Our Retailers Succeed During COVID
Tenant partnerships
Defining local communities by connecting dynamic, relevant retail with unique
local culture
BrixAssist
› We support >5,000 national and regional tenants and local entrepreneurs across the country Ensuring we support local businesses through crisis
Maintaining a robust COVID resource website geared specifically to local, small
› We aim to be a key partner in the success of our retailers shop tenants
o Proactive property o Ongoing tenant o Marketing Providing local, small shop tenants with resources and assistance to aid in
management coordination support accessing federal relief programs (Payroll Protection Program and Main Street
Lending Program)
› We monitor our success through biennial tenant engagement surveys and make changes based on
feedback received Creation of a Restaurant Re-Emergence Mastermind Program
Amplifying tenant messaging through Brixmor social media efforts
Actively engaging in public advocacy initiatives
Supporting all tenants onsite, including through the use of additional signage
and the accommodation of BOPIS and curbside pick-up
o Dedicating parking to support BOPIS and curbside pick-up
o Focusing on safety and hygiene considerations
o Facilitating additional outdoor space, including for dining and fitness classes
o Providing incremental storage and security, as required
Page 29Positioned To Drive Sustainable Outperformance
› Recognition
Environmental responsibility
Reducing our environmental impact Providing enhanced transparency
GOLD LEVEL GREEN STAR
› Converting to LED lighting › Aligning external reporting with industry standard frameworks RECOGNITION RECIPIENT
› Installing electric vehicle charging stations o Task Force on Climate-related Financial Disclosures (TCFD)
› Reducing electric and water usage and greenhouse gas emissions o Sustainability Accounting Standards Board (SASB) › Climate Change Policy
› Partnering with tenants through green lease provisions to
facilitate installation of renewable energy developments and • Portfolio-wide climate change risk
providing tenants with lower-cost on-site renewable energy assessments to better understand
potential impacts to our
2025 Goals properties, our tenants and the
communities we serve
• Provide transparency on these
40% 40% 100% 20MW 25% climate change risks, by reporting
Common area Common area Properties upgraded Onsite renewable Properties with
electricity reduction greenhouse gas to LED energy capacity electric vehicle in line with the Task Force on
emissions reduction charging stations Climate-related Financial
Disclosures (TCFD) framework
Progress Against 2025 Goals
• Develop a roadmap to achieve net
zero carbon emissions by 2050 for
areas under our operational
>40% >40% ~80% ~9MW ~10% control
Common area Common area Properties upgraded Onsite renewable Properties with
electricity reduction greenhouse gas to LED energy capacity electric vehicle
emissions reduction charging stations
Page 30Positioned To Drive Sustainable Outperformance
Community connectivity
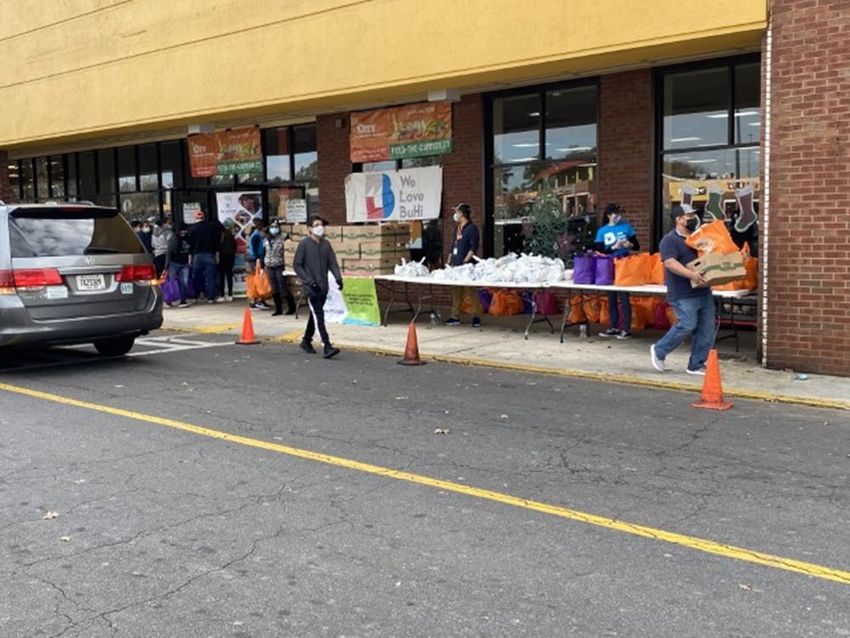
› Providing welcoming, safe and attractive retail centers
› Supporting our communities by hosting local events, volunteering, and providing aid in times of need
o Brixmor Day of Service – Company-wide annual food drive event that resulted in over 11,000 donated meals benefiting 33 different organizations in 2020
Page 31Positioned To Drive Sustainable Outperformance
Human capital management
Committed to creating and sustaining a positive work environment during uncertain times
Engagement & Connectivity Growth Health & Well-being
Creating opportunities to interact and Encouraging growth through professional and Supporting employee health through
impact communities personal training and learning opportunities engagement and outreach
› Quarterly all-employee calls › BRX Connect – allowing employees to learn other functions › Encouraging healthy lifestyles
within the Company through our internal exchange program
› Enhanced benefits and support based on employee feedback o Headspace partnership – providing guided mindfulness
› Personal development accounts – providing time off and and meditation
› Company-wide awards recognizing excellence expense reimbursement for personal or professional
development activities o Gym membership discounts
o “Our Center is You” – community service
› Leasing Assistant Development Program – a two-year intensive o Health-oriented employee competitions (like our
o “Find A Better Way” – ingenuity apprenticeship program “Summer Step Challenge” where all employees are offered
a free fitness tracker)
› Company-wide enrichment events › Predictive Index Behavioral Assessments – enhancing self-
awareness, collaboration and inclusion › Ensuring employees are safe, functional, and efficient
o “Big Brain Days” – TED-Talk style events
› Access to MasterClass subscriptions – stimulating personal o Supporting mental health awareness through free 24/7
o Board of Directors lunch series growth access to licensed therapists
o Book clubs o Providing resources for parents to help manage work-life
balance
o Community service projects – providing each employee
with two paid Service Days per year to make an impact in
their respective communities
Page 32Positioned To Drive Sustainable Outperformance
Diversity and inclusion
Creating equal opportunities for all current and future employees
› Proactive efforts for creating a culture based on diversity and inclusion
o Annual employee pledge to commit to helping Brixmor create and maintain an environment free from
harassment based on race, sexual orientation, gender, and other protected classes
o Diversity & Inclusion Leadership Council (founded in 2020)
• Reports directly to CEO
53%
Female employees
• Assists in maintaining best practices and behaviors to promote diversity and enhance inclusion
o Diversity and inclusion themes featured in employee trainings and community events Diversity & Inclusion
Leadership Council
o Partnered with Jopwell, a community and job board for diverse professionals, in order to improve our
recruitment of diverse talent
o Declared Juneteenth a Brixmor holiday
o Annually assess gender pay equity
• For 2020, there was no gender pay gap at executive levels, and for all other levels at Brixmor, the
adjusted gender pay ratio for total compensation is less than the US estimate for 2020
Page 33Positioned To Drive Sustainable Outperformance › Experienced, diversified and effective
Board of Directors
Corporate governance 89 % 1/3 59 years
Independent Female Average
Leading the industry Directors Directors Director age
Ranked #2 in REIT sector overall for Corporate Governance 6 years >75%
Average Director attendance
Director tenure at 2020 meetings
Received the highest possible corporate governance score, representing the lowest level of
governance risk
Top-ranked management team
› Board Summary
Ranked #2 among mid-cap REITs for the best financially material ESG disclosures and Strong director and officer stock ownership
communication of strategy and risk management during COVID No supermajority voting standards
Majority voting for directors
Board Composition
Committee Membership Expertise Separate Chairperson and CEO
Member Chair
Director Nominating & Investment Other Public Retail /
Board Member Age Since Audit Compensation Corporate Governance CEO / Financial Company Board Real Estate Consumer Opted out of the Maryland business combination and
control share acquisition statutes
Jim Taylor 54 2016
Pledging and hedging of BRX stock by directors and
John Schreiber 74 2013 executive officers prohibited
Michael Berman 63 2013 No cumulative voting
Julie Bowerman 52 2019
Sheryl Crosland 68 2016
Thomas Dickson 65 2015
› Shareholder Rights Summary
Unclassified Board of Directors
Daniel Hurwitz 57 2016
No poison pill
William Rahm 42 2013
Stockholder ability to amend bylaws
Gabrielle Sulzberger 60 2015
Data as of December 31, 2020. Page 34Additional Information
REITs
General information and fundamentals
What is a REIT?
A REIT, or Real Estate Investment Trust, is a company that owns, operates or finances income-producing real estate. Modeled after mutual funds, REITs give all investors access to the benefits of
real estate investment along with the advantages of investing in a publicly traded stock
How to qualify as a REIT:
Invest at least 75% of total assets in real estate
Derive at least 75% of gross income from real estate investments
Must have a minimum of 100 shareholders and no more than 50% of shares held by five or fewer individuals
Distribute at least 90% of taxable income to shareholders annually through dividends
• Nearly all REITs pay at least 100% to avoid taxation
• Allows shareholders to share in a REITs cash flow growth
Why invest In REITs?
Performance Liquidity Diversification Dividends
– The real estate market is the primary – Bought & sold daily like other stocks, – Low correlation with other stocks and – Reliable income returns through a variety
driver of REIT returns, therefore REITs may mutual funds and ETFs bonds of market conditions
be used as a liquid proxy for gaining
– REITs have made it easier to rebalance – Historically have increased portfolio – 20% deduction of any qualified REIT
access to the entire asset class
portfolios returns and reduced portfolio risk dividends (Tax Cut and Jobs Act of 2017
– Reduce portfolio volatility Sec 199A)
– Offer a balance of capital appreciation
and income
Source: RBC Capital Markets, Nareit. Page 36Footnotes & Sources
Footnotes & Sources
 Page 2    Brixmor Overview
           High quality, diversified, open-air retail portfolio
           1. By ABR. Community Centers include properties with total GLA between 125K - 400K SF. Neighborhood Centers include properties with total GLA less than 125K SF. Grocery-Anchored Regional Centers include properties greater than 250K SF with small shop spaces accounting for less
              than 30% of total property GLA, and that have a traditional or specialty grocer at the property (either owned or non-owned). Power Centers include properties greater than 250K SF with small shop spaces accounting for less than 30% of total property GLA, and that do not have a
              traditional or specialty grocer at the property (either owned or non-owned). Other includes lifestyle centers, unanchored strip centers and single tenant centers.
           2. Anchors reflect spaces equal to or greater than 10,000 square feet ("SF") of GLA; Small shops reflect spaces less than 10,000 SF of GLA.
           3. Based on most recent tenant reported information.

 Page 4    Positioned To Drive Sustainable Outperformance
           Cycle-tested portfolio and optimized platform
           1. Represents gross project costs less any project specific credits (lease termination fees or other ancillary credits).

 Page 11   Positioned To Drive Sustainable Outperformance
           One of the largest retail landlords in the US, while remaining nimble and proactive at the asset level
           1. As of December 31, 2020.

 Page 14   Positioned To Drive Sustainable Outperformance
           Ability to generate attractive long-term growth with lower relative risk
           1. Does not include month-to-month tenants.

 Page 15   Positioned To Drive Sustainable Outperformance
           Significant remaining occupancy opportunity against a backdrop of accelerating leasing demand
           1. Reflects data presented in 1Q21 disclosures. Peer group includes FRT, KRG, REG, RPAI, SITC, WRI. KRG and REG reflect same property pool only. KIM excluded as data is not provided.

 Page 17   Positioned To Drive Sustainable Outperformance
           Leading value-add player in the open-air retail space
           1. Represents gross project costs less any project specific credits (lease termination fees or other ancillary credits).
           2. NOI yield is calculated as the projected incremental NOI as a percentage of the incremental third party costs of a specified project, net of any project specific credits (i.e. lease termination fees or other ancillary credits).
           3. Assumes 6% cap rate.

 Page 19   Positioned To Drive Sustainable Outperformance
           Reinvestment case study: Roseville Center - before
           1. Represents gross project costs less any project specific credits (lease termination fees or other ancillary credits).
           2. NOI yield is calculated as the projected incremental NOI as a percentage of the incremental third party costs of a specified project, net of any project specific credits (i.e. lease termination fees or other ancillary credits).
           3. Per management estimates.

 Page 20   Positioned To Drive Sustainable Outperformance
           Reinvestment case study: Roseville Center - after
           1. Assumes 6% cap rate.

 Page 25   Positioned To Drive Sustainable Outperformance
           Highly liquid and flexible balance sheet
           1. Calculated using the current quarter annualized.

                                                                                                                                                                                                                                                                                          Page 38
Disclaimer & Safe Harbor
This presentation may contain forward-looking statements within the meaning of Section 27A of the Securities Act of 1933 and Section 21E of the Securities Exchange Act of 1934. These statements include,
but are not limited to, statements related to the Company’s expectations regarding the performance of its business, its financial results, its liquidity and capital resources and other non-historical statements.
You can identify these forward-looking statements by the use of words such as “outlook,” “believes,” “expects,” “potential,” “continues,” “may,” “will,” “should,” “seeks,” “projects,” “predicts,” “intends,” “plans,”
“estimates,” “anticipates” or the negative version of these words or other comparable words. Such forward-looking statements are subject to various risks and uncertainties, including those described under the
sections entitled “Forward-Looking Statements” and “Risk Factors” in the Company’s Annual Report on Form 10-K for the year ended December 31, 2020 and the Company’s Quarterly Report on Form 10-Q for
the quarter ended March 31, 2021, as such factors may be updated from time to time in our periodic filings with the SEC, which are accessible on the SEC’s website at www.sec.gov. Currently, one of the most
significant factors that could cause actual outcomes or results to differ materially from forward-looking statements is the adverse effect of the current pandemic of the novel coronavirus, or COVID-19, on the
financial condition, operating results and cash flows of the Company, the Company’s tenants, the real estate market, the financial markets and the global economy. The COVID-19 pandemic has impacted the
Company and its tenants significantly, and the extent to which it continues to impact the Company and its tenants will depend on future developments, which are highly uncertain and cannot be predicted with
confidence, including the scope, severity and duration of the pandemic, the speed and effectiveness of vaccine and treatment developments and their deployment, public adoption rates of COVID-19 vaccines,
potential mutations of COVID-19, including SARS-CoV-2 and the response thereto, the direct and indirect economic effects of the pandemic and containment measures, and potential sustained changes in
consumer behavior, among others. Accordingly, there are or will be important factors that could cause actual outcomes or results to differ materially from those indicated in these statements. These factors
should not be construed as exhaustive and should be read in conjunction with the other cautionary statements that are included in this release and in the Company’s filings with the SEC. The Company
undertakes no obligation to publicly update or review any forward-looking statement, whether as a result of new information, future developments or otherwise, except as required by law.
Page 39You can also read


