Comparison of Specimen Geometries for Measuring Through-Thickness Tensile Mechanical Properties of Fibre-Reinforced Polymer Composites - MDPI
←
→
Page content transcription
If your browser does not render page correctly, please read the page content below
Article
Comparison of Specimen Geometries for Measuring
Through-Thickness Tensile Mechanical Properties of
Fibre-Reinforced Polymer Composites
Rory Pemberton, Louise Crocker                   , Matthew Poole, Richard Shaw and Michael Gower *

                                          Advanced Engineering Materials Group, National Physical Laboratory (NPL), Teddington TW11 0LW, UK;
                                          rory.pemberton@npl.co.uk (R.P.); louise.crocker@npl.co.uk (L.C.); matt.poole@npl.co.uk (M.P.);
                                          richard.shaw@npl.co.uk (R.S.)
                                          * Correspondence: michael.gower@npl.co.uk; Tel.: +44-208-943-8625

                                          Abstract: Engineering design of fibre-reinforced polymer (FRP) composite components requires
                                          reliable methods for measuring out-of-plane mechanical properties in the through-thickness (T-T)
                                          material direction. Within this work, existing indirect and direct test methods and geometries
                                          for measuring T-T tensile properties have been evaluated through experimental testing and finite
                                          element analysis (FEA). Experimental testing showed variations, particularly in failure properties,
                                          for both indirect (failure strengths from 10–94 MPa) and direct (failure strengths from 48–62 MPa)
                                          geometries. Results were shown to be in good agreement with FEA, which also confirmed stress
                                          concentration factors. A linear relationship between the magnitude of stress concentration factors

                                   and experimentally determined T-T tensile failure strengths was observed for all but one of the direct
                                          geometries evaluated. Improved knowledge of stress concentration factors from this work should
Citation: Pemberton, R.; Crocker, L.;
                                          help instil confidence for industry to use T-T tensile properties determined from these methods.
Poole, M.; Shaw, R.; Gower, M.
Comparison of Specimen Geometries
                                          Keywords: fibre-reinforced polymer composites; through-thickness properties; specimen geometry;
for Measuring Through-Thickness
Tensile Mechanical Properties of
                                          mechanical testing; finite element analysis (FEA); stress concentration factors
Fibre-Reinforced Polymer
Composites. J. Compos. Sci. 2021, 5,
84. https://doi.org/10.3390/
jcs5030084                                1. Introduction
                                                Fibre-reinforced polymer (FRP) composites are seeing increasing use in engineering
Academic Editor: Frédéric Jacquemin       structures subjected to multiaxial loads including out-of-plane loads acting in the through-
                                          thickness (T-T) direction of the material. Two-dimensional FRP composites, where the
Received: 5 February 2021
                                          fibre reinforcement is only present in-plane, have low T-T tensile properties compared
Accepted: 12 March 2021
                                          to in-plane properties and can lead to damage initiation in the out-of-plane direction
Published: 16 March 2021
                                          at relatively low loads [1]. To adequately design FRP composite components against
                                          structural failure, reliable methods for determining T-T mechanical properties are required.
Publisher’s Note: MDPI stays neutral
                                          Accurate T-T property data can also facilitate and improve the proficiency of structural
with regard to jurisdictional claims in
                                          finite element analysis (FEA), whereby models can better represent structures by using the
published maps and institutional affil-
                                          full complement of elastic properties in the principal material directions.
iations.
                                                However, several issues accompany T-T test methods, making them more problematic
                                          compared to conventional in-plane test methods. These include the difficulty and expense
                                          of manufacturing thick laminates, consideration of size effects to give representative
                                          material data, the ability to produce specimens with a suitable gauge length of uniform
Copyright: © 2021 by the authors.
                                          stress state, edge effects and stress concentrations present at the transition between the
Licensee MDPI, Basel, Switzerland.
                                          gauge length and radius of waisted specimens [1]. Despite these difficulties, several
This article is an open access article
                                          methods for measuring T-T tensile strength and elastic properties have been proposed
distributed under the terms and
                                          using either “indirect” or “direct” loading. Indirect loading methods [2–6] typically use
conditions of the Creative Commons
                                          flexural or compressive loading that, due the specimen’s fibre-reinforcement orientation in
Attribution (CC BY) license (https://
creativecommons.org/licenses/by/
                                          relation to the applied load, induces T-T tensile stress in the material. Generally indirect
4.0/).
                                          methods utilise simple test configurations. However, the majority are unable to measure

J. Compos. Sci. 2021, 5, 84. https://doi.org/10.3390/jcs5030084                                              https://www.mdpi.com/journal/jcs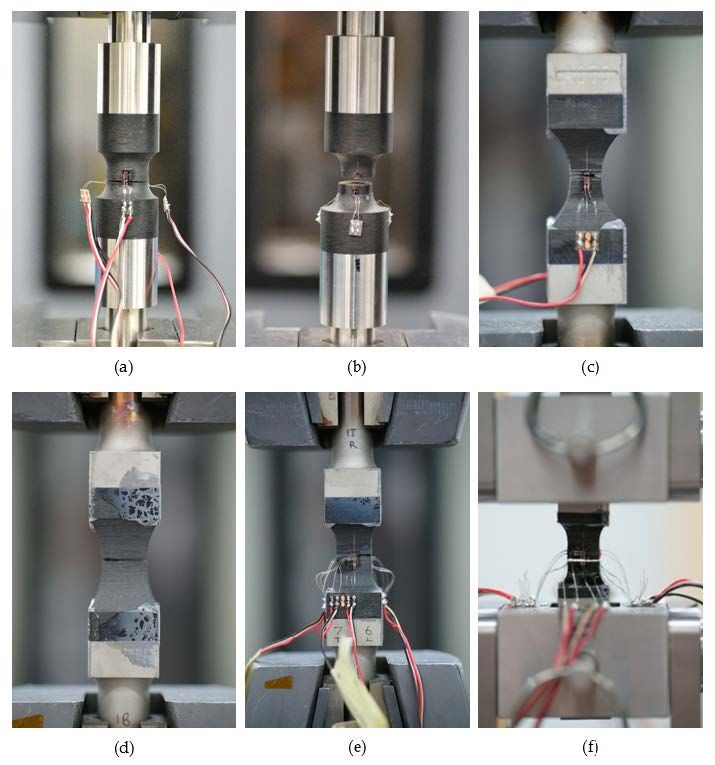
J. Compos. Sci. 2021, 5, 84                                                                                            2 of 20

                              strain for deriving elastic properties and can involve complex specimen preparation and
                              specialist machining. Direct methods [7–10] involve loading specimens that have been
                              “waisted” to produce a gauge length of a reduced cross-sectional area in which failure
                              is intended. Tensile load is applied along the T-T axis through metal end-loading bars
                              adhesively bonded to the specimen ends. Direct methods can utilise standard tensile
                              test machine configurations but require specialist specimen machining alongside labour-
                              intensive strain instrumentation and specimen preparation to ensure good alignment.
                              A major advantage is the ability for most direct methods to monitor strain and therefore
                              obtain elastic properties including Young’s modulus and Poisson’s ratios, as well as strain-
                              to-failure.
                                    Despite the work undertaken to date, T-T test methods remain less established in the
                              composite test method infrastructure compared to in-plane test methods with a lack of
                              consensus on the most suitable approach to use. This is in part due to concerns over the
                              magnitude of stress concentrations in the different geometries and the resultant knock-
                              down in failure strength. While detailed reviews of T-T methods have been conducted [11],
                              these have not experimentally compared measurements made from different methods
                              systematically on a single material system. In addition, FEA analysis across the different
                              geometry types has not been conducted to analytically determine stress concentration
                              factors. In support of an international standard under development [12], this study has
                              evaluated existing indirect and direct T-T tensile test methods reported in the literature
                              through a combination of experimental testing and FEA on a woven carbon fibre-reinforced
                              polymer (CFRP) composite. In particular, the magnitude of stress concentrations in different
                              geometries has been evaluated. Evaluation has focused on tensile methods, which are
                              considered the more difficult case from a T-T testing perspective.

                              2. Through-Thickness Geometries
                              2.1. Indirect Geometries
                                   Indirect loading methods involve applying load to a specimen in the form of com-
                              pression or flexure that due to the geometry and reinforcing fibre orientation within the
                              specimen induces a T-T tensile stress. Although still requiring specialist machining, indi-
                              rect methods tend to use simple test set-ups that can be performed with minimal expense.
                              However, not all geometries used include flat surfaces or parallel sided gauge sections
                              for measuring strain. Three different indirect geometries, obtainable from flat laminates,
                              were chosen to investigate, as detailed in Table 1. Engineering drawings showing key
                              dimensions for each geometry are provided in Figure 1.

                              Table 1. Summary of indirect test geometries.

                                          Geometry                                       Description
                                     Waisted cruciform             Cruciform specimen machined to form two perpendicular
                                              [2]                      beams transitioned using a waisted gauge section.
                                    Cylindrical punch-out            Cylindrical disc specimen containing concentric rings
                                              [3]                 machined through to mid-plane of specimen from both faces.
                                  Flexural three-point bend        Rectangular beam with longitudinal direction of specimen
                                             [4,5]                       coinciding with through-thickness direction.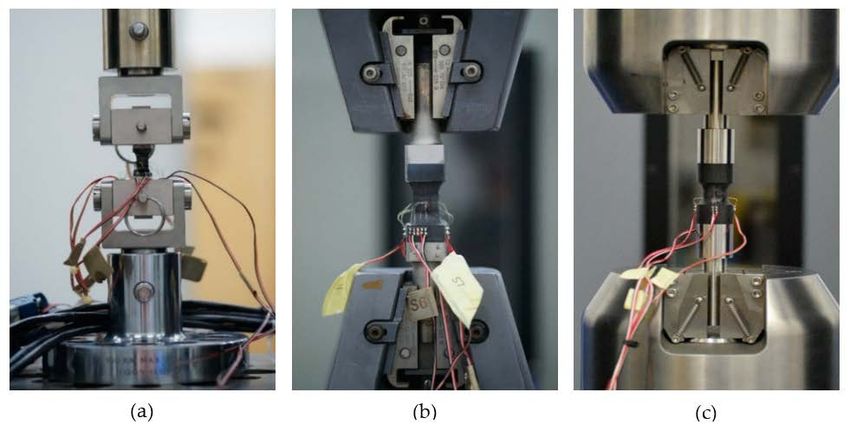
J. Compos. Sci. 2021, 5, 84                                                                                                    3 of 20

      Figure 1. Engineering drawings of indirect geometries. (a) waisted cruciform, (b) cylindrical punch-out, and (c) flexural
      three-point bend.

                                 2.2. Direct Geometries
                                       Direct loading methods involve introducing T-T tensile stress into “waisted” speci-
                                 mens through metal end-loading bars bonded to the specimen ends. These specimens can
                                 feature parallel-sided gauge sections where strain gauges can be bonded to measure the
                                 full stress–strain response of the material. Specimen machining, bonding of end-loading
                                 bars, and strain gauge instrumentation of direct geometries makes these methods more
                                 complex and therefore expensive. Six different direct geometries were chosen to investigate
                                 as detailed in Table 2. Engineering drawings showing key dimensions for each geometry
                                 are provided in Figure 2.

                                 Table 2. Summary of direct test geometries.

                                             Geometry                                        Description
                                                                      Cylindrical cross-section waisted with a fixed cross-section
                                              Spool A                    along the parallel-sided gauge length of the specimen.
                                                [7]                   Maximum gauge cross-section area reduction allowable in
                                                                                               the standard
                                                                    Cylindrical cross-section waisted with fixed cross-section along
                                              Spool B
                                                                        the parallel-sided gauge length of the specimen. Gauge
                                                [7]
                                                                      cross-section area reduction equivalent to RARDE Type III
                                        Bi-lateral waist             Rectangular cross-section continuously waisted on front and
                                               [8]                     back faces with straight vertical sections on lateral faces
                                        RARDE Type II                Rectangular cross-section waisted with variable cross-section
                                             [9,10]                                   along the length of specimen
                                        RARDE Type III              Rectangular cross-section waisted with fixed cross-section along
                                             [9,10]                         the parallel-sided gauge length of the specimen
                                      RARDE Type III (mini)             RARDE Type III specimen miniaturised by reducing all
                                             [9,10]                              specimen dimensions by factor of 1/2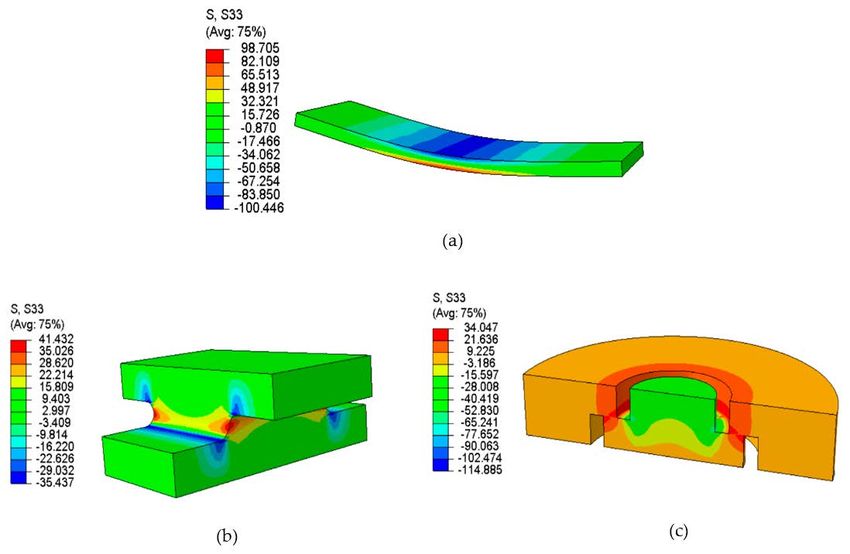
J. Compos. Sci. 2021, 5, 84                                                                                                 4 of 20

      Figure 2. Engineering drawings of direct geometries. (a) Spool A, (b) spool B, (c) bi-lateral waist, (d) RARDE Type II,
      (e) RARDE Type III, and (f) RARDE Type III (mini).

                                 3. Materials and Methods
                                 3.1. Materials
                                      Experimental testing was undertaken on a woven CFRP with an epoxy matrix. The ma-
                                 terial was supplied in the form of a flat laminate 300 mm × 300 mm with a thickness of
                                 52 mm and had a fibre lay-up of [+45◦ /0◦ /−45◦ /90◦ ]32S . The laminate had a nominal fibre
                                 volume fraction, Vf , of 52%.

                                 3.2. Specimen Machining and Preparation
                                       Initially, a minimum of 20 mm was trimmed from the edge of the laminate to remove
                                 potential material imperfections. Then, specimen blanks were extracted using a 1 mm
                                 thick diamond slitting blade and machined to the required geometries (Figures 1 and 2)
                                 by surface grinding using resin-bonded diamond grinding wheels. The process of surface
                                 grinding ensured that the machine-induced surface damage was minimised. Visual shad-
                                 owgraph inspections were undertaken on the machined areas of the specimens to ensure
                                 machining did not produce notches or other unacceptable features, alongside ensuring that
                                 the checking dimensions were within the specified tolerances as defined in each test stan-
                                 dard. Following machining, direct loading specimens were bonded to 316 stainless steel
                                 end-loading bars using Redux 312 epoxy film adhesive (Figure 3). Specimen ends were dry
                                 grit blasted and cleaned with isopropanol before being assembled, with the film adhesive,
                                 in alignment bonding rigs (Figure 3a). Assembled specimens were placed in an oven to
                                 cure the adhesive using the following cure cycle: 2 ◦ C/min ramp to 120 ◦ C, 1 h dwell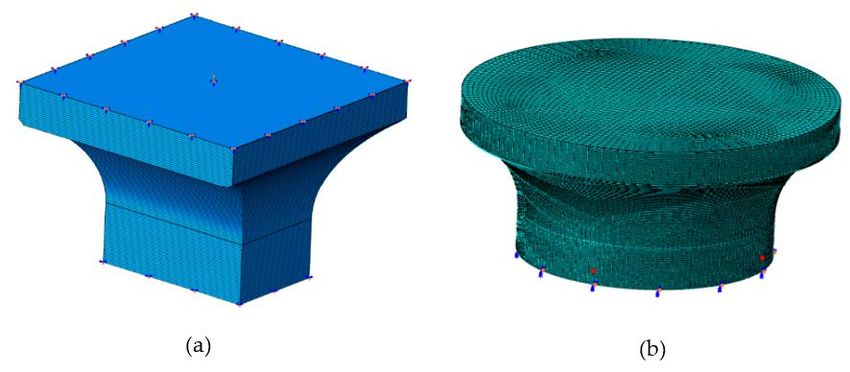
J. Compos. Sci. 2021, 5, 84                                                                                                 5 of 20

                              at 120 ◦ C, air cool to room temperature. Preparation for spool-type specimens differed,
                              as these were first turned to form oversized cylindrical blanks before being bonded to
                              internally threaded cylindrical steel end bars. Specimens were turned to the required outer
                              diameter as a composite-steel assembly to maintain symmetry during turning and then
                              waisted to the required geometry. Three-point bend and punch-out specimens were tested
                              as machined. In line with the recommendations in [2], to prevent bending during loading,
                              cruciform specimens had 2 mm thick steel beams bonded to the arms of the specimen using
                              the procedure described above.

                              Figure 3. Images of (a) alignment bonding rig used for bonding end-loading bars to direct geometries,
                              and (b) example of fully bonded RARDE Type III specimen.

                              3.3. Mechanical Testing
                                   T-T tensile tests were conducted on a range of Instron mechanical test frames fitted
                              with load cells of suitable resolution for the expected failure loads of each geometry.
                              A summary including details of the test configurations, load cell and calibration details,
                              strain instrumentation and mechanical properties obtained from each method is provided
                              in Table 3. All tests employed a crosshead displacement rate of 1 mm/min. Where
                              possible, specimen cross-sectional areas for the calculation of mechanical properties were
                              measured using a micrometer. Due to the geometry of cruciform and cylindrical punch-out
                              specimens, this was not possible, and so dimensions were measured using a Nikon MM-60
                              measuring microscope.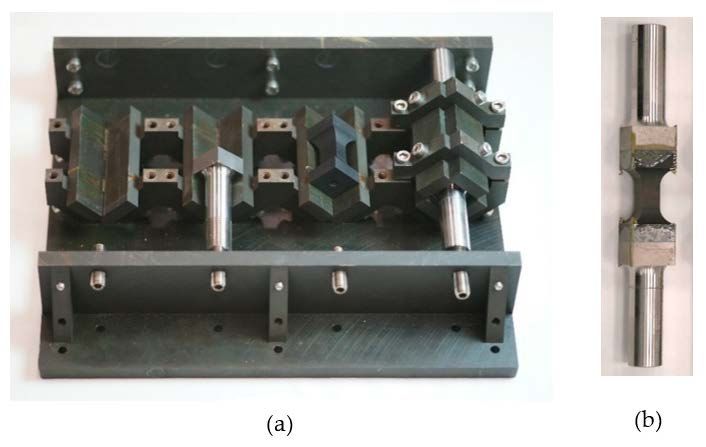
J. Compos. Sci. 2021, 5, 84                                                                                               6 of 20

                                     Table 3. Test details for different geometries tested.

                                                                                                       Mechanical
           Geometry                    Test Details                   Strain Measurement
                                                                                                       Properties
                               Instron Electropuls E3000                                          Failure strength (σ33 T )
                                                                    LVDT (± 2.5 mm travel)
       Three-point bend         250 N load cell (class 0.5)                                        Failure strain (εf33 T )
                                                                    Type: RDPE GT2500RA
                                  Three-point bend rig                                           Young’s modulus (E33 T )
                                      Instron 5500
      Waisted cruciform         20 kN load cell (class 0.5)                    n/a                Failure strength (σ33 T )
                                   U-compression rig
                                      Instron 5500
    Cylindrical punch-out      100 kN load cell (class 0.5)                    n/a                Failure strength (σ33 T )
                                 Plate compression rig
                                      Instron 5985                                                Failure strength (σ33 T )
                                                                   4× uniaxial gauges (2 mm)
             Spool A            20 kN load cell (class 0.5)                                        Failure strain (εf33 T )
                                                                     Type: TML FLA-2-11
                              Hydraulic wedge action grips                                        Elastic modulus (E33 T )
                                      Instron 5985                                                Failure strength (σ33 T )
                                                                   4× uniaxial gauges (2 mm)
             Spool B            20 kN load cell (class 0.5)                                        Failure strain (εf33 T )
                                                                     Type: TML FLA-2-11
                              Hydraulic wedge action grips                                       Young’s modulus (E33 T )
                                      Instron 5500                                                Failure strength (σ33 T )
                                                                   2× uniaxial gauges (2 mm)
        Bi-lateral waist        100 kN load cell (class 1)                                         Failure strain (εf33 T )
                                                                     Type: TML FLA-2-11
                               Manual wedge action grips                                         Young’s modulus (E33 T )
                                      Instron 5500
        RARDE Type II           100 kN load cell (class 1)                     n/a                Failure strength (σ33 T )
                               Manual wedge action grips
                                                                                                 Failure strength (σ33 T )
                                     Instron 5500
                                                                    4× biaxial gauges (2 mm)      Failure strain (εf33 T )
        RARDE Type III          100 kN load cell (class 1)
                                                                      Type: TML FCA-2-11        Young’s modulus (E33 T )
                               Manual wedge action grips
                                                                                                Poisson’s ratios (υ31 , υ32 )
                                                                                                 Failure strength (σ33 T )
                                        Instron 5500
                                                                    4× biaxial gauges (1 mm)    Young’s modulus (E33 T )
   RARDE Type III (mini)        20 kN load cell (class 0.5)
                                                                      Type: TML FCA-1-11          Failure strain (εf33 T )
                                Self-aligning coupling rig
                                                                                                Poisson’s ratio (υ31 , υ32 )

                              3.3.1. Indirect Loading Methods
                                   Flexural three-point bend tests were carried out in accordance with the procedure
                              described in ISO 20975-2 [4]. Specimens were centred on 4 mm diameter support rollers
                              spaced to give a support span of 25 mm and loaded using a 10 mm diameter-loading
                              roller to failure (Figure 4). Beam deflection at the centreline was measured using a linear
                              variable differential transformer (LVDT) to calculate strain. Young’s modulus (E33 T ) was
                              determined between 0.01 and 0.30% strain, as prescribed in ISO 20975-2 [4]. T-T tensile
                              stress (σ33 T ) was calculated from the flexural load (P), span length (L), specimen width (b),
                              and thickness (t) using the following equation:

                                                                                   3 PL
                                                                         σ33 T =         .                                      (1)
                                                                                   2 bt2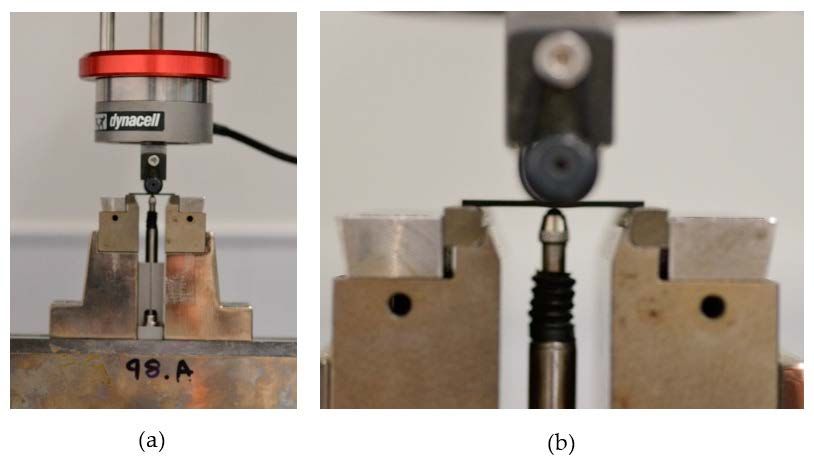
J. Compos. Sci. 2021, 5, 84                                                                                                     7 of 20

                              Figure 4. Test set-up for three-point bend testing in (a) test rig, and (b) showing linear variable
                              differential transformer (LVDT).
                                   Cruciform specimens were tested following the method described in [2]. A bespoke
                              U-shaped steel loading rig (Figure 5) was used to load the arms of the cruciform until
                              failure. The rig incorporated recesses and grooves to ensure alignment during loading and
                              was placed on a spherically seated compression platen to maintain uniform loading.

                              Figure 5. Test set up for cruciform testing: (a) image of test set-up and (b) exploded diagram.

                                   Cylindrical punch-out tests were undertaken based on the method described in [3].
                              To prevent bending, specimens were placed between two circular steel plates with a
                              bore for the entry of a push rod. The plates were secured together with six M10 bolts
                              circumferentially positioned around the plate and torqued to 5 Nm to ensure uniform
                              pressure on the specimen. Then, a 15 mm diameter push rod was used to load the specimen
                              until failure. The plates had recesses to ensure specimen alignment and were positioned
                              on a spherically seated compression platen to maintain uniform loading (Figure 6).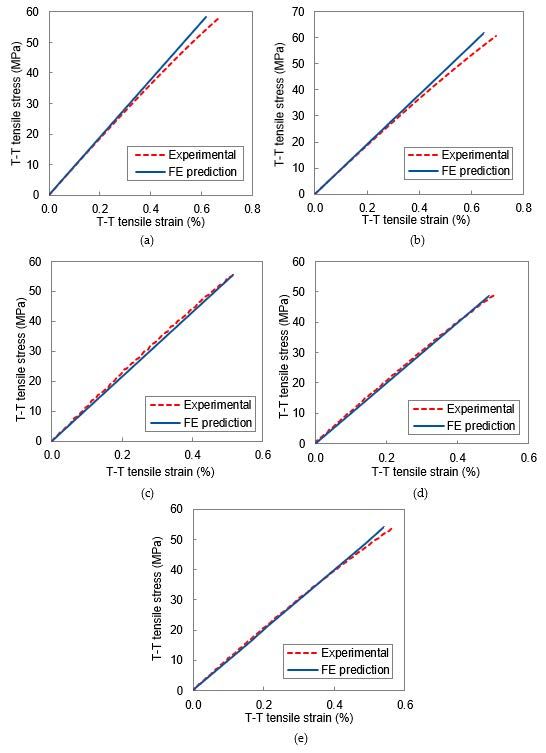
J. Compos. Sci. 2021, 5, 84                                                                                                 8 of 20

                              Figure 6. Test set-up for punch-out testing: (a) image of test set-up and (b) exploded diagram.

                                   For the cruciform and cylindrical punch-out tests, T-T tensile stress (σ33 T ) was calcu-
                              lated from the failure load (P) and specimen cross-sectional area (A) determined using the
                              following equation:
                                                                              P
                                                                       σ33 T = .                                         (2)
                                                                              A

                              3.3.2. Direct Loading Methods
                                   Before testing direct specimens, test machines were aligned to minimise machine
                              bending contributions. An alignment specimen was used to adjust the angularity and con-
                              centricity of the load string to give a minimum of Class 5 in accordance with the guidance
                              in [13]. The only exception to this was RARDE Type III (mini) specimens, which used a
                              self-aligning coupling fixture as shown in Figure 7a. Representative images of the test
                              set-up for other direct loading tests are provided in Figure 7b,c. Specimens were gripped
                              and loaded to failure through their end-loading bars in either manual or hydraulic wedge
                              action grips. Strain was measured on test specimens using Tokyo Measuring Instruments
                              Laboratory (TML) strain gauges bonded parallel to the loading direction at the mid-section
                              of the specimen gauge length using cyanoacrylate adhesive. Strain gauges, either uniaxial
                              (TML FLA-2-11) or biaxial (TML FCA-2-11) for measurement of Poisson’s ratio, with active
                              lengths of 1 or 2 mm were used dependent on the geometry and specimen gauge length, as
                              detailed in Table 3. Test results were considered valid if bending was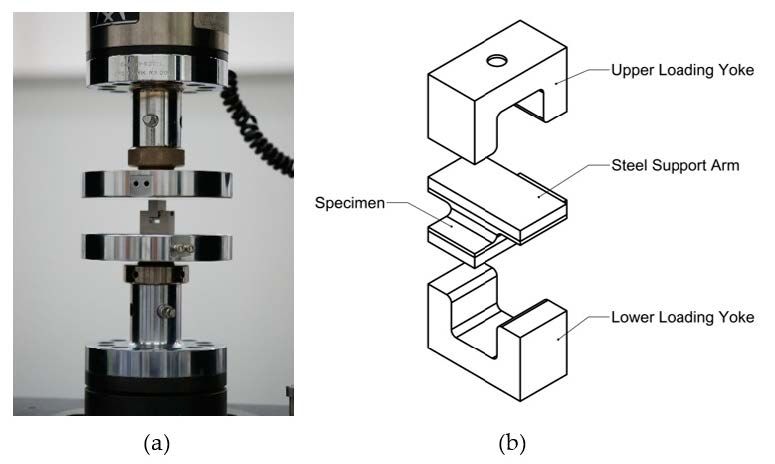
J. Compos. Sci. 2021, 5, 84                                                                                                      9 of 20

      Figure 7. Images of test set-up for (a) RARDE Type III (mini) using self-aligning coupling fixture, (b) RARDE Type III using
      manual wedge action grips, and (c) ASTM Spool in hydraulic wedge action grips.

                                  3.4. Sampling and Measurement Uncertainty
                                       At least five specimens that failed within the gauge length of the specimen were used
                                  for analysis. Unacceptable failure modes were discarded for analysis but noted as a means
                                  of assessing the repeatability of valid failures between the geometries. The uncertainty
                                  associated with a given measured property has been evaluated in accordance with the
                                  Guide to Expression of Uncertainty in Measurement (GUM) [14]. On evaluating the
                                  different uncertainty contributions, specimen to specimen variation was such that machine
                                  and instrument uncertainty contributions were considered negligible. Therefore, the
                                  reported uncertainty has been based on a Type A evaluation calculating the standard
                                  uncertainty (u) from the standard deviation (s) of n measurements as:
                                                                                   s
                                                                               u= √ .                                                (4)
                                                                                    n

                                       Based on the degrees of freedom, this standard uncertainty has been multiplied by
                                  a coverage factor k = 2.13 to give an expanded uncertainty (±U) providing a level of
                                  confidence of approximately 95%.

                                  4. Finite Element Analysis
                                       Specimen geometries were created in SolidWorks and imported into Abaqus CAE.
                                  For the direct loading cases, geometries were cut in half to create a half model to reduce
                                  model size. The model was reoriented so that the T-T direction was aligned with the z-
                                  direction. The overall laminate properties, provided by the material supplier as engineering
                                  constants (Table 4), were used to define the material behaviour as orthotropic elasticity.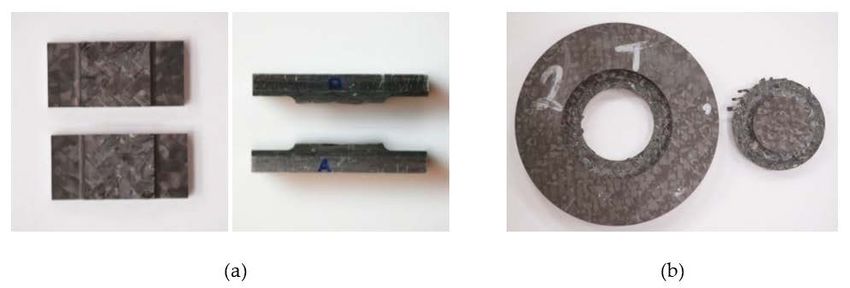
J. Compos. Sci. 2021, 5, 84                                                                                                     10 of 20

                                Table 4. Material properties for the [+45◦ /0◦ /−45◦ /90◦ ]32S composite laminate used in finite element
                                analysis (FEA).

                                               Mechanical Property                     Symbol            Value              Unit
                                        In-plane Tensile Elastic Modulus                 E11 T             67               GPa
                                       Transverse Tensile Elastic Modulus                E22 T             67               GPa
                                   Through-Thickness Tensile Elastic Modulus             E33 T             10               GPa
                                       Transverse In-plane Poisson’s Ratio               υ12             0.040               -
                                   Through-Thickness In-plane Poisson’s Ratio            υ13             0.287               -
                                  Through-thickness Transverse Poisson’s Ratio           υ23             0.479               -
                                            In-plane Shear Modulus                       G12             4.45               GPa
                                       Through-Thickness Shear Modulus                   G13             4.25               GPa
                                       Through-Thickness Shear Modulus                   G23             4.25               GPa

                                     The geometry was partitioned to control mesh generation and then meshed with
                                3D solid continuum first-order reduced integration (C3D8R) elements. The degree of
                                mesh refinement was considered, and a highly refined mesh was used. Symmetry bound-
                                ary conditions were applied at the cut face (Figure 8a). The maximum load measured
                                experimentally was applied to each geometry as a distributed load to enable the stress
                                distribution to be examined at the point of experimental failure. A failure criterion has not
                                been included in the FEA model. Nodes were defined representing the locations of the four
                                strain gauges attached to the gauge section of the samples (Figure 8b), which also shows
                                a typical mesh. These nodes were used to output the predicted strains to give a direct
                                comparison to the experimental strain gauge data. An element set was created that con-
                                tained all elements in the layer at the midpoint of the geometry (i.e., on the symmetry face).
                                The average predicted T-T stress (σ33 T ) was output from this element set. The global peak
                                stress predicted was also recorded and the stress concentration factor (scf) calculated—this
                                is defined as the ratio of peak individual stress to average stress.

      Figure 8. (a) Geometry of the RARDE Type III specimen showing the location of the loading node on the top face of the
      specimen, and (b) spool A model showing typical mesh, the symmetry boundary conditions, and the location of gauge
      nodes (red dots).

                                    For the indirect loading cases, the full sample geometry was modelled, including the
                                metal backing plates for the waisted cruciform.
J. Compos. Sci. 2021, 5, 84 11 of 20
5. Results and Discussion
5.1. Experimental Testing
5.1.1. Indirect Geometries
The results from experimental testing of the three indirect geometries evaluated are
provided in Table 5. Representative images of failed cruciform and punch-out specimens
are shown in Figure 9. These show valid tensile T-T failures with failure through the
thickness of the material away from any adhesive bond lines. T-T failures tend to be
a mixture of inter- and intra-laminar failure and as such, it can be difficult to get exact
evidence of how the failure modes progress. However, no significant difference was noted
in failure surfaces between the geometries. Failure mechanisms were not considered to
be responsible for differences in failure strength. It was established that three-point bend
specimens will always fail on the underside of the specimen in T-T tension due to the T-T
strength of FRPs being considerably lower in tension compared to compression [1].
Table 5. T-T tensile properties determined from the testing of indirect geometries.
Test Method E33 T (GPa) σ33 T (MPa) εf33 T (%)
Three-point bend 9.3 (±0.1) 94 (±2) 1.06 (±0.02)
Cruciform - 10 (±1) -
Punch-out - 33 (±1) -
E33 T = Young’s modulus, σ33 T = failure strength, εf33 T = failure strain.
Figure 9. Images of failed indirect geometries: (a) cruciform and (b) punch-out.
As shown in Table 5, only the three-point bend geometry could measure strain-related
properties including Young’s modulus (E33 T ) and failure strain (εf33 T ). This is due to
cruciform and punch-out geometries not having uniform gauge sections where strain can
be measured. A value of E33 T = 9.3 GPa for the three-point bend specimens is in the expected
region for this material (E33 T ≈10 GPa); however, it should be noted that the method was
not capable of determining Poisson’s ratios. With regard to failure strength (σ33 T ), indirect
geometries show variation with values ranging from 10 to 94 MPa. The differences in
strengths are related to complex features of the geometries leading to differing levels of
stress concentrations that lower the failure load of the specimens. These features include
perpendicular points of curvature coinciding within the gauge length (e.g., cruciform) and
small distances between points of load introduction and T-T stress regions (e.g., punch-out).
This is explained in further detail in Section 5.2.1.
The three-point bend specimens produced the highest failure strength of all indirect
geometries (σ33 T = 94 MPa). This is likely due to the simpler geometry resulting in lower
stress concentrations in addition to volumetric effects [5]. The volumetric effect arises from
T-T tensile properties of FRPs being matrix dominated, making them dependent on the
presence of voids and defects. As the three-point bend specimens used here have such aJ. Compos. Sci. 2021, 5, 84 12 of 20
small volume of material in T-T tension, this leads to a lower probability of a defect being
present in this region, enabling much higher strengths to be achieved. In order to account
for these volumetric effects, Weibull statistical analysis can be applied. However, this
requires a minimum of 30 specimens to be tested; only five were tested as part of this work.
Alongside giving lower than expected tensile mechanical properties, cruciform and
punch-out geometries are difficult to machine and require the use of bespoke test rigs.
They also present difficulties in measuring a cross-sectional area by standard methods
in order to calculate stress. In contrast, three-point bend specimen dimensions are easily
measured, and testing is undertaken using standard flexural test rigs. Whilst generally
being easier to machine, specimens at such small thicknesses (1 mm) do present an issue.
Within this work, the machining of some three-point bend specimens resulted in distortions
attributed to the relief of residual stresses in the laminate from manufacturing. Alongside
the undesirability of testing warped specimens, this also raises an issue from a sampling
perspective where certain areas of the starting laminate may have higher residual stresses
that could lead to higher variability in test data, depending on where specimens were
extracted. It should be noted that this geometry type is also strictly limited to unidirec-
tional materials and if applied to woven materials with a particularly coarse structure,
considerably larger numbers of specimens would need to be tested.
Despite the drawbacks of the cruciform and punch-out geometries, they do enable
specimens to be taken from thinner starting laminates (3–10 mm thick), which present less
of an issue from a laminate manufacturing perspective.
5.1.2. Direct Geometries
The results from experimental testing of direct geometries are provided in Table 6.
Representative images detailing typical failure locations are shown in Figure 10. All speci-
mens failed in a T-T tensile mode within the body of the material. Spool specimens were
the only direct geometries to have specimens rejected due to failure occurring outside of
the accepted gauge length: one out of six specimens tested for Spool A, and two out of
seven for Spool B. Apart from failures outside the gauge length, as with indirect geometries,
no significant differences in failure surfaces were observed, and so, failure mechanisms
were not deemed to be responsible for any differences in failure strength.
Table 6. T-T tensile properties determined from testing of direct geometries.
Test Method E33 T (GPa) υ31 υ32 σ33 T (MPa) εf33 T (%)
Spool A 9.2 (±0.1) - - 58 (±2) 0.67 (±0.03)
Spool B 9.3 (±0.1) - - 62 (±1) 0.71 (±0.03)
Bi-lateral waist 10.9 (±0.2) - - 55 (±2) 0.53 (±0.03)
RARDE Type II - - - 54 (±1) -
RARDE Type III 10.3 (±0.1) 0.08 (±0.02) 0.08 (± 0.01) 48 (±7) 0.49 (±0.12)
RARDE Type III
9.8 (±0.2) 0.07 (±0.04) 0.07 (± 0.04) 54 (±4) 0.58 (±0.09)
(mini)
E33 T = Young’s modulus, υ31 and υ32 = Poisson’s ratios in axial and transverse directions respectively,
σ33 T = failure strength, εf33 T = failure strain. Uncertainty calculated from Equation (4) in parenthesis.
Of the direct geometries investigated, all but the RARDE Type II were able to measure
Young’s modulus (E33 T ) and failure strain (εf33 T ), but only the RARDE Type III geometries
could be used to also determine Poisson’s ratios (υ31 and υ32 ). Modulus values determined
were all within the expected range for this material (E33 T ≈10 GPa) despite some variance
with E33 T ranging from 9.2 to 10.9 GPa. The exact reasoning behind this has not been fully
established, but could arise due to the differences in measuring strain on cylindrical as
opposed to flat surfaces.J. Compos. Sci. 2021, 5, 84 13 of 20
Figure 10. Failure images of direct geometries: (a) spool A, (b) spool B, (c) bi-lateral waist, (d) RARDE Type II, (e) RARDE
Type III, and (f) RARDE Type III (mini).
Failure strengths (σ33 T ) across the different direct geometries, although more consis-
tent than indirect geometries, still displayed disparity with σ33 T ranging from 48 to 62 MPa.
Of all geometry types, the spool type specimens achieved the highest strengths (58 and
62 MPa for spool A and B, respectively). The differences observed, as with indirect geome-
tries, likely result from differing stress concentrations and volumetric effects. These effects
are discussed in the context of the FEA analysis in Section 5.2.2.
All direct geometries require specialist machining, with no specific geometry posing
greater difficulty. An additional feature of T-T testing often not taken into consideration is
the effect on test results from misalignment. Both the load string of the test machine and
the specimen loading bars bonded to specimens need to be aligned sufficiently such that
bending measured across front-to-back and left-to-right faces isJ. Compos. Sci. 2021, 5, 84 14 of 20
5.2. Finite Element Analysis
5.2.1. Indirect Geometries
The predicted results from FEA are shown in Table 7. The associated contour plots
showing the T-T stress distribution in each of the three indirect geometries are given in
Figure 11. Comparing the experimental and FEA results (Tables 5 and 7, respectively) the
predictions are close to the experimental data for the three-point bend geometry. This is
also shown clearly in Figure 12, which compares the stress–strain curves for the case of
three-point bend. For the cruciform and punch-out geometries, the predicted stresses are
close to those measured experimentally. The predicted test machine displacements (not
shown in tables) are much smaller than those measured experimentally: a factor of 10
smaller for the cruciform geometry and a factor of 4 smaller for the punch-out geometry.
This is likely to be due to compliance in the test machine, which is not considered within
the model. Test machine compliance arises from deformations occurring not only in
the specimen but also in the test frame, load cell, and couplings that mean crosshead
displacements measured from the test machine are not only attributable to the specimen
and therefore cannot be used for strain determination. The effect of compliance can be seen
in the cruciform experimental curves shown in Figure 13, which are plotted alongside the
FEA prediction.
Table 7. T-T tensile properties predicted from finite element analyses for indirect geometries.
Peak σ33 T
Test Method E33 T (GPa) σ33 T (MPa) εf33 T (%) scf
(MPa)
Three-point-bend 9.3 99 1.08 99 1.00
Cruciform - 10 - 41 4.02
Punch-out - 32 - 34 1.07
E33 T = Young’s modulus, σ33 T = predicted stress, εf33 T = failure strain, Peak σ33 T = maximum predicted stress,
scf = stress concentration factor.
Figure 11. Stress contour plots for (a) three-point bend (b) cruciform and (c) punch-out geometries.J. Compos. Sci. 2021, 5, 84 15 of 20
Figure 12. Experimental and finite element analysis (FEA) predicted stress–strain curves for the
three-point bend geometry.
Figure 13. Experimental and FEA predicted stress–displacement curves for the cruciform geometry.
5.2.2. Direct Geometries
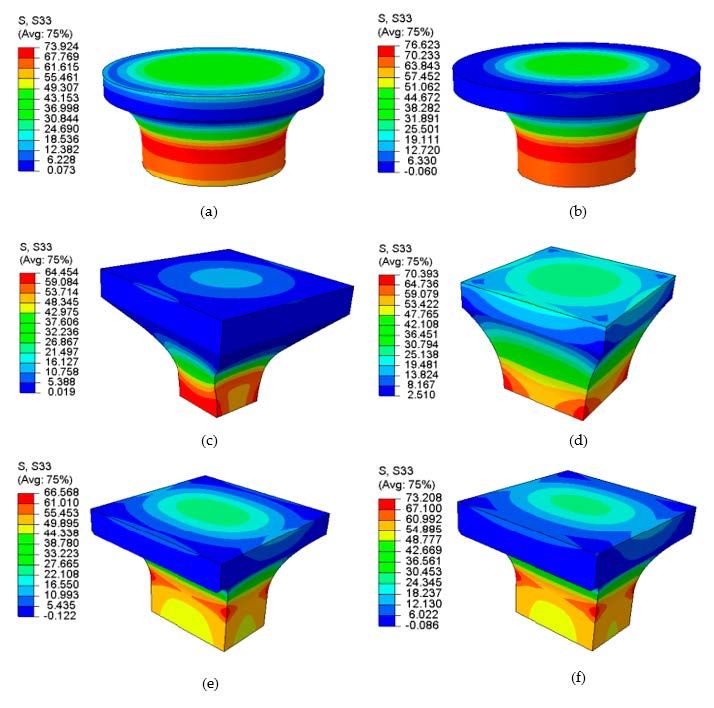
The predicted results from FEA are shown in Table 8. The associated contour plots
showing the T-T stress distribution in each of the six direct geometries are given in Figure 14.
The location of peak stress is clearly geometry dependent. In both spool A and B type
geometries and both RARDE Type III geometries, the peak stress is away from the midplane
of the specimen, whilst for the bi-lateral waist and RARDE Type II geometries, the peak
stress is in the mid-plane region.J. Compos. Sci. 2021, 5, 84 16 of 20
Table 8. Through-thickness (T-T) tensile properties predicted from finite element analyses for direct
geometries.
Peak σ33 T
Test Method E33 T (GPa) σ33 T (MPa) εf33 T (%) scf
(MPa)
Spool A 9.4 58 0.62 74 1.27
Spool B 9.6 62 0.65 77 1.24
Bi-lateral waist 10.7 55 0.52 64 1.17
RARDE Type II 9.4 54 0.58 70 1.30
RARDE Type III 10.0 49 0.49 67 1.37
RARDE Type III
10.0 54 0.54 73 1.36
(mini)
E33 T = Young’s modulus, σ33 T = predicted stress, εf33 T = failure strain, Peak σ33 T = maximum predicted stress,
scf = stress concentration factor.
Figure 14. Stress contour plots for (a) spool A, (b) spool B, (c) bi-lateral waist, (d) RARDE Type II, (e) RARDE Type III, and
(f) RARDE Type III (mini) geometries.J. Compos. Sci. 2021, 5, 84 17 of 20
Comparing the experimental and FEA results (Tables 6 and 8, respectively), the
predictions are close to the experimental data for all the geometries, as shown in Figure 15,
which compares the experimental and predicted tensile stress–strain curves for five direct
geometries (there was no experimental strain data for the RARDE Type II specimen).
The FEA predictions align closely with the experimental data, though in the two spool-type
geometries, there is a slight deviation at higher strains as the experimental stress–strain
curve becomes non-linear.
Figure 15. Experimental and finite element (FE) predicted stress–strain curves for (a) spool A, (b) spool B, (c) bi-lateral
waist, (d) RARDE Type III, and (e) RARDE Type III (mini) geometries.J. Compos. Sci. 2021, 5, 84 18 of 20
5.2.3. Stress Concentrations
Tables 7 and 8 include the predicted stress concentration factors for the indirect and
direct geometries, respectively. For the indirect geometries, the cruciform configuration has
a large stress concentration factor and the lowest tensile failure strength. The three-point
bend and punch-out geometries have similar stress concentration factors but very different
strengths. This difference can in part be explained from volumetric effects with three-point
bend specimens being much smaller; however, it is unlikely to completely account for such
large discrepancy.
For the direct loading cases, the three geometries with the lowest stress concentration
factors have the highest strengths, although it does not follow that the geometry with the
lowest stress concentration factor has the highest strength. The three RARDE geometries
have higher stress concentration factors with the RARDE Type III displaying the highest
stress concentration factor (scf = 1.37) and the lowest strength (48 MPa). Plotting failure
strength against stress concentration factor shows the existence of some outliers (Figure 16).
The RARDE Type III (mini) geometry has a slightly higher strength (54 MPa) than expected
based on the high stress concentration factor (scf = 1.36). This is also likely to result from
a volumetric effect. Conversely, the bi-lateral waist geometry has a lower strength than
expected (scf = 1.17, σ33 T = 55 MPa). The value of 1.17 for the geometries stress concentra-
tion factor is in good agreement with the findings from Hoffman et al. [8], who reported
a value between 1.1 and 1.2. The bi-lateral waist specimen is the only geometry in which
there is a large peak stress area in the gauge region (Figure 14c), meaning that these peak
values will have been included in the calculation of the average stress in the gauge region.
Hence, the difference between the average stress and the peak stress will not be as large as
it would have been if the peak stress was away from the gauge region.
Figure 16. Failure strength plotted against stress concentration factor for all indirect geometries.
The cross-sectional area of the six direct geometries varies quite significantly, from
40 mm2 for the RARDE Type III (mini) to 283 mm2 for the spool A geometry. A Weibull
analysis can be considered to take volumetric effects into account by calculating the effective
volume of each geometry, as described in [5]. The predicted stress and element volume
can be output for every element in the FEA model, and these data alongside the Weibull
modulus calculated experimentally can be used to obtain an effective volume. For Weibull
modulus calculations, the suggested number of experimental tests is 30, but in this work,J. Compos. Sci. 2021, 5, 84 19 of 20
only five specimens of each geometry were produced. This meant that any variability in
the experimental data from these small numbers of samples had a large influence on the
Weibull calculations, and hence, no clear trends between effective volume and strength
or stress concentration factor were observed. A systematic study conducting Weibull
analysis across the different geometries may be useful and could establish the dependency
of strength effects when looking at either volume or surface distributed flaws.
6. Conclusions
Test standards provide a platform for industry to obtain reliable and accurate material
property data. However, developed standards only become utilised when industry has
confidence in the data they produce. Without this confidence, engineers and designers of
safety critical load bearing structures may look to alternative sources for material properties
including theoretical or assumed values. Such practice can lead to under- or over-designed
structures either compromising structural integrity or resulting in excessively conservative
design. This lack of confidence has been expressed in proposed standards for obtaining T-T
tensile mechanical properties of composites. The findings detailed below from this work, in
particular those addressing the concerns of stress concentration factors, should help instil
confidence in the use of T-T tensile methods. Assessment has focused on tensile methods as
the most difficult case to consider from a T-T testing perspective compared to compression
or shear. The direct geometries evaluated can also be utilised for T-T compression; however,
different geometries and methods altogether are required for T-T shear.
• Cruciform and punch-out indirect geometries provide low T-T failure strengths as
a result of high stress concentrations, particularly in the cruciform geometry. These
methods are also unable to determine elastic properties.
• Of the indirect geometries, the flexural three-point bend method provides the most
suitable approach being able to determine T-T Young’s modulus and strain-to-failure
alongside failure strength. However, volumetric effects do need to be considered
through Weibull statistics to give representative material property data. In addition,
the method is strictly only suitable for unidirectional materials, and higher specimen
numbers would be required to characterise woven materials with coarse fabric struc-
tures.
• Direct geometries showed greater consistency with regard to T-T strength and elastic
properties. Discrepancies are still present, particularly for failure strength, which is
attributed to stress concentration factors and volumetric effects. In all geometries
excluding the bi-lateral waist, T-T failure strength has been shown to scale linearly
with stress concentration factor. Further work to increase the confidence in stress
concentration values determined by FEA would provide increased knowledge for
industry to use T-T properties determined from these methods.
• No direct geometry presents more difficulty with respect to testing practicality. Of
all the geometries, only the RARDE Type III geometries (large and mini—which
enables T-T properties to be measured on specimens extracted from thinner laminates
of ≈20 mm) can determine strength properties and the full complement of elastic
properties. Obtaining all properties from just one specimen reduces machining and
testing costs compared to other specimen types.
• Further work building on Weibull analysis techniques could investigate the effect of
volumetric and surface distributed flaws across the different geometries.
• Whilst the machining was closely inspected throughout this work to ensure minimal
effects of surface-induced damage and out-of-tolerance geometries, these factors could
also be variables altered to assess influence on failure strength.
Author Contributions: Conceptualization, M.G., R.S. and R.P.; Methodology, R.P.; Formal Analysis,
R.P., M.P., L.C. and M.G.; Investigation, R.P.; Resources, M.G.; Data Curation, R.P., M.P. and L.C.;
Writing—Original Draft Preparation, R.P.; Writing—Review and Editing, R.P., L.C. and M.G.; R.S.;
Supervision. All authors have read and agreed to the published version of the manuscript.J. Compos. Sci. 2021, 5, 84 20 of 20
Funding: This work forms part of the “Advanced Manufacturing Programme” funded by the
National Measurement System, part of the Department for Business, Energy and Industrial Strategy
(BEIS), as part of its support of the technological competitiveness of UK industry.
Acknowledgments: The authors wish to gratefully acknowledge Rolls-Royce for supplying the
material used in this work.
Conflicts of Interest: The authors declare no conflict of interest.
References
1. Broughton, W.R. Through-thickness testing. In Mechanical Testing of Advanced Fibre Composites, 1st ed.; Hodgkinson, J.M., Ed.;
Woodhead Publishing: Cambridge, UK, 2000; pp. 143–168, ISBN 1-85573-312-9.
2. Gerlach, R.; Siviour, C.R.; Wiegand, J.; Petrinic, N. In-plane and through-thickness properties, failure modes, damage and
delamination in 3D woven carbon fibre composites subjected to impact loading. Compos. Sci. Technol. 2012, 72, 397–411.
[CrossRef]
3. Shaw, R.M.; Sims, G.D. Through-Thickness Tensile Testing of Polymer Matrix Composites; Measurement Note DEPC-MN 007; National
Physical Laboratory: Teddington, UK, 2004.
4. ISO 20975-2:2018. Fibre-Reinforced Plastic Composites—Determination of Laminate Through-Thickness Properties. Part 2: Determination
of the Elastic Modulus, the Strength and the Weibull Size Effects by Flexural Test of Unidirectional Laminate, for Carbon-Fibre Based Systems;
International Organization for Standardization: Geneva, Switzerland, 2018.
5. Hara, E.; Yokozeki, T.; Hatta, H.; Iwahori, Y.; Ishikawa, T. Comparison of out-of-plane tensile moduli of CFRP laminates obtained
by 3-point bending and direct loading tests. Compos. Part A 2014, 67, 77–85. [CrossRef]
6. ASTM D6415-06. Standard Test Method for Measuring the Curved Beam Strength of a Fiber-Reinforced Polymer-Matrix Composites;
American Society for Testing and Materials: West Conshohocken, PA, USA, 2013.
7. ASTM D7291-15. Standard Test Method for Through-Thickness “Flatwise” Tensile Strength and Elastic Modulus of a Fiber-Reinforced
Polymer Matrix Composite Material; American Society for Testing and Materials: West Conshohocken, PA, USA, 2013.
8. Hoffman, M.; Zimmermann, K.; Middenhorf, P. Determination of the Through-Thickness Strength Properties to Predict the Failure
of Thick-Walled Composite Lugs. In Proceedings of the 20th International Conference on Composite Materials (ICCM 2015),
Copenhagen, DK, 10–24 July 2015.
9. Ferguson, R.F.; Hinton, M.J.; Hiley, M.J. Determining the Through-Thickness Properties of FRP Materials. Compos. Sci. Technol.
1998, 58, 1411–1420. [CrossRef]
10. Broughton, W.R.; Gower, M.R.L.; Loderio, M.J.; Shaw, R.M. Through-Thickness Testing of Polymer Matrix Composites; Measurement
Note MATC (MN) 06; National Physical Laboratory: Teddington, UK, 2001.
11. Olsson, R. A survey of test methods for multiaxial and out-of-plane strength of composite laminates. Compos. Sci. Technol. 2011,
71, 773–783. [CrossRef]
12. ISO/CD 20975-1. Carbon Fibre-Reinforced Plastics—Methods for Measurement of Through-Thickness Laminate Properties—Part 1: Direct
Tension and Compression; International Organization for Standardization: Geneva, Switzerland, 2018.
13. Kandil, F. A Procedure for the Measurement of Machine Alignment in Axial Testing; VAMAS Report No. 42; National Physical
Laboratory: Teddington, UK, 2001.
14. BIPM; IEC; IFCC; ILAC; ISO; IUPAC; IUPAP; OIML. Evaluation of Measurement Data—Guide to the Expression of Uncertainty in
Measurement (GUM); Technical Report 100:2008; Joint Committee for Guides in Metrology: Serves, France, 2008.You can also read