Comparison of the 22 Sept 2021 Mw 5.9 Mansfield earthquake with large or damaging Australian earthquakes
←
→
Page content transcription
If your browser does not render page correctly, please read the page content below
Comparison of the 22 Sept 2021 Mw 5.9 Mansfield
earthquake with large or damaging Australian
earthquakes
Paul Somerville and Lucinda Coates, Risk Frontiers

On 22 September 2021, a magnitude 5.9 earthquake occurred southeast of Mansfield in the Eastern
Highlands of Victoria, approximately 130 km northeast of Melbourne. The purpose of this briefing is
to compare this earthquake with large or damaging earthquakes that have previously occurred in
Australia, to provide insight into the impacts from the Mansfield earthquake. Table 1 is a list of large
or damaging Australian earthquakes ranked by magnitude, shown in Figure 1. This list uses the
preferred magnitudes from Allen et al. (2018), which produced significant downward revisions in the
magnitudes of many Australian earthquakes, with resulting changes in seismic hazard estimates
described by Allen et al. (2020). The table includes all events of M 5.7 and larger that are not located
far offshore, and smaller events that have caused significant damage and casualties.

The deaths, serious injuries and additional information in Table 1 are derived from PerilAUS, Risk
Frontiers’ database of impacts of natural hazards in Australia (in bold) and from Daniell and Love
(2010) (non-bold). Where available, ICA (2021) normalised losses, which are derived by Risk Frontiers,
are shown in bold, and normalised losses from Daniell and Love (2010) are shown in non-bold. In
both cases, the normalised insurance sector losses, which are designed to estimate the costs if
historical events were to impact current societal conditions, were estimated using the method of
Crompton and McAneney (2008). We have not yet made estimates of the losses from the 2021
Mansfield earthquake, which is shown in bold in Table 1. Only eight Australian earthquakes in Table 1
have been larger than the Mansfield earthquake.

As indicated by the Epicentre Setting listed in Table 1 and the locations of the earthquakes shown in
Figure 1, the earthquakes have occurred in a wide range of environments, ranging from urban to
rural to remote to offshore. This has evidently had a major influence on the impacts that they have
caused.

                                                                               Briefing Note 455– page 1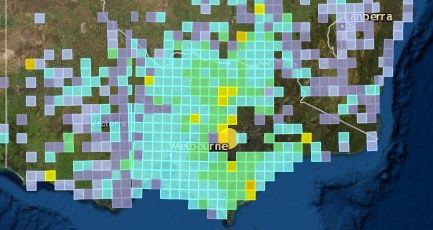
Table 1. Magnitudes and losses from large or damaging earthquakes in Australia, ranked by magnitude.

 Location                  M      Year   M    D     Long       Lat       H      Deaths   Serious       Norm. Loss   Epicentre
                                                                                         Injuries      $M           Setting
 Meeberrie, WA             6.83   1941   4    29    116.197    -26.791   25                                         Remote
 Meckering, WA             6.58   1968   10   14    116.98     -31.62    10              5             59.9         Urban
 Tennant Creek, NT         6.58   1988   1    22    133.854    -19.896   5                             2.5          Remote
 Simpson Desert, NT        6.52   1941   6    27    137.34     -25.95    0                                          Remote
 Collier Bay, WA           6.2    1997   8    10    124.333    -16.159   20                                         Rural
 Cadoux, WA                6.1    1979   6    2     117.104    -30.821   3                             41.5         Urban
 Petermann Ranges, NT      6.09   2016   5    20    129.832    -25.579   0                                          Remote
 Tasman Sea, TAS           5.93   1892   1    26    149.5      -40.4     10                                         Offshore
 Mansfield, VIC            5.9    2021   9    22    146.363    -37.491   21.5                                       Rural
 Bundaberg Offshore, QLD   5.87   1918   6    6     152.5      -23.5     10                            8.3          Offshore
 Lake Tobin, WA            5.87   1970   3    24    126.673    -22.059   15                                         Remote
 Bowen Offshore, QLD       5.84   2016   8    18    148.756    -19.821   10                            2.0          Offshore
 Northern Flinders, SA     5.79   1939   3    26    138.3      -31.1     0                                          Remote
 Marryat Creek, SA         5.7    1986   3    30    132.734    -26.31    5                             5.8          Remote
 Beachport, SA             5.6    1897   5    10    139.75     -37.3     14              5             11.5         Offshore
 Newcastle, NSW            5.42   1989   12   27    151.61     -32.952   10.5   14       30            4244         Urban
 Warooka, SA               5.2    1902   9    19    138        -35       10     2                      10.4         Urban
 Picton, NSA               5.15   1973   3    9     150.34     -34.187   28.9                          99           Urban
 Boolara, VIC              4.93   1969   6    20    146.3      -38.47    19                            15           Utban
 Warrnambool, VIC          4.89   1903   7    14    142.533    -38.433   10                            5.5          Urban
 Adelaide, SA              4.79   1954   2    28    138.564    -35.033   4               3             152.5        Urban
 Robertson, NSW            4.79   1961   5    22    150.606    -34.564   18.8                          7.2          Urban
 Ellalong, NSW             4.71   1994   8    6     151.292    -32.917   0.64                          156          Urban
 Kalgoorlie-Boulder, WA    4.16   2010   4    20    121.77     -30.745   10              1             36           Urban

                                                                                                                                Briefing Note 455– page 2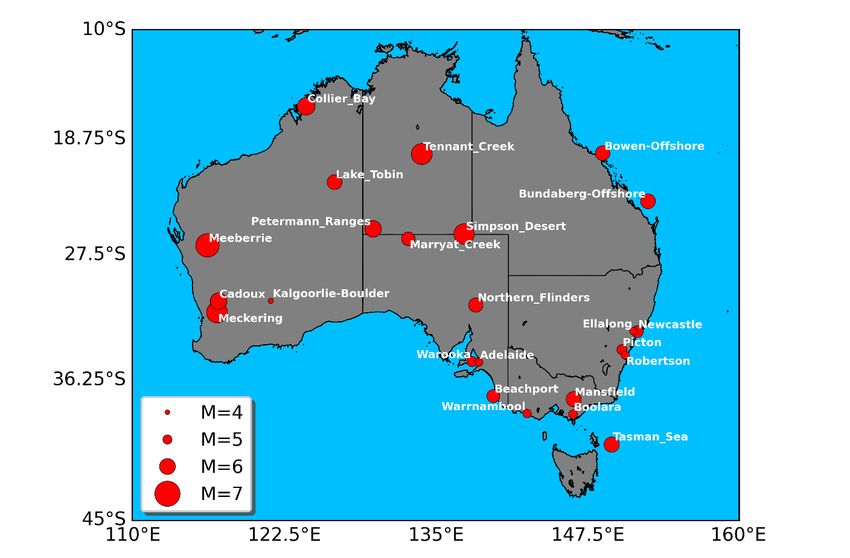
Figure 1. Large or damaging earthquakes in Australia listed in Table 1.

Most historical earthquake damage in Australia has come from small nearby events
The ranking of earthquakes by magnitude in Table 1 indicates that, along with the earthquake
magnitude and the seismic capacity of the affected buildings, the distance of the earthquake from
built-up areas is a primary factor that determines earthquake losses. Among all eight of the
Australian earthquakes having magnitudes larger than 5.9 (the magnitude of the Mansfield
earthquake), six occurred in remote, rural or offshore locations and produced no significant damage;
the same is true of the next five largest earthquakes smaller than the Mansfield earthquake, which
lie in the magnitude range of 5.7 to 5.9. Of the 14 largest earthquakes in Table 1, the only two that are
known to have caused significant damage, the 1968 Meckering and 1979 Cadoux earthquakes, both
occurred in populated regions.

In contrast, all of the earthquakes with magnitudes less than 5.7 in Table 1 caused damage. This is by
design because they were selected for that reason; to include all earthquakes would make the table
unmanageably large. There are many other earthquakes in the magnitude range of 4.7 to 5.7 that are
not listed because they did not cause significant damage. Earthquake frequencies are distributed on
a logarithmic scale, so there are approximately ten times as many magnitude 5 earthquakes and one
hundred times as many magnitude 4 earthquakes as there are magnitude 6 earthquakes.

These smaller earthquakes have historically caused more damage in Australia than larger
earthquakes because they are more numerous, and they have occurred in populated areas. Just two
small earthquakes, the 1989 Mw 5.42 Newcastle and the neighbouring 1994 Mw 4.71 Ellalong
earthquake, have caused about 90% of all earthquake losses in Australia. This is notable because
Table 1 lists 15 earthquakes larger than the Newcastle earthquake, whose magnitude was only 5.42.

                                                                               Briefing Note 455– page 3
The importance of proximity to earthquakes was vividly brought home to the residents of
Christchurch, New Zealand during the 2010-2011 Canterbury earthquake sequence (Figure 2). The 4
September 2010 Mw 7.1 Darfield earthquake (the mainshock on the Greendale fault; Risk Frontiers
Briefing Note 222) was located on the western outskirts of the city and caused the kinds of damage
that New Zealand earthquake engineers expected for an event of that size, with an estimated
insured loss of $NZ 6,623M. However, the 22 February Mw 6.2 Christchurch earthquake (Risk
Frontiers Briefing Notes 214, 215 and 216) occurred on a previously unidentified fault directly below
the CBD, and its ground motions were greatly amplified by a combination of rupture directivity and
basin resonance effects. This earthquake caused damage that lay far beyond the expectations of
New Zealand earthquake engineers, with an estimated insured loss of $NZ 19,868M. These losses
were estimated by partitioning the total estimated insured losses of $NZ33,114M obtained by
McAneney et al. (2021) assuming that these two events caused 20% and 60% of the total losses
respectively, roughly consistent with King et al. (2014).
Figure 2. Locations of the
2010 – 2011 Canterbury
earthquake sequence,
showing the location of the
4 September 2020 Mw 7.1
mainshock on the Greendale
fault, which is the 30 km
long roughly east-west red
line west of Christchurch,
and the 22 February 2011
aftershock, shown by the 10
km long yellow dotted line
striking ENE just south of
the CBD, shown by a green
square. The epicentres of
these events are shown by
the green and red stars
respectively. Source: GNS
Science.
The 1918 Bundaberg and 2016 Bowen earthquakes are most comparable to the Mansfield
earthquake
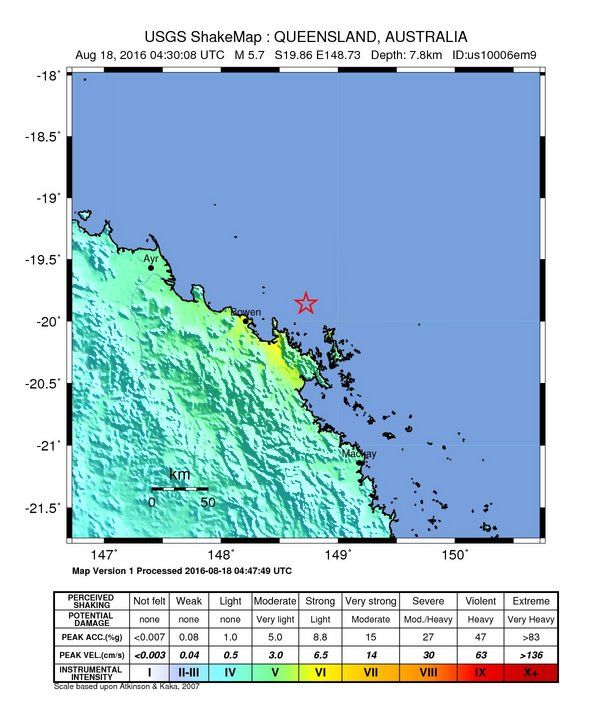
The shakemap of the 2021 Mansfield earthquake shown in Figure 3 indicates that it generated MMI
intensity IV out to a radius of about 200 km. From Table 1, it appears that the most comparable
events to the Mansfield event are the events off Bundaberg in 1918 and Bowen in 2016, because they
had similar magnitudes and were similarly distant from the affected towns. Their shakemaps and
descriptions of damage are shown in Figure 4, and their estimated normalised losses are $8.3M and
$2.0M respectively. These are quite low losses, and are almost certainly lower than the losses that
will come from the Mansfield earthquake. This would be expected because there is a much larger
population in the region around Mansfield than in the regions affected by the Bundaberg and Bowen
earthquakes.
Briefing Note 455– page 4Figure 3. Shakemap of the 22 Sept
2021 Mw 6.9 Mansfield
earthquake. The epicentre is a
yellow circle that is partly
obscured and the pixels outline
the coast. Source: Geoscience
Australia.
A magnitude 5.87 earthquake occurred about 100 km A magnitude 5.84 earthquake occurred about 30
off the central Queensland coast. It was felt over an km off the coast and about 50 km from Bowen,
area in excess of 300,000 km² extending from Mackay followed by 22 aftershocks during the next 3 days.
to Grafton (NSW) and west to Charleville. Some It triggered evacuations of buildings in Cairns and
damage occurred in Rockhampton and Bundaberg Townsville but there were no reports of serious
where a maximum intensity of MM VI was reported. injuries or damage. Precautionary shutdowns of
Over 100 towns reported felt effects associated with airports and rail infrastructure were carried out.
the earthquake. Daniell and Love (2010) estimated Very little damage was reported to contents, no
normalised losses of $8.3M. significant structural damage was reported, and
normalised estimated loss is $2M. .
Figure 4. Shakemaps and descriptions of the 1918 Bundaberg (left) and 2016 Bowen (right) earthquakes.
Briefing Note 455– page 5References
Allen, T., J. Griffin, M. Leonard, D. Clark and H. Ghasemi (2020). The 2018 national seismic hazard
assessment of Australia: Quantifying hazard changes and model uncertainties. Earthquake Spectra
36(SI), 5-43/
Allen, T. , Leonard, M., Ghasemi, H, Gibson, G. (2018). The 2018 National Seismic Hazard Assessment
for Australia – earthquake epicentre catalogue. Record 2018/30. Geoscience Australia, Canberra.
http://dx.doi.org/10.11636/Record.2018.030.
Crompton, R.P., McAneney, K.J. [2008]. “Normalised Australian insured losses from meteorological
hazards: 1967 -2006”, Environ. Science & Policy, 11, pp. 371-378.
Daniell, James and David Love (2010). The Socio-Economic Impact of Historic Australian Earthquakes.
Australian Earthquake Engineering Society 2010 Conference, Perth, Western Australia.
King, Andrew, David Middleton, Charlotte Brown, David Johnston, and Sarb Johal (2014). Insurance:
Its Role in Recovery from the 2010–2011 Canterbury Earthquake Sequence. Earthquake Spectra,
Volume 30, No. 1, pages 475–491, February 2014.
Insurance Council of Australia (2021). ICA-Historical-Catastrophe-List-July-2021
McAneney, John, Matthew Timms, Stuart Browning, Paul Somerville and Ryan Crompton (2021):
Normalised New Zealand natural Disaster insurance losses: 1968–2019, Environmental Hazards, DOI:
10.1080/17477891.2021.1905595. https://doi.org/10.1080/17477891.2021.1905595
Risk Frontiers (2011). 22 February 2011 Lyttelton earthquake, Briefings 1, 2 and 3. Briefing Notes 214,
215, and 216.
Risk Frontiers (2014). The June 13, 2011 Christchurch earthquakes, and lessons for Australia. Briefing
Note 222.
Briefing Note 455– page 6You can also read