Competition Dynamics in the Meme Ecosystem
←
→
Page content transcription
If your browser does not render page correctly, please read the page content below
Competition Dynamics in the Meme Ecosystem
Trenton Ford, Rachel Krohn, and Tim Weninger
Department of Computer Science and Engineering
University of Notre Dame
{tford5, rkrohn, tweninger}@nd.edu
Abstract
arXiv:2102.03952v1 [cs.SI] 8 Feb 2021
The creation and sharing of memes is a common modality of
online social interactions. The goal of the present work is to
better understand the collective dynamics of memes in this ac-
celerating and competitive environment. By taking an ecolog-
ical perspective and tracking the meme-text from 352 popular
memes over the entirety of Reddit, we are able to show that the
frequency of memes has scaled almost exactly with the total
amount of content created over the past decade. This means
that as more data is posted, an equal proportion of memes
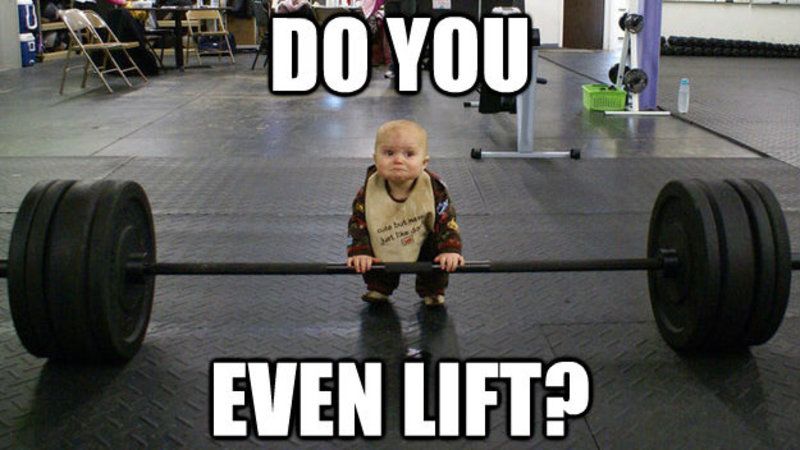
are posted. One consequence of limited human attention in Figure 1: Meme image with text meant to be condescending
the face of a growing number of memes is that the diversity to the subject. The text of this meme and others like it are
of these memes has decreased at the community level, albeit frequently used without the image in humorous or sarcastic
slightly, in the same period. Another consequence is that the contexts.
average lifespan of a meme has decreased dramatically, which
is further evidence of an increase in competition and a decreas-
ing collective attention span. One of the primary questions at the center of online social me-
dia is this: how does the limited attention of users shape the
information landscape?
Introduction One particularly compelling subset of the information land-
scape is the production and resharing of compelling memes,
With the rise of social media platforms, the cost historically which are short phrases and images. For example, the image in
associated with producing and consuming information has de- Figure 1 is a meme with text that is meant to be condescend-
creased to unprecedented levels; users and organizations can ing to the subject; oftentimes, the text of the meme is indepen-
easily share their thoughts, stories, and others’ content with dent of its image and is written in plaintext in comments and
diverse and widespread audiences with very little effort. Due tweets. The dynamics of these viral messages are not well un-
to the ease of production, the volume of content produced has derstood despite widespread attempts to predict and simulate
increased to the point that any individual user can only see their spread or popularity [3, 1]. Yet this narrow subset of the
a small portion of what is available. The reduction in con- information landscape is an increasingly visible and influential
tent production cost and increase in availability has induced communication mode with exciting properties. A meme’s pop-
a change in scarcity dynamics: from content scarcity to con- ularity can be quantified by how many times it is reproduced
sumer scarcity [30]. This shift in scarcity has birthed new re- or shared, how long it stays relevant, and how many times it is
search areas to help users see relevant content – such as rec- mutated – in the case of meme images.
ommender systems – as part of the broader attention econ- Intuition about how memes are created, transmitted, con-
omy [27]. sumed, or mutated are often derived from their association
The attention economy seeks to explain the allocation of with genes and the process of gene evolution [5] and more
cognitive resources in the creation and consumption of infor- recently, memes have been considered through the lens of epi-
mation. Though this concept existed long before the advent of demiology and disease transmission [33, 16]. Indeed, its ety-
social media [29], recent work has focused on how this model mology is a portmanteau of mind+gene, which begs the ques-
governs the dynamics of content consumers and curators in tion: rather than continuing the economic analogy, are memes
the socio-digital space [8, 9]. The main focus has been on the better situated in the realm of ecology? And if so, what kind of
consumption of information [34, 36, 12], but others focus on understanding can be gleaned from this perspective?
the production and curation of information [4, 17, 10, 28, 13]. In the present work, we derive findings about competition
1and diffusion of information from the ecological perspective. Tokens Count Examples
There are many compelling examples that motivate this per-
1 69 thicc; yeet; wat; mfw; impossibru
spective. Foremost is the concept of competition, which is a 2 80 moms spaghetti; zerg rush; y tho
driving force in genealogical, economic, epidemiological, and 3 69 winter is coming; u wot m8
ecology fields [22]. In analogical terms, the goal of competing 4 48 do you even lift; kill it with fire
memes is their continued existence within the minds and com- 5 25 hello darkness my old friend
munication patterns of people. Survival, therefore, follows as a 6 25 shrek is love shrek is life
natural extension of competition, which presumes that memes 7 18 still a better love story than twilight
are designed with survival in mind [35, 17]. 8 18 this is why we cant have nice things
The differences between the ecological perspective and oth-
ers are nuanced. Fundamentally, each perspective offers a Table 1: Meme dataset consists of 352 text memes, ranging in
unique interpretation of information dynamics. For example, length from 1 to 8 tokens. Some memes reference current pop-
within the economics perspective, human behavior (e.g., at- culture events, while others seem unconnected to trends of the
tention) is the primary focus, and memes just one of many time.
possible factors. From an epidemiological perspective, memes
are treated as a contagion (e.g., a virus), but epidemiologi- (A) ·108
cal models typically do not consider landscapes with multi-
ple viruses and their interactions. The genealogical perspec- 1.5 total posts total comments
Activity
tive treats memes as genes and explores gene-gene interac- 1
tions, but the gene perspective does not natively consider gene- 0.5
environment interactions.
0
In taking the ecological perspective, we consider a meme 2010 2012 2014 2016 2018 2020
to be a single species existing within the same environment (B) ·109
or habitat. The ecological perspective shifts the focus away
Background Language Model
from the human users and back to the memes and the environ- 3
B(t)
ments they exist within – wherein memes seek both longevity 2
and a large population, competing for limited environmental 1
resources – human attention. 0
2010 2012 2014 2016 2018 2020
Within the perspective of the meme ecology, we ask the fol-
lowing research questions: Time (Years)
RQ1: How does the collective user attention scale? Do
Figure 2: (A) Stacked line plot representation of Reddit con-
more users permit a larger or smaller number of
tributions between 2010 and 2020. The lower (orange) re-
memes?
gion shows the number of posts per month; the upper (blue)
region shows the number of comments per month. (B) The
RQ2: How do memes compete for attention? How does the unigram background model is used to compute normalized
introduction of a new meme impact the ecosystem of meme-frequencies. This background behavior closely mirrors
existing memes? the growth of Reddit, but is one order of magnitude larger.
RQ3: How have the dynamics of collective attention
changed over time? Data Collection
In summary, by using well-known metrics and concepts Using a comprehensive dataset of the 352 most popular memes
from ecology, we perform an ecological analysis of the dy- from KnowYourMeme.com, we identified their individual oc-
namics of text-memes on Reddit. The results of this analysis currences on Reddit. The memes were selected from the Con-
and the behavior they suggest are compelling and strongly sup- firmed category on KnowYourMeme, and include text-based
port the case for the ecology of memes. We find that memes memes that ranged from 250 thousand to 13 million page
comprise a relatively constant fraction of all activity on the views each. Note that the tracking of rapidly-evolving im-
platform, even as social media increases in popularity. This age templates is outside the scope of the present work; there-
suggests that as more memes are created their lifecycle dura- fore, image-memes are not included in this analysis. Extended
tion becomes shorter, which further suggests that the collective meme text (e.g., copypasta) is truncated to include only the 8-
human attention span on social media is decreasing. token prefix. The final set contains meme-phrases that range
Although the current work focuses on short, frequently re- in length from 1 to 8 word tokens as shown in Table 1. Addi-
peated texts, i.e., memes, we further hypothesize that our find- tionally, we collected all posts and comments from Jan. 2010
ings are likely to apply to a number of other communication to Jan. 2020; the number of monthly posts and comments is
modalities like image-memes and hashtags. plotted in Figure 2.
2The questions raised in the present work are considered hu- ·10−2
Mean Normalized Meme-Frequency
man subjects research, and relevant ethical considerations are 3
present. We sought and received research approval from the
Institution Review Board of redacted.
2
Collective Attention to Memes is Station-
1
ary
Previous work has shown that innovation and technological 0
development is accelerating. Moore’s Law is one example 2010 2012 2014 2016 2018 2020
of this phenomenon where a compounding increase in cir- Time (Years)
cuit density has led to remarkable increases in computational
power [26]; similar effects have been shown in genome se-
quencing [21] and telecommunications bandwidth [6]. In on- Figure 3: Average normalized meme-frequency from 2010–
line social systems, the early empirical evidence suggests that 2020 and 95% confidence interval (shaded region). Light grey
a similar pattern exists: that social innovations are accelerat- lines show the individual normalized meme-frequency for a
ing [18, 24, 14, 25]. random 10% sample of individual memes. Overall, meme oc-
This is the basis for RQ1: How does collective user atten- currence has remained consistent over the past decade (Pear-
tion of memes scale? Does the presence of larger groups result son R = +0.03, p-value< 0.01).
in super-scaling effects like those found in population densi-
ties [23] and software development [32] where collections of
individuals produce more than the sum of their parts? 2020. A selection of individual memes are also plotted in light
At first glance, Figure 2 appears to show that our data sup- grey. We find that the occurrence of memes remains remark-
ports these claims: more posts, comments, and memes are be- ably consistent when controlled for Reddit’s overall activity,
ing made at an accelerating pace year over year. But how much even as the occurrence of individual memes varies widely.
attention is paid to individual memes? To answer this question, Correlation analysis finds almost no association between time
we first need to measure collective attention. and the normalized meme-frequency (Pearson R = +0.03, p-
value·104 be decreasing at a small (0.48% per year) but steady rate (Pear-
Average Simpson Diversity Index 4 son R = −0.63, p-valueRank 2011 2013 2015 2017 2019
1 /r/pics /r/funny /r/4chan /r/me irl /r/aww
2 /r/AskReddit /r/AskReddit /r/WTF /r/aww /r/ComedyCemetery
3 /r/funny /r/WTF /r/gaming /r/pics /r/NBA2K
4 /r/gaming /r/pics /r/TumblrInAction /r/stevenuniverse /r/Right Wing Politics
5 /r/reddit.com /r/videos /r/Smite /r/AskReddit /r/gaming
6 /r/politics /r/AdviceAnimals /r/pics /r/worldnews /r/funny
7 /r/WTF /r/trees /r/AskReddit /r/woahdude /r/madlads
8 /r/comics /r/gaming /r/funny /r/nba /r/TheNewsFeed
9 /r/IAmA /r/4chan /r/dogecoin /r/Drama /r/wow
10 /r/fffffffuuuuuuuuuuuu /r/IAmA /r/sex /r/TwoBestFriendsPlay /r/OutOfTheLoop
Table 2: Top 10 most innovative subreddits by year. Colored subreddit names show the top 10 most innovative subreddits from
2010 to 2020 in aggregate.
nursery conditions appear to be transient, as subreddits can be 0.4
highly innovative one year, and not the next.
There are a few conclusions to be drawn here. Early in Red- 0.3
dit’s history, massive and highly contributive subreddits – like
Kendall’s τ
/r/reddit.com and /r/AskReddit – were the primary beachheads 0.2
for new memes. However, as years progressed the set of top
contributing subreddits became less consistent. Each new year
0.1
comes with new meme beachheads.
We quantify the degree of change in subreddit ranks
0
by computing Kendall’s (τ ) coefficient between consecutive
10/11 11/12 12/13 13/14 14/15 15/16 16/17 17/18 18/19
years. Larger τ values indicate more similarity, smaller τ indi-
Time (Years)
cates less similarity, and a negative τ represents dissimilarity.
Figure 5 illustrates τ for each pair of years where solid bars
represent statistical significance p < 0.01 and hollow bars vice Figure 5: Kendall’s rank correlation coefficient (τ ) of subred-
versa p > 0.05; there were no p-values between 0.01 and 0.05. dit innovation rankings for pairs of consecutive years. Solid
Until the 2017/2018 pairing the rank correlation trended down- bars represent p < 0.01 and hollow bars represent p > 0.05.
ward, indicating increased turnover in the topmost innovative Subreddits that consistently use new memes before other com-
subreddits. munities are ranked higher, but rankings change each year.
The 2017 to 2018 evaluation showed a return to high-rank A higher τ means more correlation between year-pairs, while
correlation, indicating less change in the top-ranked subred- lower indicates more change in their relative rankings. In gen-
dits. There are a few potential explanations for this behavior. eral, subreddit beachhead rankings have become less stable,
First, this may be due to a major Reddit policy change: be- indicating greater turnover in the top subreddits.
ginning in June 2017, Reddit removed the default subreddits,
which included many /r/pics, /r/funny, and many of the other
most innovative subreddits, and instead introduced /r/popular, Changing Dynamics of the Meme
which was a mix of posts from various subreddits as a means Ecosystem
to expose new users to a wider variety of communities1 . This
change essentially means that users “subscribe” to a wider va-
Now that we have established some of the consequences of the
riety of subreddits by default, providing a greater opportunity
competition of memes in a social media ecosystem, we turn
for innovations from niche subreddits to become more easily
our attention towards the dynamics of collective attention. Ex-
accessed. Another potential explanation for this trend rever-
isting recent work suggests that these dynamics are accelerat-
sal is due to the fact that the meme set used for our analysis
ing [18], that is, new concepts are becoming viral faster and
is biased towards more popular, and therefore older, memes.
stay viral for a shorter duration. Instead of focusing on spe-
Memes created during the last years of our analysis window
cific cultural artifacts like memes, the previous work on gen-
are less likely to have become popular enough to appear in our
eral collective behavior focused on hashtags on Twitter, com-
top-memes dataset. This may result in fewer meme entries in
ments on Reddit, and n-grams in books, etc. Does this accel-
more recent years.
eration hold true for memes? This is the basis for RQ3: How
have the dynamics of collective attention on memes changed
over time? Are we cycling through memes faster than we were
1 https://www.reddit.com/r/announcements/comments/6eh6ga/ a few years ago?
reddits new signup experience/ While we find this to be true in some ways, it is not true
5(A) its frequency across all of Reddit each day, such that Fm (t)
gives the frequency of meme m on day t. We also identify
1 the peak frequency for each meme Fi (tpeak ) and when this
peak occurred. To ensure all memes are on the same scale,
the frequencies of each meme are then normalized by that
Rm (t) = Fm (t)/Fm (tpeak )
0.8
meme’s peak to get a relative meme-frequency: Rm (t) =
Fm (t)/Fm (tpeak ). In Figure 6(A), we illustrate the average rel-
0.6
ative peak frequency Rm (t) for all memes in our dataset and
group by the year of each meme’s peak. Overall, there appears
0.4 to be no change in peak dynamics over time. The difference
between the peak and the baseline frequency (i.e., frequency
0.2
before and after the peak) remains relatively stable, nor does
it change a statistically significant amount from year to year.
Furthermore, the changes seen do not show a trend over time.
0
This suggests that memes have not exhibited a significant ac-
−10 −5 0 5 10 celeration over the past decade.
t − tpeak (Days) Next, we look closer at the velocities of memes. For each
(g)
2011 2013 2015 2017 2019 meme we compute relative gains [∆Fm /Fm ](t) = (Fm (t) −
(l)
Fm (t − 1)/Fm (t − 1) and relative losses [∆Fm /Fm ](t) =
(Fm (t)−Fm (t+1)/Fm (t+1), where gains are > 0 and losses
(B)
are < 0. We analyze the distributions of losses and gains of all
memes at all times, grouped by year. Both distributions fit well
10−2
to a log-normal distribution. Gains and losses are shown in
p(x)
Figure 6(B). While we observe some shift in gains and losses
with small magnitudes, the larger velocities do not change sig-
10−4 nificantly or regularly across years.
Taken together, both of these analyses indicate that once
104 100 10−4 10−4 100 104
the growth of Reddit is controlled for, the collective dynamics
Relative Loss Relative Gain
of Reddit memes have not accelerated. Rather, meme dynam-
2011 2013 2015 2017 2019 ics have remained remarkably consistent, even surrounding its
peak.
Figure 6: (A) Average relative meme-frequency, time-shifted
so that the maximum frequency occurs on day 0. Shaded areas
Meme Lifespans are Shrinking
indicate 95% confidence intervals. The width of the primary The previous analysis raises another interesting question about
peak has not changed, suggesting that memes have not expe- the collective dynamics of memes: Are meme lifespans grow-
rienced significant acceleration. (B) Probability distribution of ing or shrinking?
relative meme velocities divided into gains (right) and losses To answer this question we define the lifespan of a meme as
(left). Points give true distribution values, lines are fitted log- follows. For a meme with a peak frequency of Fm (tpeak ), the
normal distributions. While small magnitude gains and losses lifespan begins on the first day u where F̂m (u) ≥ αF̂m (tpeak ).
have shifted slightly, larger velocities do not change. These Recall that F̂m (t) is the normalized meme-frequency and is
stable velocities again indicate that memes have not acceler- computed as F̂m (t) = Fm (t)/B(t). The lifespan ends on
ated. the last day v where the meme experiences a normalized fre-
quency F̂m (v) ≥ αF̂m (tpeak ), such that all days between
the beginning, peak, and the end are continuous and above
when the growth of the community is accounted for. In other
αF̂m (tpeak ). The threshold value α is very small; here we
words, relative to the number of words produced on Reddit, the
present results for α = 0.005, 0.01, and 0.02. Other values
number of memes is not changing. But what about the dynam-
produced similar results.
ics of individual memes? How have they changed over time?
By defining the lifespan this way, each meme’s lifespan
captures the majority of its occurrence, but does not include
Investigating Meme Dynamics very early, late, or anomalous uses. The lifespan is also deter-
mined using normalized meme-frequencies to control for Red-
Lorenz-Spreen et al. [18] used a variety of methods to analyze dit growth. We compute the lifespan length in number of days
collective dynamics in the online social sphere. Here, we apply for each meme. For a threshold of α = 0.005, these lifespans
their methodology to our meme dataset. range from a high of 4140 days to a low of 1 day. (For com-
First, we focus on the peaks of memes on Reddit to assess pleteness, we include the full history of Reddit beginning in
the pace of collective attention. For each meme, we compute 2005 when defining lifespans.)
6(A)
(C)
80
Active Memes
60 Best fit lines
-0.25x + 3274
40 4,000 -0.20x + 2918
20 -0.17x + 2538
Average Lifespan (Days)
0
2010 2012 2014 2016 2018 2020 3,000
(B) ·10−6
Normalized Active Memes
3
2,000
2
1
1,000
2010 2012 2014 2016 2018 2020
2010 2012 2014 2016 2018 2020
Time (Years)
Time (Years)
Lifespan Threshold α: 0.005 0.01 0.02
Figure 7: Results of lifespan analysis on meme set for α = 0.005, 0.01, and 0.02. Lifespan starts on the first day with a
frequency ≥ αF̂m (tpeak ), and ends on the last day with frequency ≥ αF̂m (tpeak ), such that all days in the lifespan have a
frequency ≥ α times the maximum normalized meme-frequency. (A) Number of active memes per month, where a meme is
active only during its defined lifespan. Overall, the raw number of active memes has increased. The dip in later years is likely
the result of bias toward older memes in our dataset. (B) Number of active memes per month, normalized by total Reddit
contributions. Reddit growth is outpacing the number of active text memes. (C) Average meme lifespan (in days) over time and
corresponding best fit lines. Shaded area indicates 95% confidence interval. Over the course of 10 years, the average lifespan
has decreased (α = 0.005: Pearson R = −0.85, p-valueattention. As collective attention decreases, memes appear to Acknowledgements
rise and fall at an accelerated rate. In a system that favors the
newest, freshest content, no meme is immortal. We would like to thank Satyaki Sikdar for his help prepar-
ing this manuscript. This work is funded by the US Army
Research Office (W911NF-17-1-0448) and the US Defense
Conclusions Advanced Research Projects Agency (DARPA W911NF-17-
C-0094).
The three research questions in the present work coalesce into
an emerging theory of meme dynamics in online social bul-
letin boards like Reddit. Taking an ecological perspective, we
References
have shown that although Reddit as a whole continues to grow,
[1] Competition and success in the meme pool: a case study
the fraction of Reddit devoted to text memes is consistent. This
on quickmeme.com, volume 7, 2013.
reinforces the notion of a meme ecology, which, like the eco-
nomic and epidemiological perspectives of information diffu- [2] What’s in a name? understanding the interplay between
sion, has consequences that derive from limited user attention. titles, content, and communities in social media, vol-
We have also shown that the diversity of memes across com- ume 7, 2013.
munities is decreasing slightly, even as the number of commu-
nities continues to grow. This represents yet another conse- [3] Jim Blythe, John Bollenbacher, Di Huang, Pik-Mai Hui,
quence of the ecological perspective: as social media commu- Rachel Krohn, Diogo Pacheco, Goran Muric, Anna
nities continue to Balkanize, i.e., split into narrow and self- Sapienza, Alexey Tregubov, Yong-Yeol Ahn, et al. Mas-
referential communities, the number of shared references to sive multi-agent data-driven simulations of the github
memes appears to be decreasing. ecosystem. In International Conference on Practical
The competition among memes is also evident in the in- Applications of Agents and Multi-Agent Systems, pages
creasing turnover of beachhead communities. As memes fight 3–15. Springer, 2019.
for user and subreddit attention, cycling in and out of collec- [4] Giovanni Luca Ciampaglia, Alessandro Flammini, and
tive attention faster, large and general communities are unable Filippo Menczer. The production of information in the
to consistently integrate new memes before other smaller com- attention economy. Scientific reports, 5:9452, 2015.
munities. Instead, subreddits may rise to the top if they happen
to introduce the meme-of-the-moment, only to quickly fade [5] Richard Dawkins. The selfish gene. Oxford university
into obscurity. press, 2016.
Finally, we have shown that meme lifespans have decreased
significantly. Yet, unlike similar work on general n-grams, [6] Charles A Eldering, Mouhamadou Lamine Sylla, and
hashtags, citations, etc., we do not find that all aspects of Jeffrey A Eisenach. Is there a moore’s law for band-
meme dynamics are accelerating, and even the accelerations width? IEEE Communications magazine, 37(10):117–
are bounded by the effect of increasing competition for lim- 121, 1999.
ited user attention. The patterns of relative meme growth, even [7] James P Gleeson, Jonathan A Ward, Kevin P O’sullivan,
surrounding a meme’s peak, remain relatively unchanged by and William T Lee. Competition-induced criticality in
the expansion of Reddit. And although the absolute number of a model of meme popularity. Physical review letters,
memes active on Reddit has increased over time, this growth 112(4):048701, 2014.
has been outpaced by the growth of Reddit itself.
It is important to recognize the limitations of this study. [8] Maria Glenski, Corey Pennycuff, and Tim Weninger.
Our evaluation is principally limited by the KnowYourMeme Consumers and curators: Browsing and voting patterns
dataset. Because the popularity metric is accumulative on on reddit. IEEE Transactions on Computational Social
KnowYourMeme, it is likely that newer memes, which have Systems, 4(4):196–206, 2017.
not yet accumulated their full/final popularity, are less likely
to appear in our dataset. Our focus on the textual artifacts [9] Maria Glenski, Greg Stoddard, Paul Resnick, and Tim
of memes may also limit the generalizability of our findings. Weninger. Guessthekarma: a game to assess social rating
Much of the online meme culture, especially recently, is con- systems. Proceedings of the ACM on Human-Computer
veyed through visual depictions of memes [31]. We necessar- Interaction, 2(CSCW):1–15, 2018.
ily assume that textual representations of visual memes follow [10] Maria Glenski and Tim Weninger. Rating effects on so-
proportionately, but we are unable to validate this claim in the cial news posts and comments. ACM Transactions on
current work. Future work should endeavor to confirm these Intelligent Systems and Technology (TIST), 8(6):1–19,
findings on visual imagery. Finally, the present work used a 2017.
strict text-matching algorithm to identify memes. Additional
follow-up work is needed to better understand and trace how [11] Hans-Rolf Gregorius and Elizabeth M Gillet. Gener-
these memes evolve and how the shape of a meme’s popularity alized simpson-diversity. Ecological Modelling, 211(1-
and evolution affects its lifespan and reach. 2):90–96, 2008.
8[12] Nathan Oken Hodas and Kristina Lerman. How visibil- [26] Robert R Schaller. Moore’s law: past, present and future.
ity and divided attention constrain social contagion. In IEEE spectrum, 34(6):52–59, 1997.
2012 International Conference on Privacy, Security, Risk
and Trust and 2012 International Confernece on Social [27] Carl Shapiro, Shapiro Carl, Hal R Varian, et al.
Computing, pages 249–257. IEEE, 2012. Information rules: a strategic guide to the network
economy. Harvard Business Press, 1998.
[13] Bernardo A Huberman, Daniel M Romero, and Fang Wu.
Crowdsourcing, attention and productivity. Journal of [28] Matthew P Simmons, Lada A Adamic, and Eytan Adar.
Information science, 35(6):758–765, 2009. Memes online: extracted, subtracted, injected, and recol-
lected. icwsm, 11:17–21, 2011.
[14] Brett Hutchins. The acceleration of media sport culture:
Twitter, telepresence and online messaging. Information, [29] Herbert A Simon. Designing organizations for an
communication & society, 14(2):237–257, 2011. information-rich world. Brookings Institute Lecture,
1969.
[15] Nina Kolleck. Social network analysis in innovation re-
search: using a mixed methods approach to analyze so- [30] Tiziana Terranova. Attention, economy and the brain.
cial innovations. European Journal of Futures Research, Culture Machine, 13, 2012.
1(1):25, 2013. [31] William Theisen, Joel Brogan, Pamela Bilo Thomas,
[16] Masao Kubo, Keitaro Naruse, Hiroshi Sato, and Takashi Daniel Moreira, Pascal Phoa, Tim Weninger, and Wal-
Matubara. The possibility of an epidemic meme ter Scheirer. Automatic discovery of political meme
analogy for web community population analysis. In genres with diverse appearances. arXiv preprint
International Conference on Intelligent Data Engineering arXiv:2001.06122, 2020.
and Automated Learning, pages 1073–1080. Springer,
[32] Pamela Bilo Thomas, Rachel Krohn, and Tim Weninger.
2007.
Dynamics of team library adoptions: an exploration
[17] Jure Leskovec, Lars Backstrom, and Jon Kleinberg. of github commit logs. In Proceedings of the 2019
Meme-tracking and the dynamics of the news cycle. In IEEE/ACM International Conference on Advances in
Proceedings of the 15th ACM SIGKDD international Social Networks Analysis and Mining, pages 470–473,
conference on Knowledge discovery and data mining, 2019.
pages 497–506, 2009.
[33] Lin Wang and Brendan C Wood. An epidemiological ap-
[18] Philipp Lorenz-Spreen, Bjarke Mørch Mønsted, Philipp proach to model the viral propagation of memes. Applied
Hövel, and Sune Lehmann. Accelerating dynamics of Mathematical Modelling, 35(11):5442–5447, 2011.
collective attention. Nature communications, 10(1):1–9,
[34] Lilian Weng, Alessandro Flammini, Alessandro Vespig-
2019.
nani, and Fillipo Menczer. Competition among memes in
[19] Robert H MacArthur. Patterns of species diversity. a world with limited attention. Scientific reports, 2:335,
Biological reviews, 40(4):510–533, 1965. 2012.
[20] Nahema Marchal. The polarizing potential of intergroup [35] Bradley E Wiggins and G Bret Bowers. Memes as genre:
affect in online political discussions: Evidence from red- A structurational analysis of the memescape. New Media
dit r/politics. Available at SSRN, 2020. & Society, 17(11):1886–1906, 2015.
[21] Elaine R Mardis. A decade’s perspective on dna sequenc- [36] Fang Wu and Bernardo A Huberman. Novelty and col-
ing technology. Nature, 470(7333):198–203, 2011. lective attention. Proceedings of the National Academy
of Sciences, 104(45):17599–17601, 2007.
[22] Asaf Nissenbaum and Limor Shifman. Internet memes as
contested cultural capital: The case of 4chan’s/b/board.
New Media & Society, 19(4):483–501, 2017.
[23] Wei Pan, Gourab Ghoshal, Coco Krumme, Manuel
Cebrian, and Alex Pentland. Urban characteristics
attributable to density-driven tie formation. Nature
communications, 4(1):1–7, 2013.
[24] Hartmut Rosa. Social acceleration: ethical and political
consequences of a desynchronized high–speed society.
Constellations, 10(1):3–33, 2003.
[25] Hartmut Rosa. Social acceleration: A new theory of
modernity. Columbia University Press, 2013.
9You can also read