Mandatory Helmet Use and the Severity of Motorcycle Accidents: No Brainer?
←
→
Page content transcription
If your browser does not render page correctly, please read the page content below
Mandatory Helmet Use and the Severity of Motorcycle Accidents:
 No Brainer?†

 Magdalena Blanco1, José María Cabrera2, Felipe Carozzi3, Alejandro Cid4

 Abstract

We study the impact of mandatory motorcycle helmet use laws on the severity and volume of road
accidents in Uruguay. Our empirical analysis exploits a change in the enforcement of the relevant law
in the department of Soriano which followed a reform in national legislation. Results from event-
study, differences-in-difference and synthetic control methods indicate a sharp increase in helmet use
and a 40 percent reduction in the incidence of serious or fatal motorcyclist accidents as a result of the
policy. We find no evidence of other behavioral responses in terms of either the volume or type of
accidents. We also show that additional costs of enforcement for the relevant government agencies
were negligible. Using costs of hospitalization and estimates of the value of statistical life, we estimate
the health benefits of the policy.

Key words: Law Enforcement; Safety and Accidents; Helmet Use

JLE: I12; I18; R41; H89

 This version: February 2020

†Acknowledgements
We would like to thank seminar participants at Universidad de Vigo and Banco Central del Uruguay, members
of the Board of UNASEV (Unidad Nacional de Seguridad Vial), and Sergio Urzúa for useful comments and
suggestions. We are very grateful to Mariana Leguisamo for outstanding research assistance. A previous draft
of this paper was circulated under the title “Effects of Motorcycle Helmet Laws on Fatalities’ Prevention: An
Impact Evaluation”.
1
 UM Center for Applied Research in Economics at Universidad de Montevideo – m.blanco@um.edu.uy
2
 UM Center for Applied Research in Economics at Universidad de Montevideo – jmcabrera@um.edu.uy
3
 Corresponding author. Department of Geography and Environment. London School of Economics.
Houghton Street WC2A 2AE, London, United Kingdom – f.carozzi@lse.ac.uk
4
 UM Center for Applied Research in Economics at Universidad de Montevideo – acid@um.edu.uy
1. Introduction

Road traffic accidents are the leading cause of death for children and young adults worldwide.

According to the World Health Organization, 1.35 million people die yearly as a result of these

accidents. For most countries, the associated costs have been estimated at roughly 3% of GDP (WHO,

2018). A disproportionate share of these costs is borne by inhabitants of low- and middle-income

countries. In an effort to curb the substantial human and material costs imposed by road traffic

accidents, countries have implemented a panoply of different regulations, from mandatory seat-belt

and helmet use laws to vehicle speed limits among many others. For several decades, economists

have studied the effectiveness of seat belt use laws in particular because these can in theory modify

actual and perceived risks of driver behavior, thus inducing potentially unexpected changes in

accidents that may render regulation ineffective or counter-productive. This is known as the Peltzman

hypothesis after this author showed evidence of increases in pedestrian accidents as a result of seat

belt regulation (Peltzman, 1975). While evidence in support of the Peltzman hypothesis has been

elusive in more recent studies of the consequences of seat belt use, examples of inadvertent

consequences of protection gear have been documented in other activities.5

 In this paper, we study the impact of a change in the enforcement of mandatory helmet use

regulation in Uruguay on the severity and volume of road accidents involving motorcyclists and

other road users. Mandatory helmet use laws for motorcyclists are common but not universal and

enforcement varies substantially between nations, with widespread enforcement issues in middle-

and low-income countries. The potential effects of helmet use on the perceived consequences of

speedy driving and other forms of risk taking are similar to those hypothesized in the case of seat

belts. Yet there is limited evidence in the economics literature on the direct and indirect impact of

enforcement on injury rates for motorcyclists. By using detailed administrative data on all reported

road accidents in Uruguay, we can estimate these effects and study the impact of enforcement on the

volume and type of accidents taking place, both for motorcycles, other vehicles and pedestrians.

 Our empirical strategy is based on quasi-experimental variation in enforcement induced by

changes in national laws in Uruguay. Mandatory helmet use was introduced in Uruguay in 2007 as

5
 For example, Chong and Restrepo (2017) study the effect of protective gear in Ice Hockey on player behavior.
Pope and Tollison (2010) find increased on-track accidents in NASCAR as a result of the introduction of new
safety regulations.

 1
part of the National Traffic Law, yet two departments – Uruguay is divided in 19 territorial

jurisdictions called departments – refused to enforce this regulation. This situation changed when the

Misdemeanors Act was passed by Parliament in 2013. As a consequence of this act, the department

of Soriano started to enforce helmet use for motorcycle drivers and passengers. This induced an

arguably exogenous change in enforcement that can be exploited for the purpose of our analysis.

 We document the effect of this change in enforcement on accident severity, type and volume

in the next two years after 2013. Our findings indicate a substantial reduction in severity of motorcycle

accidents, with a 5 to 7 percentage point reduction in serious and fatal accidents and a similar increase

in the fraction of accidents resulting in minor injuries. Contrary to what the Peltzman hypothesis

suggests, we find no effect on either accident volumes or the type of accidents taking place as a result

of the change in enforcement. Using our coefficients in combination with estimates of hospitalization

costs in the country and the value of statistical life, we can obtain an estimate of the health benefits

resulting from enforcement of the helmet use law. By comparing these with motorcycle registration

numbers, we also compute the nuisance cost of helmet use that would make helmet use indifferent

for motorcyclists.

 A small set of studies in economics have looked specifically at the effects of helmet use in

traffic accidents.6 Perhaps the closest to our work is Dee (2009), which provides estimates of the effect

of the introduction/removal of helmet use laws in US states on fatalities, using a panel specification.7

Total fatality effects are meant to incorporate both the direct effect of helmet use plus potential

compensating behavioral adjustments by drivers. Dickert-Conlin et al. (2011) find evidence of

increased availability of organ donations by deceased motorcyclists in US states that repeal

mandatory use laws. Carpenter and Stehr (2011) find evidence of reduced fatalities as a result of the

introduction of mandatory bicycle helmet use laws for the young. However, they also report a

substantial reduction in cycling. Chong and Restrepo (2017) report differences in behavior in ice

hockey players when using protective gear, finding behavioral responses consistent with the

Peltzman hypothesis.

6
 Studies in the fields of accident prevention and medicine have also looked at this question using a variety of
empirical methods. Some recent examples include Houston and Richardson (2008), Peng et al. (2017), Olsen et
al (2016) and Lee (2018).
7
 Dee (2009) also provides complementary results using a within-vehicle specification similar in spirit to the
analysis in Evans (1986).

 2
Our paper contributes to this literature by testing for both the effect of helmet use on injuries

and type of accidents in a context in which the reform is imposed centrally rather than locally, which

arguably avoids the potential endogenous choice of implementing a policy at the state level that

affects most US papers. Perhaps more importantly, we provide the first causal estimates of the effect

of helmet use on injury severity outside of the USA. This is particularly important given that

enforcement issues are especially acute in low and middle-income countries.

 Our paper also relates to previous studies in economics estimating the impacts of seat belt use

on health outcomes for drivers or non-drivers. Motivated by the work in Peltzman (1975), Loeb (1995)

uses time-series data for Texas to study the effect of seat-belt use laws on the fraction of accidents

resulting in serious injuries. Cohen and Einav (2003) and Carpenter and Stehr (2008) improve the

empirical strategy by exploiting a US state panel. They respectively study the impact of seat belt laws

on fatalities and injuries for vehicle occupants and non-occupants. While we also exploit longitudinal

variation by jurisdictions to estimate our effects of interest there are important differences relative to

these studies. Of course, we look at mandatory helmet use instead of seat belt use. In addition, the

use of administrative data on individual accidents allows us to investigate effects on the types of

accidents taking place. More importantly, we have information on injury type, which allows us to

document impacts on serious and minor injuries and changes in composition between them.

 Finally, our paper relates more broadly to the literature on policy solutions to the problem of road

traffic accidents. Van Benthem (2015) uses historical changes in speed limits in the United States to

obtain optimal limits, incorporating the impact of accidents as well as other factors (e.g. air pollution).

Hansen (2015) uses regression-discontinuity methods to study the impact of punishment for driving

under the influence on recidivism. In an exception relative to the largely US-centered literature, Aney

and Ho (2019) study the impact of the Chinese Road Traffic Safety Law on the volume of accidents,

fatalities and the severity of accidents. Our paper adds credible estimates of this change in policy to

the limited economics literature on policy solutions to traffic problems outside of the United States.

The context of our study is important because motorcycle deaths – as well as low rates of helmet use

– are particularly concentrated in developing countries.

 3
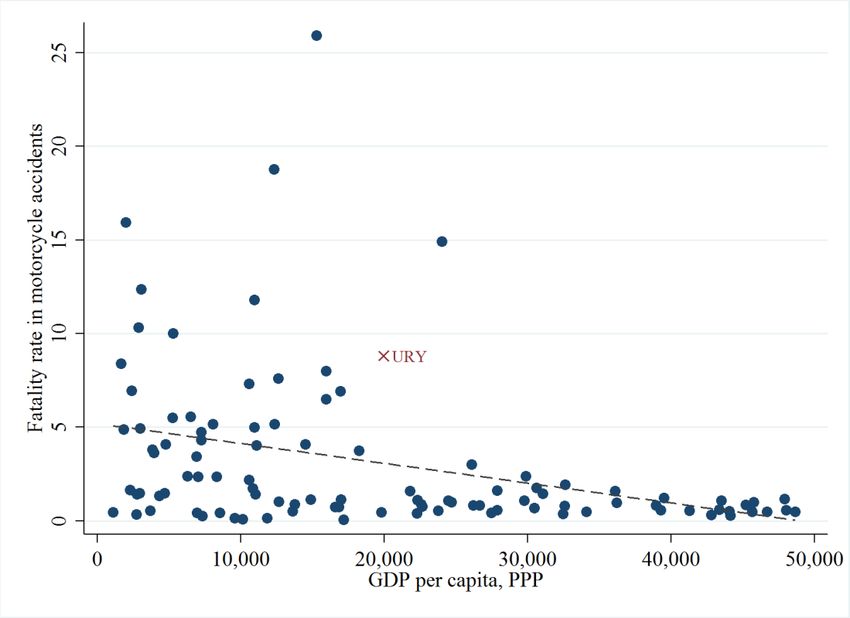
2. Background and Data

2.a. Road Accidents, Regulation and Enforcement

Road traffic accidents are the leading cause of death for children and young adults aged 5–29 years

worldwide. The burden of road traffic injuries and deaths is disproportionately borne by vulnerable

road users and those living in low- and middle-income countries, where the growing number of

deaths is fueled by increases in transport motorization. Between 2013 and 2016, all low-income

countries experienced an increase in the number of road traffic deaths (WHO, 2018). Despite the

heavy costs imposed by road accidents, many countries still lack funded strategies, lead agencies and

adequate enforcement of existing traffic regulation.

 Globally, those using motorized two-and three-wheelers – mainly motorcycle riders –

represent 28% of all traffic-related deaths. The heavy burden of deaths born by these road users is, at

least in part, a result of them being less physically protected than car occupants. This additional risk

for motorcycle users also affects the distribution of traffic-related deaths worldwide, as motorcycle

use is generally more prevalent in developing countries.8 Figure 1 shows a negative relationship

between fatalities in motorcycle accidents and GDP per capita.9 Our empirical analysis below focuses

on Uruguay, which shows one of the worst rates in motorcycle accidents relative to its income level.

 Tackling road safety problems in a context of increasing motorization is an important

challenge for many developing economies. Even if adequate regulations are in place, these may be

ineffective without the resources to ensure they can be successfully enforced. For example, in most

countries helmet use is formally mandatory for motorbike drivers and passengers. Yet these

regulations often co-exist with low use rates: Argentina, Bolivia, Iran, Peru and Uganda, all have

mandatory helmet use laws and yet in these countries over 30% of drivers, and roughly 60% of

passengers, do not wear helmets (WHO, 2018). The situation if often worse: in India and China,

helmets are used by 30% and 20% of drivers, respectively. Both countries have had mandatory helmet

laws for over a decade.

 That is not to say that mandatory helmet laws are universal. In the United States, many states

only require helmet use for young riders (e.g. under the age of 20). The states of Illinois, Iowa and

8
 According to the 2014 Spring Pew Global Attitudes Survey, motorcycle ownership rates are regularly above
50% in developing East Asian economies, but less than 30% in developed countries.
9
 Detailed information on p.c. GDP and motorbike fatality rates by country can be found in Appendix Table A1.

 4
New Hampshire do not require helmet use at all. In many of the countries that do have mandatory

helmet laws, these laws do not specify standards for these helmets.

 Figure 1 – Motorcycle Fatalities and Economic Development

Note: Dots correspond to countries with GDP per capita < 50.000. Vertical axis represents deaths of motorcyclists
per 100.000 people. GDP per capita measured in dollars of 2013, at purchasing power parity. Dashed line
corresponds to a linear regression estimated over the scatter plot. Sources: World Health Organization, World
Bank.

2.b. Helmet Use and Motorbike Accidents

When a motorcycle is involved in a collision, the rider is often thrown from the vehicle. In this event,

a motorcyclist that is wearing a helmet has a lower risk of suffering traumatic brain injuries. There

are typically three reasons for this. In the first place, the helmet cushions the impact and therefore

reduces the deceleration of the skull. In turn, this limits the speed of the impact between the brain

and the skull. Secondly, a helmet spreads the force of the impact over a greater surface area so that it

is not concentrated on a small area of the skull. Finally, helmets act as a mechanical barrier between

the head and the object.

 These three functions are met by combining the properties of four basic components of the

helmet: The shell is the strong outer surface that distributes the impact over a large surface area. The

impact-absorbing liner is the soft foam-and-cloth layer that sits next to the head. It helps keep the head

 5
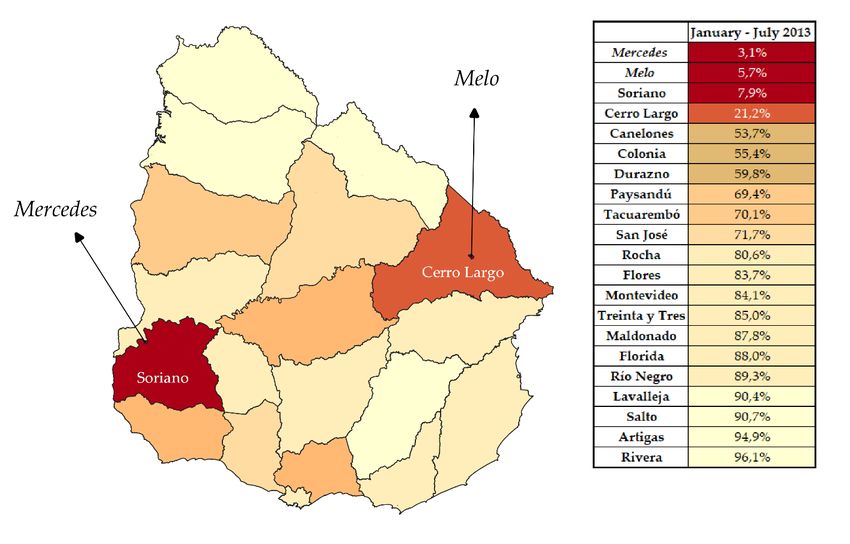
comfortable and the helmet fitting snugly. Finally, the retention system or chin strap is the mechanism

that keeps the helmet on the head in a crash.

 In the event of an accident, bikers who do not wear helmets generate additional

hospitalization costs by requiring greater number of medical and surgical interventions and longer

recovery times. The disability that often results from these head injuries leads to additional individual

and social costs (WHO, 2006).

2.c. Natural Experiment

On November 2007, the Uruguayan Parliament approved a new National Traffic Law – Law number

18.191 – which required mandatory helmet use for motorcyclists in all 19 departments of the

country.10 However, the departments of Soriano and Cerro Largo decided not to monitor the use of

helmets – effectively ignoring this aspect of the law – arguing that the Uruguayan Constitution

devolves transit control to the departmental jurisdiction.

 In the beginning of 2013 – where our sample period starts – both departments had

substantially lower rates of helmet use than other departments in the country. The percentage of

motorcycle accidents in which the biker was wearing a helmet was 7.9% and 21.2% for Soriano and

Cerro Largo, respectively. The average for other departments stood at roughly 75%. Moreover, the

usage of helmet by motorcyclists was particularly low in Mercedes (the capital city of Soriano) and

Melo (the capital city of Cerro Largo) – respectively, 3.1% and 5.7%. These cities have comparable

numbers of registered motorbikes and automobiles per capita, and similar helmet usage figures pre-

2013.11

 In August 2013, Parliament approved Law number 19.120 – the Misdemeanors Act – which

includes an article establishing a specific punishment for motorcyclists not using a helmet, consisting

of community work. The national police force is responsible for enforcing this law. Thus, Parliament

transferred the responsibility for monitoring helmet use from the municipal to the national level.

Since the Misdemeanors Act was approved, the Mayor of Soriano gradually let people know the

department would enforce mandatory helmet use. On November 1, 2013, the municipality of Soriano

10
 A map of Uruguayan departments including the percentage of helmet use can be found in Appendix Figure
A1.
11
 See Table A2 and Figure A1 in the Appendix.

 6
started monitoring motorcyclists, while the department of Cerro Largo remained steadfast in its

position and, to this date, does not require helmet use.

2.d. Data

We employ data drawn mainly from the UNASEV database.12 The database has detailed information

about accidents where police intervened, including the date, time and location of the accident. The

database includes information about the people involved in the accident, such as age, gender, role in

the accident – if the person was a passenger or a driver – consequence of the accident – death, serious

injury, minor injury or unharmed – and if the person wears helmet or seat belt if applicable. While

the report is filled by the police that intervened in the accident, the variable that explains the health

consequences of the accident is filled by medical service personnel. They are responsible for

identifying if the person is slightly or seriously injured, with the difference depending on whether

the person had one or more of their vital organs compromised. Deaths are registered to have

happened as a consequence of an accident if the fatality is either at the time of the accident or at the

medical center within 30 days of the accident taking place. In Uruguay during the period under

consideration – from 2013 to 2015 – 203,725 persons were involved in traffic accidents. Excluding

pedestrians, we have 175,759 observations in our database (Table A3 in the Appendix). Nearly 40

percent of those observations involved motorbikes, and 12 out of 100 people suffering motorbike

accidents ended seriously injured or dead, more than doubling the rate observed for other vehicles

(see Panel A of Table A3 in the Appendix). In Mercedes and Melo, 3,378 persons suffered motorbike

accidents in this period (see Panel B of Table A3).

 Finally, in addition to data on accidents we collect information on daily time of sunset , school

holidays and national holidays to account for time factors that could affect traffic volume and

accidents.

 In Table 1 we show the descriptive statistics for all reported motorbike accidents in this period,

splitting the sample by helmet usage. Wearing a helmet is associated with a significant reduction in

the probability of being seriously injured in motorcycle accidents. A rider wearing a helmet faces a

3.8 pp lower probability of being seriously injured or dead after a motorbike accident. These estimates

do not account for the potential endogeneity of helmet use. A motorcyclist makes several decisions

12
 National Division of Road Security (Unidad Nacional de Seguridad Vial).

 7
when riding her motorcycle: the speed, respecting traffic signs, whether or not she is going to drive

under the effects of alcohol or drugs, and if she will be wearing a helmet. Thus, helmet usage is an

(endogenous) choice variable. Riders who decide to use a helmet self-select themselves into the

treatment, so there can be observable and unobservable factors that confound the use of a helmet and

the severity of an accident. For example, Table 1 shows non-helmet riders are disproportionately

young, male, and riding at night. In the next sections of the paper we will try to estimate the causal

effect of using a helmet on the probability of serious injuries and fatalities.

 Table 1 – Descriptive Statistics: Motorbike Accidents by Helmet Use
 No helmet Helmet Mean
 Variables Mean SD Obs. Mean SD Obs. Differences
 Serious injury or death 0.14 (0.35) 16,863 0.10 (0.30) 52,043 0.038***

 Slight injury 0.60 (0.49) 16,863 0.69 (0.46) 52,043 -0.095***

 Unharmed 0.26 (0.44) 16,863 0.21 (0.40) 52,043 0.057***

 Male 0.75 (0.43) 16,789 0.68 (0.46) 51,922 0.063***

 Age 27.22 (13.76) 14,801 32.02 (14.15) 50,242 -4.806***

 At night 0.32 (0.47) 16,863 0.27 (0.44) 52,043 0.053***
 Notes: Data from UNASEV (Unidad Nacional de Seguridad Vial, Uruguay). Period: 2013-2015. * p
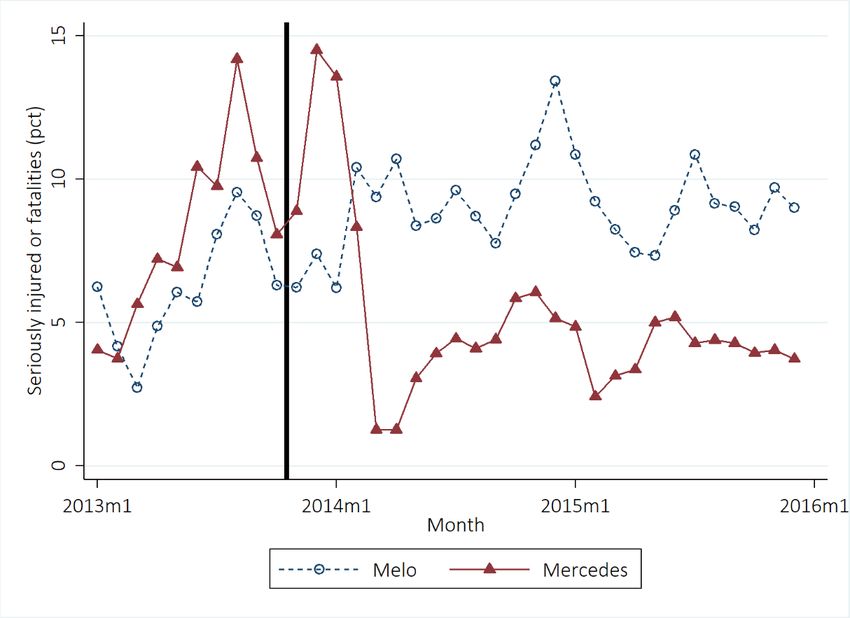
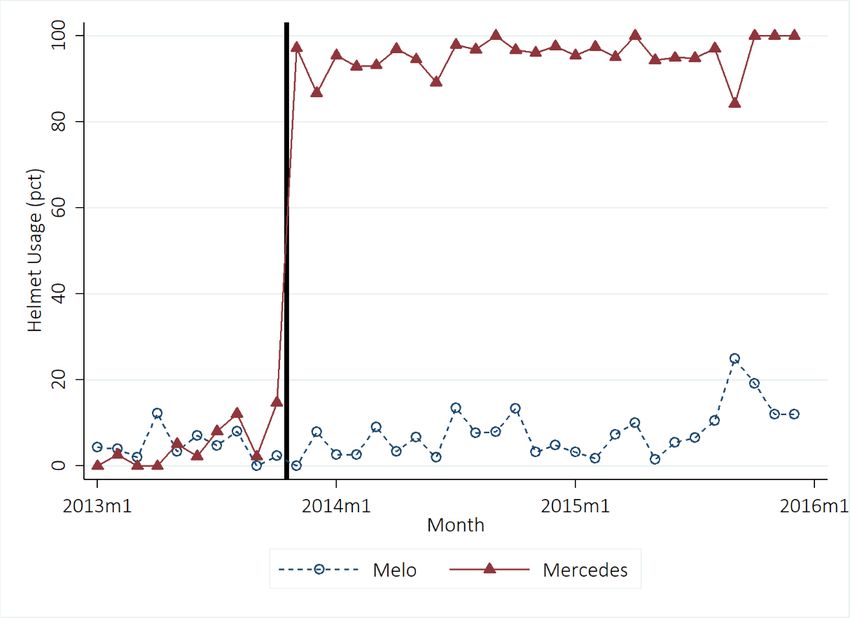
Mercedes and Melo. These towns constitute, respectively, the administrative capitals of the

departments of Soriano and Cerro Largo, both of which refused to enforce the mandatory helmet law

in 2007. Next, we use data on the universe of accidents in Uruguay in a specification with locality

fixed effects where localities in Soriano constitute the treatment area. Finally, we then use

department-level data to conduct an analysis of the differential evolution of serious injuries in

motorbike accidents in Soriano based on the synthetic control method (Abadie and Gardeazabal,

2003).

 Alongside the results of these analyses, we also report the impact of the change in enforcement

on the number and cause of accidents.

3.a. Event-Studies in Two Cities: Mercedes and Melo

In early 2013, Mercedes and Melo were the only department capitals in the country where municipal

traffic inspectors did not enforce the helmet use law. As discussed above, Mercedes started enforcing

that law in November 2013. To provide an initial illustration of the effects of the policy change, we

report two event-study graphs comparing helmet use and the severity of motorbike accidents for

Mercedes and Melo in Figures 2 and 3. Comparing both cities is especially relevant because motorbike

accidents are more common in urban environments, and most traffic inspectors operate in and

around urban areas.

 In Figure 2, we plot the evolution of the percentage of people involved in motorcycle accident

who was reportedly wearing a helmet in both cities. We use this variable as a proxy of helmet use. 13

The solid line corresponds to Mercedes, and the dashed line to the city of Melo. We observe initial

levels of helmet use are remarkably low in both cities, oscillating under 10%. In the figure, November

2013 is indicated with a vertical solid line. Precisely in this period, the rate of helmet use jumps to

almost 100% in Mercedes, while the figures for Melo remain very low. This difference is sustained

throughout the next two years. This indicates that the change in enforcement prompted a persistent

increase in helmet use in the city of Mercedes.

13
 Police reported helmet use rates may be more responsive to changes in enforcement than actual helmet use
if motorcyclists are classified as wearing a helmet when they were not. This means that we will may overstate
changes in helmet use as a result of the policy, but understate the effects of helmet use on serious accidents.

 9
Figure 2: Helmet Use in Mercedes and Melo

Note: Helmet usage measured as the percentage of all motorbike accidents where the driver was wearing a
helmet. Vertical line corresponds to November 2013. Source: own calculations based on data from UNASEV
(Unidad Nacional de Seguridad Vial, Uruguay). Period: 2013-2015.

 The evolution of the fraction of motorcyclists involved in accidents that experience serious or

fatal injuries for both cities is reported in Figure 3. We report 3-months moving averages to smooth

out some of the short run fluctuations. We can observe that - before the change in enforcement – the

fraction of serious accidents for both cities evolve in parallel with an upward trend, with the level

being consistently higher in Mercedes. In the months before November 2013, the fraction of motorbike

accidents resulting in serious injury for this city oscillated around 10%. Five months after the policy

was introduced, serious injuries only occurred in 2% of motorbike accidents. Between late 2014 and

2015, the figure would recover to a level of around 4%. In this period, the rate of serious injury in

Melo was twice as large as the one for Mercedes. The fact that this divergence broadly coincides with

the change in policy indicates that the increase in enforcement resulted in reduced injuries for bikers.

 10
Figure 3: Serious Injuries and Fatalities in Mercedes and Melo

Note: Seriously injured or fatalities is defined as a percentage over the number of motorcyclist accidents in each
city. The series were smoothed with three months moving averages. Vertical line corresponds to November
2013. Source: own calculations based on data from UNASEV (Unidad Nacional de Seguridad Vial, Uruguay).
Period: 2013-2015.

 An interesting feature in Figure 3 is that the decline in serious accidents in Mercedes does not

occur immediately but takes roughly 5 months after the change in enforcement. In the first three

months after the introduction, there is an increase in the ratio of serious injuries. Given the changes

reported in Figure 2, we know this transition is not induced by a slow and progressive change in

helmet use. One plausible explanation is that bikers took some months to adapt to the limited visual

and auditory acuity resulting from the use of a suitable helmet. In that adaptation period, serious

accident rates could even exhibit a short-term increase.

 We can use our individual-level dataset and exploit the variation reported in Figures 2 and 3

to obtain quantitative estimates of the effect of enforcement on helmet use and the incidence of serious

injuries. For this purpose, we estimate:

 = + ( · ) + 1 + 2 + + ′ + (1)

The outcome variable be either a dummy taking value 1 if the individual involved in an accident

in month was wearing a helmet, or a dummy taking value 1 if the individual suffered major or fatal

 11
injuries as a result of the accident. Variable takes value 1 if an accident took place in the

city of Mercedes (as opposed to Melo), and takes value 1 after November 2013. Variables and

 corresponds to date or driver level controls, respectively. In we include dummies for public

holidays, day of the week, hour of the day, month of the year and year effects. In we include age

and gender of the driver.

 Table 2: Motorbike Accidents in Mercedes and Melo

 (1) (2) (3)
 Panel A Use of helmet
 Mercedes x Post 0.871*** 0.869*** 0.867***
 (0.019) (0.019) (0.020)

 Observations 3,354 3,354 3,175
 R-squared 0.764 0.769 0.768

 Panel B Serious injuries and fatalities
 Mercedes x Post -0.070*** -0.072*** -0.068***
 (0.022) (0.022) (0.023)

 Observations 3,378 3,378 3,198
 R-squared 0.006 0.025 0.032

 Gen. Contr. No Yes Yes
 Driv. Contr. No No Yes
Note: The variable Mercedes x Post is a dummy that takes the value 1 when the accident took place in Mercedes
after November 1st, 2013. All regressions include a dummy for Mercedes, a dummy for Post November 1st 2013
and a constant. General controls include a dummy for school and public holidays; a full set of day-of-week-
specific fixed effects, hour-of-day fixed effects, month-of-year fixed effects and year fixed effects. Driver controls
include dummies on gender and age of the driver. Data period: 2013-2015. Robust standard errors in
parentheses. *p
3.b. Difference-in-Difference Estimates

We now move beyond the narrow analysis of Mercedes and Melo and use our data for the universe

of road accidents in Uruguay to study changes in helmet use and serious accidents in Soriano. For

this purpose we estimate the following specifications:

 = + + · · + 1 · + 2 · + 3 · + (2)

 = + + · + (3)

As above, the outcome variable in both equations can be either a dummy for individuals wearing

a helmet, or a dummy taking value 1 for individuals suffering major or fatal injuries as a result of the

accident. Parameters and , correspond to locality and month-year effects, respectively. Variable

 corresponds to a dummy taking value 1 if the individual involved in an accident in month

was riding a motorbike.14 Finally, takes value 1 if the accident took place in one of the localities in

Soriano – our treatment area – and takes value 1 in all periods after November 1st 2013. In the

case of model (2), we use a triple interaction term to identify the effect of the enforcement policy on

our outcome by simultaneously comparing the before and after change in this outcome for bikers in

Soriano with the corresponding change for other vehicles, and the change for bikers in the rest of the

country. Model (3) is estimated on our subsample of bikers and is a standard differences-in

differences specifications where the and variables have been replaced with time dummies

and locality fixed effects. In the case of this model, the assumption required to estimate parameter

is the usual assumption of parallel trends in the absence of treatment.

 In addition to estimating equations 2 and 3 directly, we can use them as first stages in a two

stage least squares specification to estimate the effect of helmet use on serious injuries. The first stage

will have the helmet dummy as the outcome, and the second stage outcome will be our serious injury

dummy.

 Estimates from these specifications are reported in Table 3. Columns 1 and 2 correspond to

equation (2) and columns 3 and 4 correspond to equation (3). Columns 1 and 3 omit locality fixed

effects, which are included in columns 2 and 4. In panel A, the outcome variable is our helmet use

14
 This variable takes value 0 for individuals who were either riding a motorbike without helmet, or riding a
vehicle that does not require helmet use (e.g. cars). Vehicles included in our accidents database are cars (48.9%),
motorbikes (39.8%), trucks (3.4%), buses (3.1%), bicycles (2.4%), carts (0.13%), and other vehicles (2.4%).

 13
dummy. We observe consistent positive estimates for of roughly 0.9 across specifications. This is in

line with the results illustrated in Figure 2, indicating helmet use in Soriano went from close to zero

to almost full compliance in a few months. Panel B provides reduced-form results for the effect of the

enforcement of the mandatory helmet law on serious accidents. We find a negative and significant

effect of roughly -0.05, which is interpreted as showing that the probability that a motorbike accident

results in a serious injury was reduced by 5 percentage points as a result of the policy. This effect is

large, as the baseline probability of having a serious or fatal injury for bikers is 11.3%. Note that the

effect is slightly smaller to the one reported when comparing Mercedes and Melo, presumably

because the probability of serious injury is higher in cities.

 Panel C of Table 3 shows our IV estimates of the causal effect of helmet use. Note that these

coincide with the ratio between the reduced-form coefficients in panel B over the first-stage estimates

in panel A. The effects of interest oscillate around 5%, indicating that helmet use reduces the

probability that a motorbike accident results in a serious or fatal injury by roughly 40 percent. Note

that this estimated effect is slightly larger than the difference in probability of serious injury obtained

from the mean comparison in Table 1. This suggests that helmet use is negatively correlated with

other dimensions of risk-taking behavior in the road.

 The reduction in the prevalence of serious injuries as a result of motorbike accidents can

operate through either a change in the type of accidents bikers are involved in, or a change in accident

severity conditional on accident type. If helmet use is behind the reduction in serious or fatal injuries,

we expect a positive effect on minor injuries as a result of the change in enforcement. Accidents that

would have resulted in a serious injury if a helmet was not used may result in a minor injury instead.

To explore this, we reproduce the previous analyses using an indicator taking value 1 if an accident

results in minor injuries as the dependent variable. Results are reported in Table 4. In panel A, we

estimate model 1 using data for Mercedes and Melo only. We find a substantial increase of roughly 8

percentage points in the probability that motorbike accidents result in minor injuries in the city of

Mercedes after the helmet law was enforced. In panel B, we obtain IV estimates of the effect of helmet

use on the probability of having minor injuries using data for all locations in the country. We find

positive and significant effects of helmet use on minor injuries, again pointing to a transfer of serious

to minor injuries as a result of the change in enforcement.

 14
Table 3: Differences-in-Differences Estimates for all Locations

 (1) (2) (3) (4)
 A) First-Stage Helmet D. Helmet D. Helmet D. Helmet D.

 Post x Treatm. x Moto 0.885*** 0.887***
 (0.0290) (0.0270)
 Post x Treatm. 0.904*** 0.887***
 (0.0297) (0.0366)
 B) Reduced-Form Serious D. Serious D. Serious D. Serious D.

 Post x Treatm. x Moto -0.0490*** -0.0479***
 (0.00932) (0.0116)
 Post x Treatm. -0.0450*** -0.0468***
 (0.0123) (0.0111)
 C) TSLS Estimates (IV) Serious D. Serious D. Serious D. Serious D.

 Helmet D. -0.0553*** -0.0541*** -0.0498*** -0.0528***
 (0.00954) (0.0122) (0.0123) (0.0109)

 Observations 174,696 174,696 68,906 68,906
 Vehicle All All Motorbike Motorbike
 Town FE No Yes No Yes
Note: Columns 1 and 2 estimated with the full sample of accidents in the UNASEV dataset (excluding pedestrian
accidents). Columns 3 and 4 estimated using the sub-sample of motorcycle accidents. In Panel A, the dependent
variable is a dummy taking value 1 if the victim of the accident was reportedly wearing a helmet at the time of
the accident. In Panels B and C, the dependent variable is a dummy taking value 1 if the accident victim
experienced a serious or fatal injury. Panel C reports instrumented variable estimates of the effect of helmet use
on serious accidents as discussed in the text. Columns 2 and 4 include locality fixed effects. Standard errors
clustered at the locality level. *p
(e.g. from a motorbike) or other causes. We find no statistically significant effect of increased

enforcement on the type of accidents taking place.15

 Table 4: Minor Injuries and Helmet Use

 Panel A: Mercedes and Melo (1) (2) (3)
 Minor D. Minor D. Minor D.

 Mercedes x Post 0.118*** 0.0829** 0.0806**
 (0.0396) (0.0376) (0.0381)

 Observations 3,354 3,354 3,175
 R-squared 0.009 0.017 0.037
 Gen. Contr. No Yes Yes
 Driv.Contr. No No Yes
 Panel B: All Localities (2SLS) Minor D. Minor D. Minor D.

 Helmet D. 0.0232 0.0630*** 0.0840***
 (0.0294) (0.0222) (0.0100)

 Observations 174,696 68,906 68,906
 Vehicle All Motorbike Motorbike
 Town FE Yes No Yes
Note: Panel A coefficients estimated with the sample of all reported motorcycle accidents in Mercedes and Melo.
Panel B estimated using all accidents in column 1, and all motorcycle accidents in columns 2 and 3. The
dependent variable in all specifications is a dummy taking value 1 if the accident resulted in a minor injury. In
panel A we include driver level controls and an additional set of dummies to account for school holidays and
day-of-the-week effects. Columns 1 and 3 of Panel B include locality fixed effects. Standard errors clustered at
the locality level in parentheses. *p
Table 5: Number and Type of Accidents in all Locations

 (1) (2) (3)
 A) Accidents by Total Accidents Moto. Accidents Other Vehicles
 Vehicle

 Post x Treatm. -0.539 -0.157 -0.382
 (1.360) (0.487) (0.927)

 Observations 16,776 16,776 16,776
 B) Accidents by Cause Collision Falling (e.g. Other
 from Motorbike)

 Post x Treatm. -0.0657 0.0610 0.00473
 (0.0749) (0.0691) (0.0527)

 Observations 6,002 6,002 6,002
Note: Panel A estimates obtained from a month-locality panel including locality fixed effects. In column 1, the
dependent variable is the total number of people involved in traffic accidents in a locality-month pair. In column
2, the dependent variable is the total number of people involved in motorcycle accidents and in column 3 the
number of people involved in accidents for other vehicles. Panel B estimates obtained from a month-locality
panel including localities with at least one accident in a month-locality pair. The dependent variable is the
fraction of motorcycle accidents arising from collisions, falling (e.g. from the motorcycle), and other causes. All
specifications include locality fixed effects and year-month effects. Standard errors clustered at the locality level
in parentheses. *p
rates in the loss function include the outcome in the first quarter of 2013, the number of motorbikes

per capita, the share of rural population, the natural logarithm of population and average household

income. We then use the algorithm described in Abadie and Gardeazabal (2003) to select the cross-

sectional weights. The resulting weights take non-zero values for the departments of Artigas (0.448)

and Río Negro (0.552).

 We construct the accumulated difference in serious accidents between the department of

Soriano and our synthetic Soriano control. This is represented as the black solid line in Figure 4. We

observe that in the months before November 2013, the line is flat. Note that only the first quarter is

used to select the synthetic control, so the fact that there is no observable trend in the two subsequent

pre-policy periods indicates no substantial change between treatment and control departments before

the enforcement of the mandatory helmet law in Soriano. Starting in the last quarter of 2013, we

observe a progressive change in the accumulated number of serious accidents per capita. The line

continues to diverge downward over time. While this method does not yield suitable standard errors

for a conventional hypothesis test, we follow the synthetic control literature and use a permutation

method to gain insights into whether this diverging trend could occur by accident. For this purpose,

we construct a synthetic control for each of the other departments in our sample and calculate the

accumulated difference in serious motorbike accidents per capita in each case. These are plotted in

Figure 4 as solid grey lines.17 We can observe that, while some of these lines diverge significantly from

a flat path, none of them veers as far from this path as the solid black line for Soriano. This indicates

that Soriano is an outlier in the trend of accumulated serious motorbike accidents per capita relative

to all other departments. We interpret this as resulting from the enforcement of the mandatory helmet

law in Soriano from November 2013.

17
 Note that the department of Soriano is not included as a potential control unit in this exercise.

 18
Figure 4 – Synthetic Control: Accumulated Serious Accidents p.c.

 Note: Solid line represents accumulated difference in the per capita number of motorbike accidents
 resulting in serious injuries between the department of Soriano and a synthetic Soriano control
 constructed using the method detailed in the text. Grey lines represent the accumulated difference
 between observed numbers and synthetic controls for other departments.

 We can also use the synthetic control method to determine whether the change in enforcement

resulted in a change in accident volumes after 2013. For this purpose we modify the analysis above

and build a synthetic department in order to match the number of motorbike accidents per capita

before the policy was put in place in Soriano. Results from this exercise are reported in Figure A2 in

the Appendix. The solid line represents the evolution of the accumulated difference in the number of

accidents per capita between Soriano and the synthetic control. The grey lines represent the same

figures for other departments. We observe that the accumulated difference for Soriano is fairly flat

and does not stand out relative to those from other departments. This confirms the notion – already

expressed in Table 5 – that increase enforcement had no discernible effect on the number of motorbike

accidents.

4. Discussion and Conclusions

4.a. Valuation of the Change in Enforcement of the Mandatory Helmet Use Law

 We can use our estimates and additional information on health and administrative costs to

outline a cost-benefit analysis of helmet use laws for Uruguay. The main benefits of the policy arise

 19
from the reduction in serious injuries and fatalities from motorcycle accidents. The main costs relate

to: i) the administrative costs of enforcement paid by the relevant agencies and, ii) the nuisance costs

of wearing a helmet for motorcyclists. The latter is particularly hard to estimate, but we can calculate

which could be the magnitude of the costs that would be required to reverse the change in benefits.18

The outcome of the cost-benefit analysis can then be obtained relative to this benchmark.

 Health benefits resulting from the change in enforcement can be due to a reduction in the

volume of serious accidents, and a reduction in the volumes of deaths. Paolillo et al. (2016) documents

that roughly 1.5 out of 10 serious traffic accidents lead to a fatality. The same source estimates average

intensive care hospitalization costs for serious traffic accidents in Uruguay to be USD 7,437. A quite

conservative estimate for the value of a statistical life is USD 540,000 dollars.19 Health benefits can be

obtained by multiplying these figures times an estimate of the absolute reduction in serious injuries .

The coefficient on the reduced-form effect of the policy on serious accidents in column 4 of Table 3 is

4.7%. The average number of yearly motorcycle accidents in Soriano is 610. Hence, the policy leads

to a reduction of roughly 29 serious or fatal accidents per year. Using this number, we can compute

estimated health benefits from the policy as 29 × 0.15 × 540,000 + 29 × 0.85 × 7,437. This yields a

figure of USD 2,532,322 per year in benefits arising from reduced hospitalization costs and deaths

only. Assuming a 5% discount rate and a 30 year time horizon (as in Dee 2009), the present value of

health benefits would be in the order of USD 41 million. This corresponds to USD 495 per capita.

 It is worth noting that other health effects, such as psychological costs and permanent

disability resulting from serious accidents, or reduced work hours for hospitalized patients, are likely

to be substantial. Therefore, we consider these figures to be an underestimate of total health benefits.20

18
 Standard revealed-preference valuation tools, such as the opportunity cost or compensating differential
methods, cannot be applied to measure nuisance costs because there are no other markets compensating for
these costs, or pricing a similar bad. Contingent valuation methods may be more successful in yielding a useful
cost estimate, yet these are unavailable in our context.
19
 In the case of US, Dee (2009) employs a value of statistical life of 2 million dollars. Considering that Uruguayan
GDP per capita is 27 percent of the US GDP per capita, we employ a conservative value of 540,000 dollars for
our estimates.
20
 As discussed in section 3, the reduction in serious and fatal injuries comes at the expense of an increase in
minor injuries. Minor injuries will impose costs of their own, although by definition they will not require
hospitalization. These unaccounted costs are arguably higher for serious accidents, and so our estimate of net
health benefits would still be a lower bound of total health costs, even after accounting for the increased number
of minor injuries.

 20
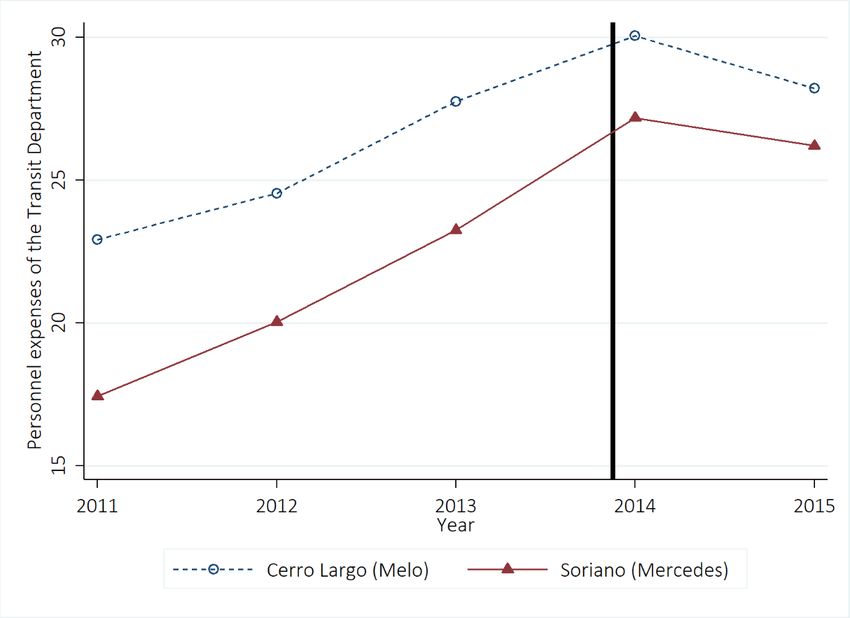
Figure 5: Personnel expense of the Municipal Transit Department

Note: Personnel expenses of the transit departments expressed in millions of 2015 Uruguayan pesos. Lines
correspond to the evolution of expenses over time for Soriano (triangles) and Cerro Largo (circles). Vertical line
corresponds to November 2013. Source: Observatorio Territorio Uruguay (OPP).

 Public enforcement of the helmet law requires the use of traffic inspectors to detect and to

sanction violators. How much of Soriano’s public resources were devoted to these tasks? Figure 5

reports personnel expenses of the Transit Department of the Municipality of Soriano and Cerro Largo.

The parallel trends observed before the enforcement of the law do not change after it. In other words,

Soriano achieved an abrupt increase in the compliance with the helmet law after 2013 without an

escalation in personnel costs. Officials at the Soriano transit authority stated that enforcement of the

law did not involve the deployment of additional human resources. Inspectors were already

deployed within the city of Mercedes in order to enforce other transit rules (speed limits, traffic lights,

etc.) and, after the law was enforced, the same inspectors just added another complementary task –

the enforcement of the helmet law- to their daily activity. Information campaigns on helmet use were

included on traffic safety campaigns already in place before the policy change. Hence, it is not

surprising that we do not identify a significant administrative cost of enforcement in this case.

There were 26,435 registered motorcycles in Soriano in 2013. Nuisance costs of helmet for registered

motorcycles resulting from the policy will be equal to this figure scaled by the change in helmet use,

which is 89% (see panel A of Table 3). Our health benefits estimate is USD 2,532,322 per year. So, for

 21
yearly nuisance costs per registered motorcycle under USD 108, the policy would have a positive net

benefit. Because our estimate of health benefits is probably downward biased, this is a lower bound

for break-even nuisance costs per motorcyclist.

Given this discussion, low levels of helmet use in the absence of appropriate enforcement during 2013

can be explained on three grounds: large nuisance costs, moral hazard or biased perception of risks.

First, if nuisance costs of wearing a helmet – plus pecuniary costs of owning one – are well above

USD 108 a year, then the laissez-fair outcome is that rational cyclists will choose not to wear a helmet.

Second, cyclists may not internalize the full costs of serious injuries because of the pervasiveness of

health and disability insurance. If this is the case, even if costs of helmet use are below USD 108 per

year, it may still be optimal for drivers to not use a helmet. Finally, it is not obvious that motorcyclists

have an accurate perception of the risks of driving without a helmet. The same outcome of low helmet

use without enforcement would be observed if motorcyclists’ subjective probabilities of serious

accidents are lower than actual probabilities.

4.b. Conclusions

Mandatory helmet use laws for motorcyclists are a feature of transit regulation in many jurisdictions.

Yet these are not universal and enforcement can often be extremely poor, particularly in low- and

middle-income countries. This paper shows that changes in enforcement can lead to a substantial

alleviation of the deleterious health consequences of motorcycle accidents. Our difference-in-

differences estimates indicate that changes in the enforcement of helmet use laws in Uruguay lead to

a substantial reduction of roughly 5 percentage points in the rate of serious or fatal injuries. Given

the national base rate stands at roughly 12 percent for this period, this effect is sizeable. The reduction

in serious accidents takes place at the expense of an increase of minor injuries, pointing squarely to a

net reduction in accident severity. Accident numbers and the type of accidents taking place – both for

motorcycles and other vehicles – do not appear to be affected by the change in policy. This further

alleviates concerns that behavioral responses to helmet use – such as increased driving speeds or

more reckless conduct by motorcyclists – counter the direct effect of using a helmet to prevent head

trauma.

 Combining our reduced-form estimates of changes in accident severity with costs of

hospitalization and the value of statistical life, we calculate an approximate measure of the health

benefits resulting from the change in enforcement. Given that direct enforcement costs by the

 22
involved traffic control agencies were unaffected by the policy, the main costs of increased helmet

use are associated to the nuisance these implements may generate for drivers. Substantial nuisance

costs would be necessary to compensate for the policy’s health benefits.

 23
References

Aney, M. S., & Ho, C. (2019). Deadlier road accidents? Traffic safety regulations and heterogeneous
 motorists’ behaviour. Regional Science and Urban Economics, 77, 155-171.
Abadie, A., & Gardeazabal, J. (2003). The economic costs of conflict: A case study of the Basque
 Country. American economic review, 93(1), 113-132.
Abadie, A., Diamond, A., & Hainmueller, J. (2010). Synthetic control methods for comparative case
 studies: Estimating the effect of California’s tobacco control program. Journal of the American
 Statistical Association, 105(490), 493-505.
Carpenter, C. S., & Stehr, M. (2008). The effects of mandatory seatbelt laws on seatbelt use, motor
 vehicle fatalities, and crash-related injuries among youths. Journal of Health Economics, 27(3),
 642-662.
Carpenter, C. S., & Stehr, M. (2011). Intended and Unintended Consequences of Youth Bicycle Helmet
 Laws. Journal of Law & Economics, 54(2), 305-324.
Chong, A., & Restrepo, P. (2017). Regulatory protective measures and risky behavior: evidence from
 ice hockey. Journal of Public Economics, 151, 1-11.
Cohen, A., & Einav, L. (2003). The effects of mandatory seat belt laws on driving behavior and traffic
 fatalities. Review of Economics and Statistics, 85(4), 828-843.
Dickert-Conlin, S., Elder, T., & Moore, B. (2011). Donorcycles: Motorcycle helmet laws and the supply
 of organ donors. The Journal of Law and Economics, 54(4), 907-935.
Dee, T. S. (2009). Motorcycle helmets and traffic safety. Journal of Health Economics, 28(2), 398-412.
Hansen, B. (2015). Punishment and deterrence: Evidence from drunk driving. American Economic
 Review, 105(4), 1581-1617.
Homer, J.F., & French, M.T. (2009). Motorcycle helmet laws in the U.S. from 1990 to 2005: Politics and
 public health. American Journal of Public Health, 99(3), 415–423.
Houston, D.J., & Richardson, L.E (2008). Motorcyclist fatality rates and mandatory helmet-use laws.
 Accident Analysis and Prevention, 40, 200–208.
Lee, J. M. (2018). Mandatory helmet legislation as a policy tool for reducing motorcycle fatalities:
 Pinpointing the efficacy of universal helmet laws. Accident Analysis & Prevention, 111, 173-183.
Loeb, P. D. (1995). The effectiveness of seat-belt legislation in reducing injury rates in Texas. American
 Economic Review, 85(2), 81-84.
Olsen, C. S., Thomas, A. M., Singleton, M., Gaichas, A. M., Smith, T. J., Smith, G. A., ... & Cook, L. J.
 (2016). Motorcycle helmet effectiveness in reducing head, face and brain injuries by state and
 helmet law. Injury epidemiology, 3(1), 8.
Paolillo, D. E., Scasso, A., Torres, F., Barrios, G., Tortorella, C. S., & Tort, P. (2016) Siniestros de
 tránsito, los Grupos Relacionados por el Diagnóstico y los costos hospitalarios. Revista Médica
 Uruguaya, 32(1), 41-50.
Peltzman, S. (1975). The effects of automobile safety regulation. Journal of Political Economy, 83(4), 677-
 725.

 24
Peng, Y., Vaidya, N., Finnie, R., Reynolds, J., Dumitru, C., Njie, G., ... & Sleet, D. A. (2017). Universal
 motorcycle helmet laws to reduce injuries: a community guide systematic review. American
 journal of preventive medicine, 52(6), 820-832.
Pope, A. T., & Tollison, R. D. (2010). “Rubbin’ Is Racin''': evidence of the Peltzman effect from
 NASCAR. Public Choice, 142(3-4), 507-513.
van Benthem, A. (2015). What is the optimal speed limit on freeways? Journal of Public Economics, 124,
 44–62.
WHO (2006). Helmets: A road safety manual for decision-makers and practitioners. Geneva, World Health
 Organization.
WHO (2018). Global status report on road safety 2018. World Health Organization.

 25
Appendix

 Figure A1 – Helmet Use by Department (Uruguay)

Note: Polygons representing the 19 departments of Uruguay. Shades correspond to helmet use as measured by
the fraction of motorbike accidents where the riders were wearing a helmet. The table also includes data for
Mercedes (the capital city of Soriano) and Melo (the capital city of Cerro Largo).

 Figure A2 – Synthetic Control: Accumulated Number of Motorbike Accidents p.c.

Note: Solid line represents accumulated difference in the number of motorbike accidents per capita between the
department of Soriano and a synthetic Soriano control constructed using the method detailed in the text. Gray
lines represent the accumulated difference between observed numbers and synthetic controls for other
departments.

 26
Table A1– Fatality rate in motorcycle accidents and GDP per capita.

Note: Data sources: Fatalities rate in motorcycle accidents, from World Health Organization. GDP per capita, at
purchasing power parity, from World Bank.

 27
Table A2 – Descriptive Statistics for Mercedes and Melo

 Mercedes Melo

 Total population 41,974 51,830

 Total number of motorcycle or moped 12,420 12.828

 Total number of automobile or van 4,900 6,130

 Number of motorcycle or moped per capita 0.296 0.248

 Number of automobile or van per capita 0.117 0.118
Note: Own calculations based on Uruguayan National Census 2011. Uruguay is divided in 19 departments.
Mercedes is the capital of Soriano Department, and Melo is the capital of Cerro Largo Department. Both cities
show similar ratios of motorcycles and automobiles.

 28
Table A3 – Descriptive Statistics for Accident Database

 Panel A - All localities
 All vehicles Motorbikes
 Variables Mean SD Obs. Mean SD Obs.
 Serious injury or death 0.06 (0.25) 175,759 0.12 (0.33) 69,969

 Slight injury 0.38 (0.49) 175,759 0.66 (0.47) 69,969

 Unharmed 0.56 (0.50) 175,759 0.22 (0.41) 69,969

 Male 0.74 (0.44) 175,198 0.70 (0.46) 69,774

 Age 37.05 (16.19) 166,139 31.01 (14.26) 66,073

 At night 0.26 (0.44) 175,198 0.28 (0.45) 69,969

 Panel B - Mercedes and Melo
 All vehicles Motorbikes
 Variables Mean SD Obs. Mean SD Obs.
 Serious injury or death 0.04 (0.20) 6,183 0.07 (0.26) 3,378

 Slight injury 0.38 (0.48) 6,183 0.62 (0.49) 3,378

 Unharmed 0.58 (0.49) 6,183 0.31 (0.46) 3,378

 Male 0.67 (0.47) 6,160 0.60 (0.49) 3,363

 Age 35.33 (17.14) 5,836 29.66 (15.42) 3,189

 At night 0.26 (0.44) 6,183 0.28 (0.45) 3,378
Note: Own calculations based on UNASEV (Unidad Nacional de Seguridad Vial, Uruguay). Medical service
personnel are responsible for identifying if the person is slightly or seriously injured, with the difference
depending on whether the person has one or more of their vital organs compromised. Deaths are registered to
have happened as a consequence of an accident if the fatality is either at the time of the accident or at the medical
center within 30 days of the accident taking place. “At night” is a dummy variable that takes the value “1” if
the accident occurred at night. “Male” and “Age” refer to the person that suffered the accident. Data: period
2013-2015.

 29
You can also read