MARYLAND HIGHWAY STRATEGIC - Zero Deaths Maryland
←
→
Page content transcription
If your browser does not render page correctly, please read the page content below

MARYLAND
             STRATEGIC
             HIGHWAY
             SAFETY PLAN
                  2016-2020

April 2017
Letter from the Transportation Secretary

S
     afety is the foundation of every single project and initiative we deliver for the
     citizens of Maryland. Our mission, Toward Zero Deaths, is our ultimate traffic safety
     goal. We continue to make significant strides to save lives on our roadways. In 2014,
Maryland reduced the number of traffic fatalities to 443, which is the lowest number
since 1948. This historically low number clearly demonstrates what we can do when
we work together to improve traffic safety and save lives. We believe the development
and implementation of the Maryland Strategic Highway Safety Plan (SHSP) continues to
contribute to this reduction in fatalities and serious injuries.

This 2016 – 2020 SHSP continues the legacy of previous safety action plans with a detailed
framework for the next chapter of transportation safety in Maryland. We are focused
on performance measures and effective strategies to achieve long-term goals. The
2016 – 2020 SHSP was designed to move Maryland closer to cutting roadway fatalities in
half by 2030 and eventually ending traffic fatalities and serious injuries on our roadways.

Achieving these goals will require a sustained and steadfast commitment from State
and local agencies and key safety partners. SHSP stakeholders are crucial to improving
roadway safety in Maryland through implementing the strategies and action steps
related to the “Four Es of Safety” (Engineering, Enforcement, Education, and Emergency
Medical Services). In addition, developing new partnerships will be a vital part of our
continued success in emerging roadway safety areas, including vehicle connective
technologies and traffic safety culture.

The Maryland SHSP Executive Council wishes to thank the Maryland Department of
Transportation’s Highway Safety Office (MHSO) and SHSP Emphasis Area Teams for
their support and guidance in developing the 2016 – 2020 SHSP. Their tireless work
in developing meaningful and actionable safety strategies will enable successful
implementation during the next five years and beyond.

We invite you to join us to make a difference in the lives of citizens and visitors to Maryland
in our quest to drive Maryland Toward Zero Deaths. By improving transportation safety,
we will make a difference in the lives of drivers and passengers, pedestrians, bicyclists,
and motorcyclists.

Thank you,

Pete K. Rahn
Transportation Secretary

October 2015
Executive Summary
Transportation Safety Overview

O
         ver the past five years, an average of 502 deaths and 3,702 serious injuries occurred
         each year on Maryland state and locally owned public roadways.1 Each of these
         severe outcomes is not just a number, but an actual person – one who suffered
a trauma or lost his or her life unnecessarily. In addition to the impact on individuals, each
roadway fatality and serious injury affects multiple family members, friends, and coworkers.
Most of us have been directly affected by a severe traffic crash. In the United States, as well
as in Maryland, motor vehicle crashes are a major cause of death and disability.

To combat these unnecessary tragedies, Maryland
leaders continue to build partnerships with government
agencies, private citizens, traditional safety advocates,
and nontraditional partners. The Maryland Department
of Transportation’s (MDOT) Highway Safety Office
(MHSO) and State Highway Administration (SHA) have
adopted the Toward Zero Deaths (TZD) approach. TZD is a
data-driven effort to reduce fatalities and serious injuries by developing strong leadership in
organizations that directly impact highway safety.

The results of implementation are being measured against established performance targets.
From 2009 to 2013, which includes implementation of the previous Strategic Highway Safety
Plan (SHSP), the number of annual traffic fatalities in Maryland decreased by 15.3 percent.
Though every fatality is tragic, every life saved is an accomplishment to be celebrated as the
TZD vision moves closer to reality.

1   Data from 2009-2013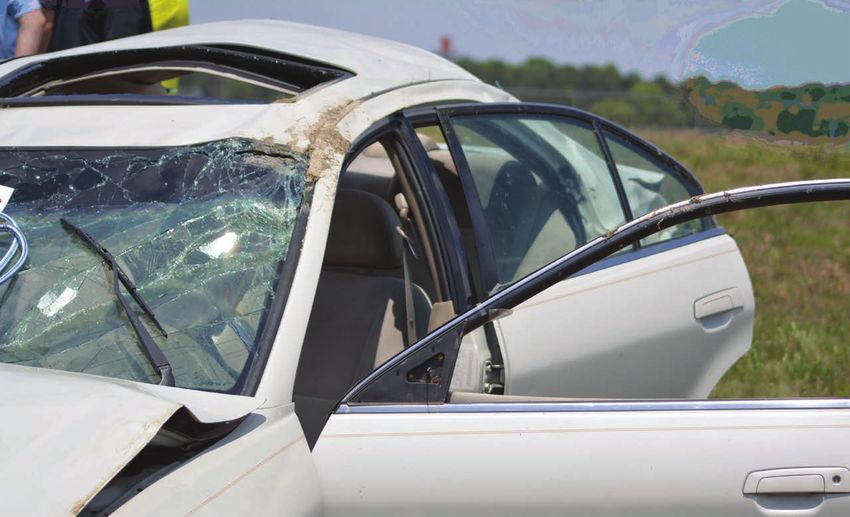
v | MARYLAND STRATEGIC HIGHWAY SAFETY PLAN | 2016-2020

                  2016-2020 Strategic Highway Safety Plan

                  T
                        he 2016-2020 SHSP uses a focused approach on specific emphasis areas (EAs) and
                        incorporates systemic safety implementation to complement the location-focused approach
                        of the previous SHSP. Safety leaders convened a wide range of stakeholder groups to develop
                  the new plan, and they participated in a series of meetings to confirm the final list of emphasis areas,
                  develop strategies, and begin working on action steps to meet the new performance targets.

                                 2016-2020
                                 Performance Targets

                                             394                                     2,939
                                           or fewer fatalities                    or fewer serious injuries
2016-2020 | MARYLAND STRATEGIC HIGHWAY SAFETY PLAN | vi

The framework below provides a visual description of Maryland’s SHSP vision and process and
is an enhancement of the previous SHSP Matrix. The foundation of the SHSP is data. Safety data
systems are used throughout the plan’s life cycle to develop and implement strategies and to
evaluate progress toward the goal. The Four Es of Safety - Enforcement, Engineering, Education, and
Emergency Medical Services - serve as the cornerstones of the plan. These stakeholder communities
are represented on emphasis area teams that form the basis of the SHSP strategies. Coordination,
collaboration, and communication power the engine that drives the six EA Teams. Their efforts are
focused on target groups identified at the center of the figure. Bicyclists and pedestrians are both an
emphasis area and target group; these users are vulnerable to the actions of other road users while
also at risk due to their own actions.

                                        Safer Roads in Maryland
          ENFORCEMENT                                                                                ENGINEERING

                                                                                              CO
                                                                         Distr                  LL
                                                    ive                       a
                                                 ess g                   Driv cted
                                                                                                   AB

                                                r                            ing
                                              gg rivin
                                                                                                     OR
                                    N
                                  IO

                                                                                                        AT

                                                D
                                        A
                                AT

                                                                                                          ION
                             DIN

                                                              Children
                         COOR

                                                                                              Infra

                                                    Trucks/              Young
                                                                                                Highway

                                                     Buses               Drivers
                        s
                                    yclists
                       n

                                                                                                   structure
                      a

                                                              TARGET
                     i

                                                   Motor-     GROUP High Risk
                   tr

                                                   cyclists
                  s

                                                                           21-34
                              & Bic
               ede

                                                        Peds & Older
                              P

                                                        Cyclists Drivers

                                                 c                                 e
                                              ro c u p
                                              O

                                                                                   d

                                                te a n t                      p air g
                                        P

                                                   c ti                    I m vi n
                                                        on        t           D ri
                                                                                      O   N
                                                                                  ATI
                                                                COMMUNIC                       EMERGENCY
          EDUCATION                                                                       MEDICAL SERVICES

                                 Citation/                                                                        Injury
             Crash              Adjudication          Roadway            Driver               Vehicle          Surveillance
                                                                                                                 System

                                                                DATA
vii | MARYLAND STRATEGIC HIGHWAY SAFETY PLAN | 2016-2020
2016-2020 | MARYLAND STRATEGIC HIGHWAY SAFETY PLAN | viii

TABLE OF CONTENTS

  Letter from the Transportation Secretary.................................................................................ii
  Executive Summary..........................................................................................................................iv
        Transportation Safety Overview..........................................................................................iv
        2016-2020 Strategic Highway Safety Plan........................................................................v
  Table of Contents........................................................................................................... viii
  1. Introduction, Background, and History.................................................................... 1
  2. Traffic Records and Crash History.............................................................................. 6
        2.1 Traffic Records and Information Systems....................................................................6
        2.2 Maryland Crash History.....................................................................................................7
  3. Use of Effective Strategies and Countermeasures: Emphasis Areas................... 9
        3.1 Aggressive Driving............................................................................................................ 10
        3.2 Distracted Driving............................................................................................................. 12
        3.3 Impaired Driving............................................................................................................... 14
        3.4 Occupant Protection........................................................................................................ 16
        3.5 Highway Infrastructure................................................................................................... 18
        3.6 Pedestrians and Bicyclists.............................................................................................. 21
  4. FHWA Standardized Performance and Survey Measures................................... 24
  5. Special Vehicles and Roadway Environments....................................................... 26
  6. SHSP Implementation................................................................................................ 28
  7. SHSP Evaluation and Update Cycle......................................................................... 29
        7.1 Evaluation Process............................................................................................................ 29
        7.2 Update Schedule............................................................................................................... 29
  Appendix A: Maryland Strategic Highway Safety Plan Implementation Team......... 31
  Appendix B: Glossary ..................................................................................................................... 32
ix | MARYLAND STRATEGIC HIGHWAY SAFETY PLAN | 2016-2020
1.
Introduction, Background, and History
M
aryland’s SHSP has evolved over the years with changes based on results,
prevailing legislation, and federal guidance. Maryland consults with the federal
government to apply new processes and affirm content updates during each
revision. As shown in the figure below, Maryland has sponsored and developed three SHSPs
since 2006 with each iteration built upon previous experiences and results. Based on these
evolving approaches over time, Maryland has achieved success in reducing fatalities and
serious injuries. The SHSPs of the past provide a solid foundation upon which future plans
can be built.
SHSP Timeline Overview
National Initiatives
AASHTO National SAFETEA-LU Leadership National Initiative
SHSP published Legislation Summit Toward Zero Deaths
1997 2003 2005 2006 2010 2011 2015
Maryland’s Response Maryland models SHSP Maryland adopts Four Es approach - Maryland joins AASHTO in adopting
after National Plan Engineering, Education, Enforcement, Toward Zero Deaths
and Emergency Medical Services
10.3 % Fatalities 15.3 % Fatalities
39.9% Serious injuries 32.5% Serious Injuries
14.4% Injuries 9.8% Injuries
2003-2005 SHSP
The first Maryland SHSP was modeled after the American Association of State Highway and
Transportation Officials (AASHTO) national plan and focused on the State’s transportation
safety problems in 23 program areas, including multiple strategies to reduce fatalities and
serious injuries on Maryland’s roadways.2 | MARYLAND STRATEGIC HIGHWAY SAFETY PLAN | 2016-2020
2006-2010 SHSP
In 2006, Maryland updated the SHSP based on the process recommended by the 2005 Safe,
Accountable, Flexible, and Efficient Transportation Equity Act: A Legacy for Users (SAFETEA–LU)
legislation. The result was a statewide, comprehensive safety plan that provided a coordinated
framework for establishing statewide goals, targets, and key emphasis areas developed in
consultation with federal, state, local, and private-sector safety stakeholders.
2011-2015 SHSP
In 2010, Maryland joined many other states and AASHTO in adopting the Toward Zero Deaths
(TZD) national vision. Through a Governors Proclamation, Maryland launched its TZD campaign,
which has been adopted by the Maryland Chiefs of Police Association, the Maryland Sheriff’s
Association, the Maryland EMS Board, and the Maryland Association of County Health Officers.
Maryland has set a goal of reducing motor-vehicle related fatalities and injuries by one-half of the
2008 baseline by 2030, with an eventual goal to achieve zero traffic deaths.
The 2011 SHSP, with this goal in mind, was updated to focus more strategically
6 on emphasis areas likely to yield results. Maryland reduced its SHSP emphasis
gic
areas to six, each of which adopted fatality and injury reduction targets.
ate
14
Str
23
EMPHASIS AREAS2016-2020 | MARYLAND STRATEGIC HIGHWAY SAFETY PLAN | 3
2016-2020 SHSP 2016-2020
Annual Average
2008-2030 Performance Goals
Maryland maintains the TZD approach by developing interim targets
Fatalities & serious
to reduce fatalities by at least 50 percent in the next two decades injuries
(from 592 in 2008 to 296 in 2030).
50%
Considering the federal guidelines detailed in Moving Ahead for
Progress in the 21st Century (MAP-21) and the subsequent Fixing
America’s Surface Transportation (FAST) Act, Maryland executives 2030
collaborated on revisions to the target-setting methodology. The
initial TZD goal remains: 296 fatalities or fewer by 2030. The annual 296
or fewer fatalities
targets for each of the SHSP’s six emphasis areas are set using an
exponential trend line connecting the historical data to the 2030
goal. Five-year averages are used to calculate projections, and the
2030
targets for each individual year are taken from the midpoint of the
five-year average (e.g., 2017 annual interim target = midpoint of the 2,272
or fewer serious injuries
2015-2019 average). The same methodology was used for serious
injury targets. However, it should be noted that due to significant
declines in serious injuries in recent years, the use of historical trends
currently puts the State at or below current targets. Finally, this same method was applied to the
five performance measures required by the Federal Highway Administration (FHWA): fatalities,
fatality rate, serious injuries, serious injury rate, and non-motorized fatalities and serious injuries.
(See pages 24-25).
All traffic safety documents in the state of Maryland conform to these methodologies, including
the SHSP, the MHSO’s Highway Safety Plan (HSP), the SHA’s Highway Safety Improvement Plan
(HSIP), and the SHA’s Commercial Vehicle Safety Plan (CVSP). Additionally, all planning documents
developed by the MHSO staff and all State-level reporting to the Governor use the SHSP emphasis-
area fatality and serious injury target-setting methodology.
Unless otherwise noted, all data are derived
from the SHA’s Safety Information Databases
(SHA-SID) and Traffic Analysis Network Garage
(TANG) based on crash reports submitted to,
and processed by, the Maryland State Police
Central Records Division (MSP-CRD) utilizing
the Enhanced Maryland Automated Accident
Reporting System (eMAARS) and the Automated
Crash Reporting System (ACRS). Data are subject
to change. Effective January 1, 2015, all law
enforcement agencies were mandated by the
MSP to submit all crash reports via ACRS.4 | MARYLAND STRATEGIC HIGHWAY SAFETY PLAN | 2016-2020
SHSP Development. Maryland began updating the SHSP by convening the
Maryland Highway Safety Summit over a three-day period in February 2014.
Approximately 300 safety stakeholders from a wide variety of organizations and
disciplines attended the event, which served as a springboard to developing the
2016-2020 SHSP. The event was a successful culmination of more than a year’s worth of planning
and coordination.
The Summit carried a theme of “Connecting the Dots,” emphasizing the need for collaboration
across the Four Es to meet Maryland’s transportation safety targets. Members of the SHSP Executive
Council attended the Summit, and their participation helped set the tone and framework for the
2016-2020 SHSP planning process. Partners were engaged in a wide variety of topics and new ideas,
and their experiences were infused into SHSP Emphasis Area (EA) Teams.
Maryland’s safety leaders held a 2016-2020 SHSP kick-off meeting with key stakeholders in September
2014 to outline a process to develop the new SHSP and performance measure methodology. The
roles and responsibilities of the Executive Council and the EA Teams were presented along with
the proposed timeline for SHSP development. Speakers reviewed Maryland’s progress to date, the
SHSP’s target setting methodology, and strengths and weaknesses of the current plan. The group
nominated chairs and co-chairs of the EA Teams.
The 2016-2020 SHSP takes the essence of the previous plan (a focused approach on specific
emphasis areas) and incorporates systemic safety implementation to complement the location-
focused approach of the previous SHSP. The result is an evidence-based approach that starts with
asking the question, “What do the data tell us?” The answer can lead to lasting change. The analysis
of EAs and target groups culminated in the development of the plan’s six EAs and seven target
groups, as illustrated in the figure below.
CO
Distr LL
ive a
ess g Driv cted
AB
r ing
gg rivin
OR
ION
AT
D
A
ION
NAT
Children
COORDI
Infra
Trucks/ Young
Highway
Buses Drivers
Pedes ns
yclists
structure
tria
TARGET
Motor- GROUP High Risk
cyclists 21-34
& Bic
Peds & Older
Cyclists Drivers
c e
ro c u p
O
d
te a n t p air g
P
c ti I m vi n
on t D ri
O N
ATI
COMMUNIC2016-2020 | MARYLAND STRATEGIC HIGHWAY SAFETY PLAN | 5 Stakeholders. A wide range of stakeholder groups – including federal, state and local government agencies, nongovernmental organizations, regional authorities, and individual advocates – participated in the development of the SHSP.2 Each EA Team – which includes regional and local agencies – held at least two facilitated discussions to identify, develop, and finalize strategies for the 2016-2020 SHSP.3 Each EA Team wrestled with difficult decisions regarding how to cover the essentials of transportation safety while remaining strategic and focused on the most vital needs. This list of stakeholder safety partners is available in Appendix A. Emphasis Area Strategy Development. The Executive Council met in January 2015 to hear the EA Team chairs and co-chairs present their existing strategies, proposed revisions, and any challenges and opportunities that emerged from the planning process. The Executive Committee and the Steering Committee at large provided feedback to the chairs and co-chairs and approved their strategies. One change made for the 2016-2020 SHSP is the addition of bicyclists to the Pedestrian EA. Pedestrians and bicyclists are critical target groups within the Maryland SHSP, so combining them into a single EA will help stakeholders address the safety needs of these non- motorized road users. Links to Other Maryland Safety Plans Specific goals and targeting methodology in the HSIP, CVSP, HSP, and the safety components of the Statewide Transportation Improvement Program (STIP) are consistent with Maryland’s SHSP.4 Additionally, the MDOT’s Motor Vehicle Administration (MVA) has developed a Motorcycle Safety Programs Action Plan, an Older and Medically At-Risk Drivers – Strategic Program Action Plan, and a Young Drivers Strategic Plan. Specific action steps related to enforcement, education, roadway design, public information and program administration for motorcycles, older drivers, and younger drivers will be addressed by action steps across the EA Teams as the data may dictate. Local plans, including Metropolitan Transportation Plans, have been developed in coordination with the SHSP. The MHSO encourages Maryland jurisdictions to develop a local SHSP that follows the targets, strategies, and structure of the Maryland SHSP. These and other State and local transportation planning documents are valuable complements to the implementation and success of Maryland’s SHSP. 2 23 US Code 148(a)(12)(A) – http://www.gpo.gov/fdsys/pkg/USCODE-2011-title23/html/USCODE-2011-title23-chap1-sec148.htm 3 23 US Code 148(a)(12)(E) – http://www.gpo.gov/fdsys/pkg/USCODE-2011-title23/html/USCODE-2011-title23-chap1-sec148.htm 4 23 US Code 148(a)(12)(H)) – http://www.gpo.gov/fdsys/pkg/USCODE-2011-title23/html/USCODE-2011-title23-chap1-sec148.htm
2.
Traffic Records and Crash History

                                     2.1 Traffic Records and Information Systems

                                     I
                                         n an effort to advance Maryland’s traffic safety community in achieving the vision of zero
                                         traffic-related deaths, the State established the Traffic Records Coordinating Committee
                                         (TRCC). The TRCC’s mission is to coordinate all traffic records system components (crash,
                                     roadway, citation/adjudication, driver, vehicle, and injury surveillance) using data quality
                                     performance measures (timeliness, completeness, accuracy, accessibility, integration, and
                                     uniformity). The TRCC exists and operates as part of
                                     the statewide support for the SHSP.5 The combined
                                     efforts of policy leaders, decision makers, and                Traffic Records
                                     technical experts of the TRCC are crucial to                    Strategic Plan
                                     improving and continuing the availability of critical    The  TRSP  aims to improve the quality,
                                     data to EA Teams and all stakeholders contributing        timeliness, and availability of traffic
                                     to SHSP strategy implementation. Maryland                records  data and systems that enable
                                     maintains traffic records information systems in             practitioners to improve safety.
                                     compliance with federal recommendations and
                                     State requirements to support stakeholder needs
                                     and the management of Maryland’s highway safety programs. Quality data analysis is critical for
                                     EA Teams to properly identify target groups, adapt and refine countermeasures, and evaluate
                                     the effectiveness of implemented strategies. To ensure consistent and appropriate support of
                                     the SHSP, a dedicated Data Coordinator has been assigned to each EA Team to coordinate all
                                     data needs within that team.

                                     MHSO manages both a Traffic Records Strategic Plan (TRSP) and the SHSP. As a follow-up to the
                                     completion of a Traffic Records Assessment in December 2014, the TRCC is in the final stages
                                     of developing a new five-year TRSP to coincide with the 2016–2020 SHSP. This purposeful
                                     alignment further strengthens the connection between Maryland’s traffic records data and its
                                     traffic safety programs as each plan is written in coordination with
                                     the other. The process of developing strategies in both the TRSP
                                     and the SHSP is similar. Each SHSP EA Team develops strategies
                                     with a vision and understanding of the need for data to carry out
                                     and measure selected actions, and the TRCC develops strategies
                                     in consideration of the end users, such as the EA Team members.

                                     5   This is required under Highway Safety Programs, MAP-21 Section 31102
2016-2020 | MARYLAND STRATEGIC HIGHWAY SAFETY PLAN | 7
2.2 Maryland Crash History
F
rom 2009 to 2013, an average of 502 people were
killed each year in traffic crashes in Maryland, and an
average of 3,207 people were seriously injured. On
average, one person was killed every 18 hours; someone
was seriously injured every 2.5 hours; and a reported crash
occurred every six minutes.
9
FATALITIES
71
SERIOUS
1,730
POLICE-REPORTED
INJURIES CRASHES
One Week in
Maryland
Since 2009, positive downward trends have been experienced in fatalities and serious injuries as
shown in the following table:
STATEWIDE FATALITIES AND SERIOUS INJURIES
Five Year % Change from
2009 2010 2011 2012 2013 Avg 2009 to 2013
Fatalities 550 496 488 511 466 502 -15.3%
Serious Injuries 4,383 4,051 3,809 3,312 2,957 3,702 -32.5%
SOURCE: Maryland Highway Safety Office Benchmark Report
The five-year fatality rate trend for Maryland decreased
from a high of 0.989 fatalities per 100 million vehicle miles
traveled (VMT) in 2009 to a low of 0.825 in 2013. The overall
fatality rate also has been consistently lower than the
national fatality rate for every year since 1992. Total VMT
increased by slightly less than one percent to 56.5 billion
between 2012 and 2013.8 | MARYLAND STRATEGIC HIGHWAY SAFETY PLAN | 2016-2020
FATALITY RATE, VEHICLE MILES TRAVELED, MARYLAND AND NATIONAL, 2009-2013
VMT
YEAR (100 Million Miles) FATALITIES* FATALITY RATE* NATIONAL FATALITY RATE**
2009 556 550 0.989 1.15
2010 562 496 0.882 1.11
2011 560 488 0.870 1.10
2012 564 511 0.906 1.14
2013 565 466 0.825 N/A
5-yr Avg 561 502 0.894 N/A
*Source: SHA-SID/ eMAARS and ACRS
**Source: NHTSA, Fatality Analysis Reporting (FARS)
The figure below displays both the rise in VMT and the decrease in fatalities over the 20-year period
from 1993 to 2013:
Maryland VMT and Traffic Fatality Trends for State and Local Roadways
700 600
VMT
650
550
FATALITIES
600
VMT (100 Million Miles)
500
Fatalities
550
450
500
400
450
400 350
1993 1994 1995 1996 1997 1998 1999 2000 2001 2002 2003 2004 2005 2006 2007 2008 2009 2010 2011 2012 20133.
Emphasis Areas
Use of Effective Strategies and Countermeasures:
T
he Maryland SHSP describes a program of strategies to minimize or eliminate traffic-
related fatalities and serious injuries.6 Priority has been given to those strategies that
can significantly reduce roadway fatalities and serious injuries in the six identified
SHSP EAs (in no particular order):
∙ Aggressive Driving ∙ Occupant Protection
∙ Distracted Driving ∙ Highway Infrastructure
∙ Impaired Driving ∙ Pedestrians and Bicyclists
As described in the following sections, the Maryland SHSP Executive Council considered
a variety of key factors when determining strategies for the SHSP EAs, including the
highway safety elements of engineering, education, enforcement, and emergency
medical services, applied to both infrastructure and non-infrastructure emphasis areas,
as appropriate.7
6 23 US Code 148(a)(12)(F) – Highway safety improvement program. http://www.gpo.gov/fdsys/pkg/USCODE-2011-title23/html/USCODE-
2011-title23-chap1-sec148.htm
7 23 US Code 148(a)(12)(C) – Highway safety improvement program. http://www.gpo.gov/fdsys/pkg/USCODE-2011-title23/html/USCODE-
2011-title23-chap1-sec148.htm10 | MARYLAND STRATEGIC HIGHWAY SAFETY PLAN | 2016-2020
3.1 Aggressive Driving
A
n average of 51 fatalities and 336 serious injuries occurred each year in traffic crashes
involving an aggressive driver. Traffic congestion, distracted drivers, speeding, and
following too closely are just a few factors that can lead to aggressive driving behavior.
An aggressive driving crash occurs when at least one driver in the crash was reported to be driving
aggressively, defined by having one of the following values in both the primary and secondary
Contributing Circumstance fields from the standard crash report form:
• Failed to yield right-of-way • Failed to obey stop sign
• Failed to keep right of center • Failed to stop for a school bus
• Too fast for conditions • Followed too closely
• Failed to obey other traffic control • Exceeded speed limit
• Failed to obey traffic signal • Improper lane change
• Improper passing • Other improper action
• Disregarded other road markings • Wrong way on a one way street
• Failure to obey traffic signs, signals, or officer • Operated motor vehicle in erratic/reckless manner
Education and awareness play important roles in
reducing aggressive driving behavior. Creating a broader
understanding of the behaviors that are associated with
aggressive driving can lead to reductions in these types of
crashes and associated fatalities and injuries. Enforcement
also play a strong role. More than 1.2 million motor vehicle
moving-violation citations are issued annually throughout
the State; nearly one-quarter are speeding violations.
The Aggressive Driving EA Team fosters coordination
among transportation agencies, safety professionals, and
law enforcement to help reduce the number of aggressive
driving related fatalities and serious injuries.
3.1.1 Performance Targets
The Aggressive Driving EA Team, in cooperation with the SHSP Executive Council, is responsible for
meeting or exceeding the following performance targets:
Fatality Target: Reduce the number of aggressive driving related fatalities on all roads in
Maryland from the five-year average (2004-2008) of 70 to 29 or fewer by December 31, 2020.
Serious Injury Target: Reduce the number of aggressive driving related serious injuries
on all roads in Maryland from the five-year average (2004-2008) of 525 to 273 or fewer by
December 31, 2020.2016-2020 | MARYLAND STRATEGIC HIGHWAY SAFETY PLAN | 11
80
AGGRESSIVE DRIVING FATALITIES
70
70
69
66
(Five-year average)
60 57
52 51
50
2030
Fatality Average
45
41
40
29 31
30 2020
Annual
20 Target
ACTUAL GOAL
10
0
2004-2008 2006-2010 2008-2012 2010-2014 2012-2016 2014-2018 2016-2020
2005-2009 2007-2011 2009-2013 2011-2015 2013-2017 2015-2019
600
535
525 AGGRESSIVE DRIVING SERIOUS INJURIES
500 483 (Five-year average)
407
Serioues Injury Average
400 367
336 2030
300 288
251
273 225
200 2020
ACTUAL Annual
Target
100 GOAL
0
2004-2008 2006-2010 2008-2012 2010-2014 2012-2016 2014-2018 2016-2020
2005-2009 2007-2011 2009-2013 2011-2015 2013-2017 2015-2019
3.1.2 Emphasis Area Strategies
To accomplish the performance targets, the Aggressive Driving EA
Team will implement the following strategies:
1. Use data-driven approaches to identify driver behaviors and
target audiences to focus on aggressive and speed-related
enforcement, education, engineering, and emergency services.
2. Develop and implement aggressive driving enforcement practices.
3. Identify and implement effective engineering and
technological solutions to reduce aggressive driving.
4. Conduct public awareness, training, and media programs aimed at reducing aggressive driving.
5. Promote and support legislation and adjudication to reduce aggressive driving.12 | MARYLAND STRATEGIC HIGHWAY SAFETY PLAN | 2016-2020
3.2 Distracted Driving
I
n Maryland an average of 232 people were killed each year and
2,348 seriously injured in crashes involving a distracted driver.
Driver distraction has joined alcohol and speeding as a leading
factor in fatal and serious injury crashes. A distracted driving crash
occurs when a driver shifts attention away from the driving task due
to a number of things, including adjusting a radio, attending to a
child, or using a cell phone (e.g., talking, texting, or other use).
3.2.1 Performance Targets
The Distracted Driving EA Team, in cooperation with the SHSP
Executive Council, will be responsible for meeting or exceeding the
following performance targets:
Fatality Target: Reduce the number of distracted driving related fatalities on all roads in
Maryland from the five-year average (2004 to 2008) of 333 to 177 or fewer by December 31, 2020.
Serious Injury Target: Reduce the number of distracted driving related serious injuries on
all roads in Maryland from the five-year average (2004-2008) of 4,134 to 1,826 or fewer by
December 31, 2020.2016-2020 | MARYLAND STRATEGIC HIGHWAY SAFETY PLAN | 13
350 333
303
DISTRACTED DRIVING FATALITIES
300 281 (Five-year average) 2030
260
250
232
Fatality Average
250
200
211
185
177 135
2020
150
Annual
100 ACTUAL Target
GOAL
50
0
2004-2008 2006-2010 2008-2012 2010-2014 2012-2016 2014-2018 2016-2020
2005-2009 2007-2011 2009-2013 2011-2015 2013-2017 2015-2019
4,500
4,134 DISTRACTED DRIVING SERIOUS INJURIES
3,648 (Five-year average) 2030
3,500 3,191
Serioues Injury Average
2,826
2,545 1,826 1,421
2,348
2,500 2020
2,097
1,770 Annual
Target
1,500
ACTUAL GOAL
0
2004-2008 2006-2010 2008-2012 2010-2014 2012-2016 2014-2018 2016-2020
2005-2009 2007-2011 2009-2013 2011-2015 2013-2017 2015-2019
3.2.2 Emphasis Area Strategies
To accomplish the performance targets, the Distracted Driving EA Team will
implement the following strategies:
1. Evaluate and improve data quality for problem identification and
program evaluation purposes.
2. Enhance and improve enforcement of distracted driving laws.
3. Integrate and foster the use of technologies and engineering applications to address
distracted driving infrastructure.
4. Conduct outreach initiatives including, but not limited to, education, training, and media
programs to reduce distracted driving.
5. Evaluate and recommend legislation and/or regulations that address distractive behavior
while driving.14 | MARYLAND STRATEGIC HIGHWAY SAFETY PLAN | 2016-2020
3.3 Impaired Driving
A
n average of 160 people lost their lives and
530 were seriously injured in crashes involving
an impaired driver.
According to NHTSA’s Fatal Analysis Reporting System
(FARS), drivers are considered to be alcohol-impaired
when their blood alcohol concentration (BAC) is 0.08
grams per deciliter (g/dL) or higher. Thus, any fatality
occurring in a crash involving a driver with a BAC of
0.08 or higher is considered to be an alcohol-impaired
driving fatality. In Maryland, an impaired driving crash as indicated on the Maryland crash report
is determined by the investigating officer based on the driver’s condition, BAC, and/or substance
use detection. It will include any level of alcohol in the system and/or drug impairment. Therefore
Maryland impaired driving targets are different than the targets based on FARS data. Targets for
both State- and federally-defined impaired driving are included herein to maintain continuity with
previous Maryland SHSPs and to maintain the link with other State plans that exclusively use State
crash data as the source for problem identification and program evaluation.
3.3.1 Performance Targets
The Impaired Driving EA Team, in cooperation with the SHSP Executive Council, will be responsible
for meeting or exceeding the following performance targets:
State-Defined Impaired Driving Fatality Target: Reduce the OVER THE LAST YEAR, PARTNERING LAW ENFORCEMENT AGENCIES PARTICIPATED IN A
DUI REDUCTION EFFORT WHICH YIELDED THE FOLLOWING RESULTS:
number of State-defined (alcohol/drug) impaired driving related
fatalities on all roads in Maryland from the five-year average 6,300+
TRAFFIC STOPS
(2004-2008) of 210 to 122 or fewer by December 31, 2020.
1,000+ OVER
NHTSA-Defined Impaired Driving Fatality Target: Reduce the
number of NHTSA-defined (BAC 0.08) impaired driving related DUI 200
CRIMINAL
ARRESTS & OTHER
ARRESTS
fatalities on all roads in Maryland from the five-year average
34% OF ALL FATALITIES IN MARYLAND
ARE CAUSED BY IMPAIRED DRIVERS
(2004-2008) of 178 to 107 or fewer by December 31, 2020. ON AVERAGE, NEARLY
171 KILLED
PEOPLE ARE
1/3
Impaired Driving EACH YEAR
IN MARYLAND DUE TO CRASHES
OF FATAL
IMPAIRED DRIVING
OCCUR BETWEEN
IMPAIRED DRIVING
Serious Injury
MIDNIGHT AND 4 A.M.
Target: Reduce the towardzerodeathsmd.com
number of impaired (alcohol/drug) driving related
serious injuries on all roads in Maryland from the
five-year average (2004-2008) of 862 to 421 or
fewer by December 31, 2020.2016-2020 | MARYLAND STRATEGIC HIGHWAY SAFETY PLAN | 15
250
IMPAIRED DRIVING FATALITIES
210
202
(Five-year average)
197
200 185
175
170
2030
Fatality Average
162 162
178
150
168 166 161 State:122
85
158 156
149 150
100
State Definition: Impaired (alcohol and/or drug)
NHTSA:107 72
NHTSA Definition: Impaired (alcohol BAC 0.08+) 2020
Annual
Target
GOAL
50
ACTUAL
0
2004-2008 2006-2010 2008-2012 2010-2014 2012-2016 2014-2018 2016-2020
2005-2009 2007-2011 2009-2013 2011-2015 2013-2017 2015-2019
1,000
IMPAIRED DRIVING SERIOUS INJURIES
862
809
(Five-year average)
800
712
Serioues Injury Average
644 2030
589
421
600 544
499
455
2020
315
400 Annual
Target
GOAL
200
ACTUAL
0
2004-2008 2006-2010 2008-2012 2010-2014 2012-2016 2014-2018 2016-2020
2005-2009 2007-2011 2009-2013 2011-2015 2013-2017 2015-2019
3.3.2 Emphasis Area Strategies
To accomplish the performance targets, the Impaired Driving EA
Team will implement the following strategies:
1. Improve the availability, quality, collection, and use of data
to support impaired driving enforcement, adjudication,
programs, and initiatives.
2. Enhance and improve enforcement of impaired driving laws.
3. Enhance and improve the prosecution and adjudication of impaired driving cases.
4. Investigate and foster the use of technologies and best practices to support impaired
driving countermeasures.
5. Conduct outreach initiatives including, but not limited to, education, training, and media
programs, to reduce impaired driving.
6. Investigate and promote policies and legislation aimed at reducing impaired driving.16 | MARYLAND STRATEGIC HIGHWAY SAFETY PLAN | 2016-2020
3.4 Occupant Protection
A
n average of 166 unrestrained motorists were killed in Maryland traffic crashes each year,
and an average of 315 were seriously injured. Non-use of personal restraint or protective
equipment typically is not a contributing factor to a crash occurring, but when a crash does
occur, the severity of personal injury is affected greatly by the use or non-use of safety equipment
designed for occupant protection.
An unrestrained-occupant crash is defined as including a passenger vehicle (automobile, station
wagon, van, SUV, or pickup truck) occupant:
• Less than eight years of age recorded as not using a
“Child/Youth Restraint,”
• Eight years of age or older recorded as not using a
“Lap and Shoulder Belt” or “Air Bag and Belt,” or
• Whose restraint use was recorded as using “None” or
“Air Bag Only.”
In 2014 the state of Maryland seat belt usage rate was recorded at 92.1 percent, up from
90.7 percent in 2013.
3.4.1 Performance Targets
The Occupant Protection EA Team, in cooperation with the SHSP Executive Council, will be
responsible for meeting or exceeding the following performance targets:
Fatality Target: Reduce the number of unrestrained-occupant motor vehicle fatalities on
all roads in Maryland from the five-year average (2004-2008) of 161 to 95 or fewer by
December 31, 2020.
Serious Injury Target: Reduce the number of unrestrained-occupant motor vehicle serious
injuries on all roads in Maryland from the five-year average (2004-2008) of 632 to 274 or fewer
by December 31, 2020.2016-2020 | MARYLAND STRATEGIC HIGHWAY SAFETY PLAN | 17
180 161 UNRESTRAINED MOTOR VEHICLE FATALITIES
153
144 (Five-year average) 2030
150 137 130 123
Fatality Average
117
120 109
95 71
90 2020
Annual
60
ACTUAL Target
30
GOAL
0
2004-2008 2006-2010 2008-2012 2010-2014 2012-2016 2014-2018 2016-2020
2005-2009 2007-2011 2009-2013 2011-2015 2013-2017 2015-2019
700
632 UNRESTRAINED MOTOR VEHICLE SERIOUS INJURIES
600 548 (Five-year average) 2030
467
Serioues Injury Average
500
400
398 361
315
274 225
295 2020
300 282
Annual
200 Target
ACTUAL GOAL
100
0
2004-2008 2006-2010 2008-2012 2010-2014 2012-2016 2014-2018 2016-2020
2005-2009 2007-2011 2009-2013 2011-2015 2013-2017 2015-2019
3.4.2 Emphasis Area Strategies
To accomplish the performance targets, the Occupant
Protection EA Team will implement the following strategies:
1. Improve the timeliness, accuracy, completeness,
uniformity, accessibility, and integration of occupant
protection related data.
2. Enhance and improve enforcement of adult and child occupant protection laws.
3. Implement adult and child occupant protection public awareness and education, training,
and media campaigns.
4. Evaluate and recommend legislation and/or regulations to advance occupant protection
for all ages.18 | MARYLAND STRATEGIC HIGHWAY SAFETY PLAN | 2016-2020
3.5 Highway Infrastructure
A
n average of 276 fatalities and 2,169 serious injuries occurred in crashes involving
infrastructure-related issues. Intersection-related and run-off-the-road crashes are the
prime indicators of roadway infrastructure opportunities for improvement. Work-zone
crashes also are included in this emphasis area.
Distribution of fixed objects struck in run-off road
fatalities on all Maryland roadways — 2009-2013
Other/Unknown*
N/A 8%
5%
Embankment
5%
Culvert-Ditch 7% 33% Tree-Shrubbery
12%
Curb-Wall
14% 16%
Light or Other Pole Guardrail-Barrier
* “Other/Unknown” includes Bridge Overpass, Building, Crash Attenuator, Fence, and Sign Post.2016-2020 | MARYLAND STRATEGIC HIGHWAY SAFETY PLAN | 19
A Run-Off-the-Road Crash is defined as a crash where
the first event was recorded as striking a fixed object or
running off the road, or the location of the crash was
reported as off-road or in the median. An average of
180 fatalities and 906 serious injuries occurred in run-off-
the-road crashes each year from 2009 to 2013.
Intersection Crashes are those crashes reported as occurring in an intersection or being intersection-
related (i.e., in a traffic situation resulting from an intersection). An average of 103 fatalities and
1,320 serious injuries occurred in intersection-related crashes each year from 2009 to 2013.
Work-Zone Crashes are those crashes reported as occurring in a work zone in the standard crash
report. They can include construction, maintenance, and utility work zones. From 2009-2013 Maryland
had an average of six fatalities and 48 serious injuries in work-zone related crashes annually.
This safety problem is spread across both the State and local roadway networks (with approximately
70 percent of fatalities occurring on the State-owned system), and the approach to address these
crashes must include empowering local jurisdictions.
400 369
353
HIGHWAY INFRASTRUCTURE FATALITIES
341
318 (Five-year average) 2030
295
300 276
Fatality Average
266 265
226 175
200 2020
Annual
ACTUAL Target
100
GOAL
0
2004-2008 2006-2010 2008-2012 2010-2014 2012-2016 2014-2018 2016-2020
2005-2009 2007-2011 2009-2013 2011-2015 2013-2017 2015-2019
4,000 3,739
HIGHWAY INFRASTRUCTURE SERIOUS INJURIES
3,303
2,890
(Five-year average) 2030
3,000 2,612
Serioues Injury Average
2,343
2,169 1,745 1,340
2,000 2020
2,077
1,879 Annual
Target
1,000 ACTUAL GOAL
0
2004-2008 2006-2010 2008-2012 2010-2014 2012-2016 2014-2018 2016-2020
2005-2009 2007-2011 2009-2013 2011-2015 2013-2017 2015-201920 | MARYLAND STRATEGIC HIGHWAY SAFETY PLAN | 2016-2020
3.5.1 Performance Targets
The Highway Infrastructure EA Team, in cooperation with the SHSP Executive Council, will be
responsible for meeting or exceeding the following performance targets:
Fatality Target: Reduce the number of infrastructure-related fatalities on all roads in Maryland
from the five-year average (2004-2008) of 369 to 226 or fewer by December 31, 2020.
Serious Injury Target: Reduce the number of infrastructure-related fatalities on all roads in
Maryland from the five-year average (2004-2008) of 3,739 to 1,745 or fewer by December 31, 2020.
Maryland Severity Index
The technique used in calculating the Crash Severity Index and prioritizing Candidate Safety
Improvement Locations (CSIL) is based on information from the police crash report form. The
Crash Severity Index is a weighted crash frequency adjustment to account for crash severity.
Fatality Incapacitating Non-incapacitating Possible Injury Property Damage
Injury Injury Only
The Crash Severity Index is the primary tool used to prioritize locations, and it will be
considered for Highway Infrastructure EA Strategies 1 and 2 below.
3.5.2 Emphasis Area Strategies
To accomplish the performance targets, the Highway Infrastructure EA Team will implement the
following strategies:
1. Identify intersections where the Crash Severity Index is high and implement safety improvements.
2. Identify and target safety improvements along corridors where the Crash Severity Index is
high and address roadway elements that contribute to crashes.
3. Develop and implement system-wide improvements to reduce the number and severity
of infrastructure-related crashes (e.g., intersection-related, run-off-the-road, work-zone
related, etc.).
4. Identify, develop, and implement system-wide improvements that address the safety
of vulnerable user groups (e.g., bicyclists, pedestrians, motorcyclists, older and younger
drivers, etc.).
5. Identify and implement recommended safety initiatives for commercial motor carriers.2016-2020 | MARYLAND STRATEGIC HIGHWAY SAFETY PLAN | 21
3.6 Pedestrians and Bicyclists
O
n average, 105 pedestrians were killed and 362 were seriously injured each year in
Maryland traffic crashes. In addition, an average of seven bicyclists were killed and 68 were
seriously injured each year. Non-motorized road users tend to be the most vulnerable, and
the proportion of fatalities and serious injuries involving pedestrians and bicyclists has increased
over time.
Pedestrian crashes are defined as crashes involving a person reported as a pedestrian on foot (using
the ‘pedestrian’ person type and ‘pedestrian on foot’ pedestrian type), including a motorist who has
exited a vehicle. Bicyclist crashes are defined as crashes involving a person reported as a bicyclist or
pedalcyclist (using the ‘bicyclist’ or ‘other pedalcyclist’ type).22 | MARYLAND STRATEGIC HIGHWAY SAFETY PLAN | 2016-2020
3.6.1 Performance Targets
The Pedestrians and Bicyclists EA Team, in cooperation with the SHSP
Executive Council, will be responsible for meeting or exceeding the
following performance targets:
Pedestrians
Fatality Target: Reduce the number of pedestrian fatalities on
all roads in Maryland from the five-year average (2004-2008) of
103 to 78 or fewer by December 31, 2020.
Serious Injury Target: Reduce the number of pedestrian serious Since the number of pedestrian fatalities has
remained relatively constant in recent years,
injuries on all roads in Maryland from the five-year average (2004- applying an exponential trend is not feasible.
2008) of 492 to 293 or fewer by December 31, 2020. Instead, a two-percent reduction was applied to
each year to establish the pedestrian fatality goals.
Bicyclists
Fatality Target: Reduce the number of bicycle fatalities on all roads in Maryland from the five-
year average (2004-2008) of 8 to 5 or fewer by December 31, 2020.
Serious Injury Target: Reduce the number of bicycle serious injuries on all roads in Maryland
from the five-year average (2004-2008) of 81 to 52 or fewer by December 31, 2020.
120 PEDESTRIAN FATALITIES
103 106 106 108 106 105
102 102 (Five-year average) 2030
100
78
Fatality Average
57
80
60
2020
ACTUAL Annual
40 Target
GOAL
20
0
2004-2008 2006-2010 2008-2012 2010-2014 2012-2016 2014-2018 2016-2020
2005-2009 2007-2011 2009-2013 2011-2015 2013-2017 2015-2019
600
PEDESTRIAN SERIOUS INJURIES
492
500
471 (Five-year average)
442
412
384
2030
Serioues Injury Average
400 362 351 343
300 293 227
2020
200 Annual
ACTUAL
Target
100
GOAL
0
2004-2008 2006-2010 2008-2012 2010-2014 2012-2016 2014-2018 2016-2020
2005-2009 2007-2011 2009-2013 2011-2015 2013-2017 2015-20192016-2020 | MARYLAND STRATEGIC HIGHWAY SAFETY PLAN | 23
3.6.2 Emphasis Area Strategies
To accomplish these targets, the Pedestrians and Bicyclists
EA Team will implement the following strategies:
1. Identify and target pedestrian and bicycle safety
issues, populations, and locations of concern through
the collection, analysis and evaluation of data
and information.
2. Promote safe behaviors of all road users appropriate for the environment through education
and enforcement initiatives.
3. Create and improve roadway environments for walking and bicycling through
implementation of engineering treatments, land-use planning, and system-wide
countermeasures.
4. Create and improve pedestrian and bicycle safety culture in Maryland including the
promotion and implementation of legislation and training of professionals and stakeholders
about best safety practices.
5. Develop, apply, and promote technological approaches, including those in vehicles and
emergency response equipment, in order to better prevent and reduce the severity of
collisions involving pedestrians and bicyclists.
6. Identify and promote safe driving and pedestrian behaviors for all motorists and public-safety
professionals at the scene of emergency events.
10 BICYCLE FATALITIES 2030
(Five-year average)
Fatality Average
8 8 8
8 7 7 7
6
7
5 4
6 2020
Annual
4
ACTUAL Target
2
GOAL
0
2004-2008 2006-2010 2008-2012 2010-2014 2012-2016 2014-2018 2016-2020
2005-2009 2007-2011 2009-2013 2011-2015 2013-2017 2015-2019
100 BICYCLE SERIOUS INJURIES 2030
81 (Five-year average)
Serioues Injury Average
76 76
52
80 74 73 68 69
38
64
60
2020
Annual
40
ACTUAL Target
20 GOAL
0
2004-2008 2006-2010 2008-2012 2010-2014 2012-2016 2014-2018 2016-2020
2005-2009 2007-2011 2009-2013 2011-2015 2013-2017 2015-20194.
FHWA Standardized Performance and
survey measures
T
he five required Safety Performance Measures from the Federal Highway Administration
(FHWA) below have been incorporated into the Maryland SHSP. It is important to note
that the base year numbers and targets will not match our overall visionary goals (halving
fatalities and serious injuries by 2030) nor the base year numbers and targets for each emphasis
area in the SHSP. This is due to differences in data definitions between the NHTSA Fatality Analysis
Reporting System (FARS) and the State crash data system. The source for all fatality data is the most
recently available FARS data, and serious injury data was obtained through State data. All federally
required performance measures below are set using a five-year average and exponential trend
method described on page 3.
Five-year Average (2004-2008) and
2020 Performance Targets
The Maryland SHSP establishes Fatalities Serious Injuries
the following reduction targets 623 391 6,171 2,939
through December 31, 2020, Fatality Rate Serious Injury Rate
for all Maryland roads. 1.11 0.64 10.97 5.23
Non-Motorized Fatalities and Serious Injuries
685 433
700
Total Fatalities in Maryland and Interim Targets
600
623 604 ANNUAL TARGETS
500 580 547
526 2016 2017 2018 2019 2020
501
480 483
400 442 429 416 403 391
Equal to the midpoint of the five-year averages
300
ACTUAL
296
200
100
0
2004-2008 2006-2010 2008-2012 2010-2014 2012-2016 2014-2018 2016-2020 2018-2022
2005-2009 2007-2011 2009-2013 2011-2015 2013-2017 2015-2019 2017-2021
1.5
Total Fatality Rate per 100 Million Vehicle Miles Traveled (VMT)
1.11 in Maryland and Interim Targets
1.08
1.04
ANNUAL TARGETS
1
2016 2017 2018 2019 2020
0.98 0.94 0.89 0.85 0.85 0.72 0.70 0.68 0.66 0.64
.5
Equal to the midpoint of the five-year averages
.53
ACTUAL
0
2004-2008 2006-2010 2008-2012 2010-2014 2012-2016 2014-2018 2016-2020 2018-2022
2005-2009 2007-2011 2009-2013 2011-2015 2013-2017 2015-2019 2017-20212016-2020 | MARYLAND STRATEGIC HIGHWAY SAFETY PLAN | 25
The targets for serious injuries and serious injury rate
were set in accordance with the TZD approach used
for the fatalities and fatality rates. This methodology
originally used the number of serious injuries
observed in 2008 to set the 2030 goal. Since the 2030
goal remains unchanged, the significant decline in
serious injuries observed in recent years resulted in
minimal reductions needed during the intervening
years to reach the 2030 goal.
7,000
6,171 Total Serious Injuries in Maryland and Interim Targets
6,000 5,571
4,923
5,000 4,436 ANNUAL TARGETS
4,020
4,000 3,702
3,436 3,147
2016 2017 2018 2019 2020
3,422 3,294 3,171 3,053 2,939
3,000
Equal to the midpoint of the five-year averages 2,272
2,000
ACTUAL
1,000
0
2004-2008 2006-2010 2008-2012 2010-2014 2012-2016 2014-2018 2016-2020 2018-2022
2005-2009 2007-2011 2009-2013 2011-2015 2013-2017 2015-2019 2017-2021
12 10.97 9.89 Total Serious Injury Rate per 100 Million Vehicle Miles Traveled (VMT)
in Maryland and Interim Targets
10
8.75
7.90
8 ANNUAL TARGETS
7.17 2016 2017 2018 2019 2020
6 6.59 6.10 6.08 5.86 5.64 5.43 5.23
5.57
4
ACTUAL
Equal to the midpoint of the five-year averages
4.04
2
0
2004-2008 2006-2010 2008-2012 2010-2014 2012-2016 2014-2018 2016-2020 2018-2022
2005-2009 2007-2011 2009-2013 2011-2015 2013-2017 2015-2019 2017-2021
700 Total Non-Motorized Fatalities and Serious Injuries
600 685 in Maryland and Interim Targets
663 635
603
ANNUAL TARGETS
500 570
542 528 514 2016 2017 2018 2019 2020
400
488 473 459 446 433
300 Equal to the midpoint of the five-year averages 326
200
ACTUAL
100
0
2004-2008 2006-2010 2008-2012 2010-2014 2012-2016 2014-2018 2016-2020 2018-2022
2005-2009 2007-2011 2009-2013 2011-2015 2013-2017 2015-2019 2017-20215.
SPECIAL VEHICLES AND ROADWAY ENVIRONMENTS
A
long with the six emphasis areas, special vehicles and roadway environments are
of particular interest to the SHSP Executive Council and safety stakeholders due to
their unique safety needs. Crashes involving these vehicles can pose an increased
risk to occupants and other road users, and the ramifications may reach beyond safety to
economic issues.
Commercial Motor Vehicles. The number of
commercial motor vehicles (CMVs) is increasing
on roadways across Maryland. Between
2009 and 2013, CMVs were involved in seven
percent of all traffic crashes in Maryland, and
11 percent of fatal crashes involved a CMV.
Strategies include partnering with the Federal Motor Carrier Safety Administration (FMCSA)
to help promote their efforts to improve CMV safety from a driver and vehicle perspective;
educating road users and motor carriers on CMV regulations and visibility issues; and initiating
appropriate infrastructure countermeasures with CMVs in mind.
School Buses and Bus Stops. Though school bus crashes are relatively
rare compared to other vehicle involvement, when a school bus crash
occurs it has the potential to harm multiple children. More prevalent
is pedestrians (often school children) being hit by school buses.
NHTSA indicates that most of the children killed in crashes involving
school buses are hit in a zone within 10 feet of the bus, either by the
bus itself, or a passing vehicle. Strategies include educating roadway
users, parents and children about school bus laws and regulations and
enforcement of stop sign/signal/arm violations.
Transit Buses and Bus Stops. Transit buses and bus stops have unique safety needs with
potential conflicts between vehicles, transit buses, and pedestrians. Due to the number of
occupants riding a bus, the potential for multiple
harmful outcomes should be considered when
improving safety for these road users. Strategies
include support for safe transit stops and enforcement
of laws and regulations for bus drivers. Partners
include the Maryland Transit Administration and the
Federal Transit Administration.2016-2020 | MARYLAND STRATEGIC HIGHWAY SAFETY PLAN | 27 Motorcycles. From 2009 to 2013, an average of 70 traffic fatalities and 306 serious injuries involved a motorcycle. Several factors have contributed to increased motorcycle miles driven in recent years, including increased fuel prices in the late 2000s and popularity among certain age groups (i.e. Baby Boomers). Common attributes in motorcycle crashes include alcohol-impaired operators, lack of helmet use, and aggressive driving. Failure to share the road and yield to motorcyclists are common contributing factors for vehicle drivers who collide with motorcyclists. Strategies include expanded public information and education and training programs for motorcyclists and other road users. These are addressed through the MVA’s Motorcycle Safety Action Plan. Rail-Highway Grade Crossings. According to the inventory maintained by the Federal Railroad Administration, there are 633 public at-grade, 628 private at-grade, and 22 pedestrian at-grade rail crossings in Maryland. Crashes at rail-highway grade crossings can occur between trains, motor vehicles, and pedestrians, though the number of incidents in Maryland is low. Maryland has made a continuous effort to improve safety for the traveling public at rail-highway crossings. Efforts include the installation of new flashing light signals, with or without gates, and the replacement of outdated components at existing active warning-device installations. One concern nationally is that approximately half of rail-highway grade crossing crashes occur at active crossings (i.e. those with flashers, extra signing, and/or gates), leading to a conclusion that human behavior is a primary contributing factor.
You can also read