Competition for Attention in the ETF Space - American ...
←
→
Page content transcription
If your browser does not render page correctly, please read the page content below
Competition for Attention in the ETF Space
                         Itzhak Ben-David, Francesco Franzoni,
                         Byungwook Kim, and Rabih Moussawi∗

                                       December 22, 2020

                                       PRELIMINARY

                                               Abstract

       Exchange-Traded Funds (ETFs) are among the most prominent financial innovations
       in the last three decades. While early ETFs offered broad-based portfolios at low
       cost, in later years, issuers began launching thematic ETFs that hold niche portfolios
       and charge high fees. Thematic ETFs deliver negative risk-adjusted performance,
       which does not reflect a hedging premium. Rather, thematic ETFs underperform
       because the stocks that they hold are overvalued. New thematic ETFs hold attention-
       grabbing stocks (high past performance, media exposure and sentiment). After launch,
       these securities underperform as the hype around them vanishes. Thematic ETFs are
       favored by unsophisticated retail investors. Overall, financial innovation in the ETF
       space follows two paths: broad-based products that cater to cost-conscious investors
       (the ‘Walmarts’), and expensive thematic ETFs that compete for the attention of
       sentiment-driven investors (the ‘Starbucks’).
       Keywords: ETFs, investor attention, sentiment, financial innovation, attention
       JEL Classification: G12, G14, G15

   ∗
    We thank Thummim Cho, Wes Gray, Elisabeth Kempf, Jim Simpson (ETP Resources), Amin Shams,
Matt Sheridan, Petra Vokata, and René Stulz and seminar audience at the University of Colorado at Boulder
for helpful comments. Ben-David is with The Ohio State University and National Bureau of Economic
Research, Franzoni is with USI Lugano, the Swiss Finance Institute, and CEPR, Kim is with The Ohio State
University, and Moussawi is with Villanova University and Wharton Research Data Services. Ben-David is a
co-founder and a partner in an investment advisor. Emails: ben-david.1@osu.edu, francesco.franzoni@usi.ch,
kim.7336@osu.edu, rabih.moussawi@villanova.edu.
1       Introduction
    In the last decades, the asset management industry has been disrupted by the growth
of Exchange Traded Funds (ETFs), i.e., investment vehicles that replicate the performance
of indexes and can be traded continuously in the stock market. As of the end of 2020, the
assets managed by ETFs in the U.S. alone have surpassed the $5 trillion mark, amounting to
about 17% of the total assets in U.S. investment companies. To date, over 3,400 have been
launched covering all the way from broad-based indexes like the S&P 500 to niche investment
themes, such as a trade war, cannabis, vegan products, work from home, and COVID-19.
    More broadly, ETFs are considered the epitome of the current trend of democratization
of the investment process.1 Investors have gained direct access to financial markets (e.g., low-
cost online brokers and self-managed 401K plans) as well as to real-time financial information
through formal sources and social media. The abundance of information that investors face
requires suppliers of financial products to compete for investors’ attention. However, most
ETFs are ‘plain vanilla’ investments; hence issuers cannot tout managers’ past performance
and skill (as in mutual funds, see Jain and Wu, 2000) or promise high headline returns (as
in structured products, see Célérier and Vallée, 2017; Vokata, 2020).2 For these reasons, the
ETF market offers an opportunity to examine the evolution of financial innovation stripped-
down from managerial skill and product complexity.
    We explore the economic motives fueling the introduction and proliferation of ETFs,
using the framework of Bordalo, Gennaioli, and Shleifer (2016) as a guide for the analysis.
This theory models the behavior of suppliers in a market in which consumers have limited
attention. To attract consumers, firms can make different product attributes salient. As a
result, competition can occur along the “price” and “quality” dimensions. In the context
of financial innovation, quality translates into product attributes that appeal to investors.
Consistent with this view, we document that some ETFs offer low-cost access to broad-based
indexes while others charge high fees and offer access to specialized segments of the market
that respond to investors’ preference for popular themes. Analogously to the evidence for
close-end funds in the 1980s (Lee et al., 1991), stocks in the portfolios of thematic ETFs
are overvalued and therefore these ETFs deliver negative performance in the following years.
Overall, our findings suggest that the most important financial innovation of the last three
decades, originally designed to promote cost-efficiency and diversification, has also provided
    1
     See Barbara Novick (Blackrock’s Vice Chairman and co-founder), “How Index Funds Democratize In-
vesting,” Wall Street Journal, January 8, 2017.
   2
     Other examples include the issuance of closed-end funds (Lee, Shleifer, and Thaler, 1991), fixed income
securities (Greenwood and Hanson, 2013; Gennaioli, Shleifer, and Vishny, 2012), mutual funds (Massa, 1998;
Cooper, Gulen, and Rau, 2005; Kostovetsky and Warner, 2020) and equity offerings (Baker and Wurgler,
2007).

                                                     1
a platform to cater to investors’ irrational expectations.
Our study is organized in two parts. In the first part, we describe the segmentation in
the ETF industry that corresponds to the price-salient and a quality-salient equilibria in
Bordalo et al. (2016). Our sample consists of all equity ETFs that are traded in the U.S.
equity market. As of December 2019, broad-based ETFs manage about $2 trillion, while
thematic products hold about $457 billion. Despite its smaller market share, the thematic
ETF segment generates about 40% of the industry’s revenues. We show that, in the market
for broad-based products, ETFs hold large portfolios and compete on price by offering similar
portfolios at a low cost. In the thematic segment, ETFs hold undiversified and differentiated
portfolios and charge higher fees.3 Corroborating further the evidence of multiple equilibria,
we find a marked difference in the sensitivity of investors’ demand to the cost of holding
the ETF for the two groups of products. Specifically, flows to broad-based ETFs display a
significantly higher sensitivity to fees, whereas flows to thematic ETFs are unrelated to fees
and respond more strongly to positive past performance.
In the second part of our work, we investigate the purpose of thematic ETFs, i.e., we
study the nature of ‘quality competition’ in the ETF space. The obvious conjecture is that
thematic ETFs charge high fees because they are able to generate better performance, for
example, by picking investment styles that will outperform. Our tests show that this is not
the case. In fact, we find that thematic ETFs’ performance is disappointing after adjusting
for their risk exposure. A portfolio of all thematic ETFs earns a negative risk-adjusted
performance of 3.1% per year, after fees. This underperformance is due mostly to newly
launched thematic ETFs, which lose 5% per year in risk-adjusted terms. In comparison, the
performance of broad-based ETFs is slightly negative, however, statistically indistinguishable
from zero. Figure 1 illustrates this result.
We then explore two potential explanations for the severe underperformance of thematic
ETFs that we observe. The first conjecture is that thematic ETFs are used by rational
investors to hedge their exposure to risk factors. According to this interpretation, through
these products, investors obtain insurance for risks to which they are exposed and, for
this reason, they are willing to bear a cost in terms of lower returns. More broadly, this
explanation relates to the view of financial innovation as a way to achieve market completion
(Allen and Gale, 1994; Duffie and Rahi, 1995). Specifically, ETFs can help investors hedge
their positions by offering portfolios of existing securities, which ultimately reduce investors’
transaction and search costs. However, we do not find evidence consistent with an insurance
motive. For example, the portfolio of stocks that are most negatively correlated with the
3
Several studies find that differentiation in portfolio focus exist also in the mutual fund industry (Massa,
1998; Cooper et al., 2005; Kostovetsky and Warner, 2020).
2Figure 1. Performance of ETFs Around Launch
The figure shows the performance of ETFs around launch, split by groups of broad-based and thematic
ETFs. We form 60 calendar-time portfolios that include returns of ETFs in their month +1, +2, . . . , and
+60 since the launch month 0. The portfolio returns are value-weighted using one-month-lagged market
capitalization as weights. To adjust returns for risk factors, we estimate Fama-French-Carhart 6 factor
model (FFC-6) alphas of the portfolios using squared roots of the number of ETFs in each portfolio-month
as weights. The lines represent cumulative FFC-6 alphas of the 60 ETF portfolios and the shaded areas
represent 95% confidence intervals.
0
Cumulative FFC-6 factor alphas (%)
−5
−10
−15
−20
−25
Broad-based ETFs
Thematic ETFs
−30
0 10 20 30 40 50 60
Months relative to ETF launch date
portfolio of all thematic ETFs does not earn abnormally positive returns, which should be
the case if it was a risk factor of hedging concern. While an insurance motive predicts that
investors are expecting low returns, poor performance of thematic ETFs is accompanied
with negative capital flows, suggesting that investors are disappointed by the low returns.
Relatedly, we document that stocks that are included in thematic ETFs experience, after
launch, a steep drop in their media sentiment and earnings surprises relative to the pre-launch
period.
The second explanation is that the demand for thematic ETFs comes from unsophis-
ticated investors who chase investment ideas that, in their view, produce higher expected
returns. Our results are consistent with this interpretation. Newly-launched thematic ETFs
hold portfolios of securities in attention-grabbing segments of the market: these are stocks
that experienced recent price run-ups, had recent media exposure (especially positive expo-
sure), high analyst growth expectations, and in general display traits that were previously-
shown to indicate overvaluation (high market-to-book and high short interest). We also
find evidence of catering to preferences for gambling (Brunnermeier and Parker, 2005; Brun-
nermeier, Gollier, and Parker, 2007; Mitton and Vorkink, 2007; Barberis and Huang, 2008;
Kumar, 2009): thematic ETFs contain securities with relatively more positively-skewed re-
3turns. Moreover, the investor clientele of thematic ETFs has a greater fraction of retail
investors, who are typically considered less sophisticated. Relatedly, thematic ETFs are very
popular among sentiment-driven investors, i.e., those that trade through the online platform
Robinhood, which has become famous in recent years for hosting investment frenzies. Finally,
thematic ETF investors are more prone to positive feedback trading (De Long, Shleifer, Sum-
mers, and Waldmann, 1990). Put together, these results suggest that ETF providers cater to
irrational investors with extrapolative expectations (Barberis and Shleifer, 2003; Greenwood
and Shleifer, 2014; Barberis, Greenwood, Jin, and Shleifer, 2018), i.e., those viewing recent
performance of a security or a sector as representative of its future performance. These in-
vestors also display neglect for the risks that arise from the under-diversification of thematic
portfolios, consistent with the theory of Gennaioli et al. (2012).
Overall, our results provide a new narrative for the evolution of the most transformative
financial innovation of the last three decades. The original ETFs, which are broad-based
products, are beneficial investment platforms, as they reduce transaction costs and provide
diversification. Thematic ETFs ride the same wave of financial innovation. However, these
products appeal to unsophisticated investors who chase past performance and neglect the
risks arising from the under-diversified portfolios. Thematic ETFs, on average, have gener-
ated disappointing performance for their investors.
2 Data
We use data on ETFs traded in the U.S. market from the Center for Research in Security
Prices (CRSP) between 1993 and 2019. We focus on equity ETFs that trade on the U.S. stock
market. This choice allows us to more closely benchmark the ETF portfolios to broad-based
U.S. stock indexes. Therefore, we exclude ETFs that are classified as non-equity, foreign
equity, inverse, or leveraged. The final sample contains 1,086 distinct U.S. equity ETFs
which satisfy all requirements. Appendix A introduces the reader to the mechanics of ETFs.
We provide detailed data sources in Appendix B and variable description in Appendix C.
the
We compute ETFs’ portfolio holdings by combining Thomson Reuters Global Mutual
Fund Ownership and CRSP Mutual Fund Holdings databases. We start with the dataset
that includes holdings information on the earliest date (closest to the launch date). We use
the other dataset to complement missing data when needed.
In addition, we use stock-level data from additional sources: market data from CRSP
and Compustat, analyst expectations from I/B/E/S, firm-level news from RavenPack News
Analytics, 13F institutional ownership data from Thomson Reuters, and Robinhood users
4data from Robintrack.
3 The “Walmarts” and “Starbucks” of the ETF World
3.1 Theoretical Background
The ETF market has developed substantially since the 1990s. To date, in the U.S. alone,
over 3,000 exchange traded funds have been launched, of these, more than 1,000 invest in
U.S. equities. These ETFs differ in the breadth of their holdings (ranging from a few stocks
to over 3,000 stocks) and in the fees that they charge (ranging from 4 bps to over 150 bps
per year). What are the factors that drive the introduction of new products in this space?
Historically, the first ETFs, launched in the mid-1990s, tracked broad-based indexes,
held large portfolios, and charged low fees. These products were viewed as alternative
investment vehicles to index futures contracts. Towards the late 1990s, ETFs were marketed
as alternative investment vehicles to index mutual funds.4 Thematic ETFs became to appear
around the dot.com boom, 1999; they tracked primarily the technology sector and charged
higher fees.
We argue that the observed plethora of ETF products is a result of issuers competing
on investors’ attention through emphasizing either the low price or the product’s unique
features. If consumers’ demand is based on salient features—price or variety—relative to the
incumbent competition, firms would attempt to attract consumers’ attention based on these
features.
Bordalo, Gennaioli, and Shleifer (2016) apply this idea to describe competitive strategies
in product markets and extend their analysis to financial markets, specifically—financial in-
novation. Product markets can gravitate around either i) a price-salient equilibrium, in which
products are commoditized and producers compete on low prices (the “Walmarts”), or ii)
a quality-salient equilibrium in which prices are high and producers differentiate themselves
by offering different product features (the “Starbucks”). Paralleling this market structure,
in financial markets, there are products that improve transaction efficiency, and there are
products that attract investors’ attention to specific features, like high promised returns
(“reaching for yield”), while shrouding risk.
We argue that these two equilibria provide a fitting description of the situation in the
ETF market. The “price” feature is reflected in the fees that ETFs charge. Thus, the
inexpensive and broad-based index tracking ETFs are the commoditized products which
4
For example, Guedj and Huang (2009) explain that ETFs have liquidity advantages over index funds
but tax disadvantages, and therefore may appeal to different clienteles.
5could be mapped to the price-salient equilibrium (the Walmarts of the ETF world). This
group of ETFs appeals to price-conscious investors who seek exposure to an asset class
at the lowest possible cost. Instead, more expensive, less-diversified ETFs are part of the
quality-salient equilibrium (the Starbucks). The latter products are labelled ‘thematic’ in the
ETF world. Investors in these ETFs are less concerned about paying a high price or losing
diversification as long as they can get exposure to their desired themes. In this segment of the
market, ETF issuers attract investors’ attention by designing products that cater investors’
expectations of high future returns.
In this framework, an ETF’s expected return is a measure of product quality, or variety.5
Importantly, some investors may not act rationally when forming expectations about future
returns. For example, investors may suffer from representativeness bias and therefore extrap-
olate past performance to the future (Greenwood and Shleifer, 2014; Barberis et al., 2018).
Catering to this audience, issuers can make the quality characteristic salient by launching
ETFs focusing on segments of the market that experienced superior past performance.
One can extend the notion of “quality” beyond expected return. For example, some
literature suggests that investors have a preference for gambling (Brunnermeier and Parker,
2005; Brunnermeier et al., 2007; Mitton and Vorkink, 2007; Barberis and Huang, 2008;
Kumar, 2009). In this case, issuers would attract investors by offering products with a
positively-skewed payoff profile. Moreover, investors may be wishing to invest in themes
that they fancy, such as responsible and sustainable manufacturing, or firms that comply
with religious values.6 Therefore, new ETFs could cater to this demand by constructing
portfolios around these themes.
3.2 Testable Predictions
The theoretical framework discussed above allows us derive some testable implications.
The predictions of the Bordalo et al. (2016) model can be tested against the traditional
interpretation of financial innovation.
According to the traditional view, financial innovation contributes to complete the mar-
ket, allows investors to achieve a broader set of payoffs (Allen and Gale, 1994; Duffie and
Rahi, 1995). Even though ETFs replicate cash flows profiles of securities that already exist
in the market, they increase the accessibility of these portfolios to investors, by reducing
5
Supporting this view, previous research shows that financial intermediaries tend to emphasize products’
promised headline return salient while shrouding associated risk (Henderson and Pearson, 2011; Célérier and
Vallée, 2017; Vokata, 2020).
6
Some authors argue that an investment that complies with investors’ system of beliefs generates non-
pecuniary benefits in their utility function (as in Fama and French, 2007; Pastor, Stambaugh, and Taylor,
2019).
6search and trading costs. The variety of products coming to the market reflects the hetero-
geneity in investors’ hedging needs. Viewed through this lens, financial innovation responds
to rational investors’ demand and is welfare improving.
The two frameworks converge on the rationale for inexpensive broad-based ETFs. Ac-
cording to the two views, these products fulfill investors’ needs, diversification and hedging,
at a low cost.
The two frameworks, however, differ in the interpretation of the reason for the existence
of thematic ETFs. According to the traditional view, these underdiversified products must
offer benefits to investors as hedging tools.
In contrast, according to the “competition for attention” view, thematic ETFs are de-
signed to attract consumers’ attention to a feature that is different from their price. In
the context of financial innovation, investors’ attention could be attracted by offering access
to a theme that matches their expectations of future performance. If investors have high
sentiment about a specific investment idea, then new ETFs are likely to be launched around
this theme.
Given our empirical setting, we introduce an additional conjecture. Specifically, if there
are limits to arbitrage in the underlying securities’ market, it is plausible that the same
sentiment that props stock prices will be reflected in the demand for ETFs. For example,
investors’ demand for cannabis-related ETFs will be high when cannabis stocks are overval-
ued. Therefore, new thematic ETFs could underperform due to the overvaluation of their
portfolio holdings.
To summarize, the “attention for competition” framework predicts that newly-launched
thematic ETFs focus on attention-grabbing themes. Stocks, in these ETFs are likely to be
overvalued, and therefore these ETFs are likely to deliver negative risk-adjusted performance
that is disappointing for investors. In addition, they are likely to attract unsophisticated
investors.
4 Empirical Analysis: Segmentation in the ETF Space
Now we turn to describing the structure of equity-focused ETFs that are traded in the
U.S. stock market and classify ETFs based on their investment objective: broad-based versus
thematic products. Relying on the commercial data provider Bloomberg, we classify ETFs
as thematic if they invest in a specific industry or track multiple industries that are tied by
a theme.7 The remaining equity ETFs, that lack an industry focus, are classified as broad-
7
In particular, we refer to the Bloomberg field F U N D IN DU ST RY F OCU S. We categorize as thematic
the ETFs for which this field reports the word ‘thematic’ or the name of a specific industry.
7based ETFs. Over the sample period, there are 613 broad-based ETFs and 473 thematic
ETFs. Figure 2 shows time-series evolution of the assets under management (AUM), implied
revenues (percentage fees times AUM), as well as the time series of ETF launches and
closures.
Panels (a) and (b) show that the AUM managed by broad-based ETFs grow exponentially
over the years, whereas the growth of the assets in thematic ETFs is less striking. By the
end of 2019, broad-based ETFs account for about 80% of the assets invested in equity-
based ETFs, and thematic ETFs account for the remaining 20%. Despite their relatively
small share, thematic ETFs account for about a third of the industry’s revenues, and broad-
based ETFs generate two thirds of it (Panel (b)). The disproportionate share of revenues of
thematic ETFs is due to the higher fees that they charge on average (Table 1). Over entire
sample period, broad-based and thematic ETFs generated cumulative revenues of $22.6bn
and $14.6bn, respectively.
Panels (c) and (d) present the time series of ETF launches and closures. In the early
years, most newly-launched ETFs were broad-based. A large batch of thematic ETFs was
launched in 2007, and another on in 2012. The rate of ETF closure is more pronounced for
thematic ETFs.
In Table 1 we present summary statistics for our sample of ETFs. Thematic ETFs hold
significantly larger portfolios that broad-based ETFs do: the median broad-based ETF con-
tains over 200 stocks while the median thematic ETF holds 50 stocks. Broad-based ETFs
charge lower fees than thematic ETFs (compare medians of 37 versus 57 basis points, respec-
tively). These statistics support the conjecture that providers of thematic ETFs compete
on quality by providing portfolios that are concentrated in smaller portions of the market,
hence more risky, while charging a higher management fee for their service.
Two additional pieces of evidence support the view of a market segmented into price and
quality salient equilibria. First, in Figure 3, we plot ETF fees against product differentiation
at two points in time: close to the birth of the industry (2002) and towards the end of our
sample (2019).8 We note that broad-based ETFs tend to charge lower fees and to be more
similar to one another. Based on the size of circles, which capture ETFs’ relative AUM,
we can also conclude that there is more concentration in the broad-based segment of the
market. This is probably a consequence of price competition leading to a winner-takes-all
equilibrium. On the other hand, competition on quality allows differentiated products to
gain market share leading to a more equalized distribution of assets in this segment of the
8
Product differentiation is computed for each category as one minus the cosine similarity between the
ETF portfolio weights and the weights of the portfolio of all ETFs in that category that exist in the market
at that point in time.
8Figure 2. Evolution of the ETF Industry
The figure presents the evolution of the stock-focused ETF industry, split by ETF category. Panel (a) reports
aggregate asset under management and Panel (b) shows implied revenue, computed by sum of fee × AUM.
Panel (c) presents the number of ETF launches and Panel (d) exhibits the number of ETF closures.
(a) Asset under management (b) Total implied revenue
Total implied revenue ($ bn)
2,000 Broad-based ETFs 4 Broad-based ETFs
Thematic ETFs Thematic ETFs
AUM ($ bn)
1,000 2
0 0
1995 2000 2005 2010 2015 2020 1995 2000 2005 2010 2015 2020
(c) Number of ETF launches (d) Number of ETF closures
60
Thematic ETFs Thematic ETFs
100
Number of ETFs
Number of ETFs
Broad-based ETFs Broad-based ETFs
40
50
20
0 0
1995 2000 2005 2010 2015 2020 1995 2000 2005 2010 2015 2020
industry.
Figure 3. Segmentation in the ETF Market
The figure presents the evolution of the ETF market in two distinct points in time. Panel (a) shows a
snapshot as of December 2002 and Panel (b) shows a snapshot as of December 2019. We calculate cosine
similarity between an ETF’s portfolio weights around launch and the aggregate portfolio weights of existing
ETFs in the same category. Product differentiation is computed as 100 × (1 − Cosine similarity). The panels
show the universe of ETFs at each date, by two dimensions: product differentiation and fees. Each bubble
represents one ETF, and the size of the bubbles represents relative share of assets under management across
all ETFs. Blue bubbles represent broad-based ETFs and red bubbles represent thematic ETFs.
(a) Differentiation, Fees, and AUM: 2002 (b) Differentiation, Fees, and AUM: 2019
100 Broad-based ETFs 100
80 Thematic ETFs 80
Fee (bp)
60 60
40 40
20 20
0 0
0 20 40 60 80 100 0 20 40 60 80 100
Product differentiation Product differentiation
9Table 1. ETF Summary Statistics
The table shows summary statistics of ETFs. Panel A reports summary statistics for broad-based ETFs
and Panel B reports summary statistics for thematic ETFs. Number of holdings represents the average
number of stocks in portfolios of ETFs. Fee refers to annual expense ratio. Turnover is the average daily
turnover over the six months since launch. Short interest is the average monthly short interest ratio over
the six months since launch. Abnormal return is computed as ETF returns minus contemporaneous CRSP
value-weighted market returns over the 60 months since launch. Delisted is an indicator for whether the
ETF was liquidated as of the end of 2019. Asset under management (AUM) is the total market value of the
investments in 2019. Implied revenue is calculated by multiplying fee by AUM in 2019.
Panel A: Broad-based ETFs
N Mean SD p5 p25 p50 p75 p95
Number of holdings (at launch) 611 378 479 34 99 213 470 1,398
Fee (bp) 545 44 26 12 25 37 64 87
Turnover (months 1–6; %) 606 2.82 3.25 0.20 0.93 1.95 3.43 8.66
Short interest (months 1–6; %) 473 4.69 10.60 0.03 0.39 1.11 3.77 23.34
Abnormal return (months 1–60; %) 613 −0.19 0.46 −0.93 −0.34 −0.12 0.04 0.33
Delisted 613 0.27 0.44 0 0 0 1 1
2019 statistics
Asset under management ($bn) 453 4.53 20.66 0.00 0.05 0.20 1.32 19.77
Implied revenue ($m) 406 9.63 34.66 0.03 0.23 0.94 5.16 49.72
Panel B: Thematic ETFs
N Mean SD p5 p25 p50 p75 p95
Number of holdings (at launch) 463 83 85 21 33 50 95 254
Fee (bp) 407 54 20 18 37 57 69 85
Turnover (months 1–6; %) 473 3.95 6.64 0.37 1.11 2.17 4.28 13.20
Short interest (months 1–6; %) 363 7.34 15.88 0.11 0.60 1.66 6.50 33.11
Abnormal return (months 1–60; %) 473 −0.44 1.47 −1.99 −0.69 −0.20 0.24 0.80
Delisted (%) 473 0.30 0.46 0 0 0 1 1
2019 statistics
Asset under management ($bn) 336 1.36 3.81 0.01 0.04 0.19 0.91 6.81
Implied revenue ($m) 314 6.62 17.53 0.03 0.27 1.05 4.79 27.94
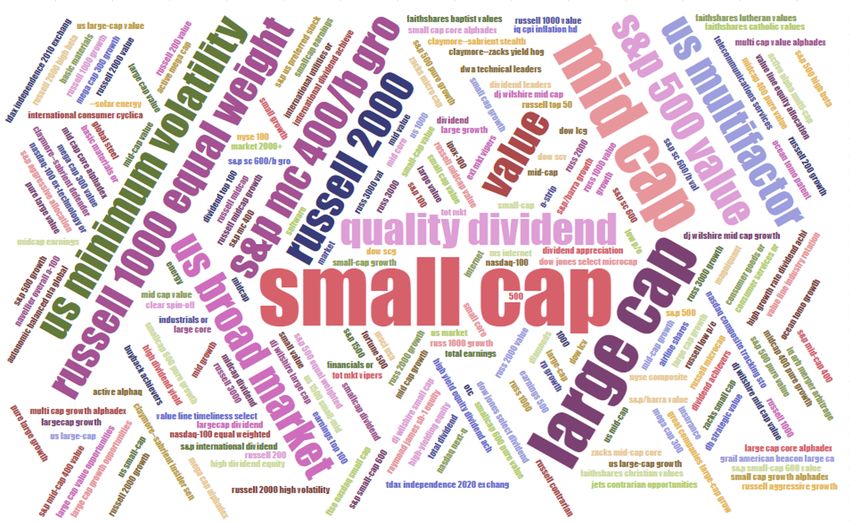
The second piece of evidence provides a consistent view on the product differentiation
strategies in the two segments of the market. We use the names of ETFs products to form
word clouds, presented in Appendix Figure A.I. These clouds show that names of broad-based
ETFs include repeating terms, related to general index names, e.g., S&P 500, Russell 1000,
etc. In contrast, the cloud that uses thematic ETF names is composed of many more terms,
with lower frequency. It includes industry and thematic words, like healthcare, information,
and cannabis.
Another way to demonstrate the segmentation in the ETF market is by studying the
product features that attract investor demand. In Table 2, we report estimates from regres-
sions of monthly capital flows into each ETF, a proxy for demand, on product characteristics.
In particular, we focus on fees, as a measure of price, and on past returns, which approximate
10expected returns for investors with extrapolative beliefs and, in this sense, are a measure of
quality. The results in the table suggest that investors in broad-based ETFs pay more atten-
tion to price than investors in thematic products as their sensitivity to fees is significantly
more negative.
Table 2. ETF Flow Sensitivity to Fee and Past Performance
The table presents the flow sensitivity of ETFs to their fee and past performance. The dependent variable
is ETF flows in month t + 1, computed as 100 × (AUMt+1 − AUMt × ETF returnt+1 )/AUMt . In each month
t, we calculate percentile ranking of ETF returns. Thematic is a dummy variable, taking the value of 1 if
an ETF is the thematic ETF. AUM is an ETF’s asset under management ($m) in month t and Age is an
ETF’s age in months. The first three columns report results with panel regressions with year fixed effects.
Standard errors are clustered at the ETF and the calendar-month levels. The last three columns report
monthly Fama-MacBeth regression results. t-statistics are reported in parentheses.
Dependent variable: Flowst (%)
Panel regression Fama-MacBeth
Sample period: 2000–2019 2000–2009 2010–2019 2000–2019 2000–2009 2010–2019
Return rankingt−1 0.04*** 0.03*** 0.04*** 0.04** 0.03 0.04***
(10.01) (3.72) (9.55) (2.30) (0.94) (12.54)
Return rankingt−1 × Thematic 0.02*** 0.02 0.02*** 0.00 −0.01 0.01***
(3.03) (1.38) (3.03) (0.07) (−0.29) (2.81)
Fee (bp) −0.05*** −0.14*** −0.03*** −0.36** −0.68** −0.03***
(−6.50) (−3.80) (−6.21) (−2.46) (−2.38) (−6.01)
Fee × Thematic 0.02*** 0.04 0.02*** 0.33** 0.63** 0.02***
(2.72) (1.07) (2.93) (2.23) (2.18) (2.83)
Thematic −1.57** −1.42 −1.69*** −8.49** −15.63** −1.29***
(−2.57) (−0.60) (−3.47) (−2.19) (−2.04) (−2.94)
log(AUMt−1 ) −0.25** −1.57*** −0.02 −1.43** −2.90** 0.05
(−2.54) (−2.82) (−0.27) (−2.41) (−2.49) (0.87)
log(Aget−1 ) −2.07*** −1.44* −2.19*** −0.07 2.39 −2.54***
(−11.15) (−1.90) (−12.70) (−0.07) (1.38) (−15.72)
Year FE Yes Yes Yes No No No
Observations 81,094 17,907 63,187 81,094 17,907 63,187
Adj R2 0.045 0.037 0.054 0.130 0.175 0.086
In Figure 4 we examine the flow-performance sensitivity for broad-based and thematic
ETFs around launch. We identify new ETFs that have been launched within the previous
five years. In each month t, we compute next period flows as 100 × (AUMt+1 − AUMt ×
ETF returnt+1 )/AUMt . Then, We estimate a non-parametric relation between flows and
returns using local polynomials.
Both the table and figure show that ETFs investors chase past returns deferentially
in broad-based and thematic ETFs. Dannhauser and Pontiff (2019) have document return
chasing in ETFs in general, however, here we find that the sensitivity of flows to past returns
11Figure 4. Flow-Performance Sensitivity
The figure presents flow-performance sensitivity of ETFs around launch, per ETF category. We identify new
ETFs that have been launched within the previous five years. Flows are computed as 100 × (AUMt+1 −
AUMt ×ETF returnt+1 )/AUMt . Returns are ETF returns minus CRSP value-weighted returns. We estimate
a non-parametric relation between flows and returns using local polynomials. The shaded areas represent
95% confidence intervals.
Broad-based ETFs
4% Thematic ETFs
2%
Flowt+1 (%)
0%
−2%
−12% −6% 0% 6% 12%
Returnt (%)
is significantly higher for thematic ETFs, consistent with more attention to quality in this
segment of the market.
The greater variety in themes in the thematic segment of the ETF industry reflects
the heterogeneity in investors’ interests. The fact that thematic ETFs can charge higher
fees allows niche ETFs to appeal to smaller crowds. This assertion is confirmed by the
distribution of estimated annual reviews (fees times average AUM), in Table 1. The table
shows that the distribution of revenues generated by broad-based ETFs largely matches that
of thematic ETFs. For example, for both types of ETFs, the median revenue is about $0.7m
and 75th percentile revenues is just above $3m for both groups. The main difference between
the groups is in the extreme right tail, where the large broad-based ETFs (like State Street’s
SPDR tracking the S&P 500 index) pull higher revenues due to their sheer size.
5 The “Quality” of Thematic ETFs
Understanding the ETF market structure requires understanding the drivers of demand
for ETFs. As discussed earlier, it seems uncontroversial that broad-based ETFs offer diversi-
fication at a low cost. For instance, instead of trading the 500 individual stocks that belong
to the S&P 500, an investor could trade a single ETF tracking the index. Broad-based ETFs,
12therefore, reduce transaction costs and help investors acquire a diversified portfolio.
In contrast to the clear value created by broad-based ETFs, the case for value creation
by thematic ETFs is less obvious. Given the high fees that investors are willing to pay to
invest in these products, the first conjecture that we make is that investors are rational and
that they benefit from investing in thematic ETFs along some dimension.
The first possibility that we entertain is that thematic ETFs deliver superior performance.
Under this conjecture, the rationale for investing in high-fee ETFs is simply to achieve
positive risk-adjusted returns (i.e., alpha). Thematic ETFs, therefore, provide a low-cost
tool for accessing these investment ideas.
The second possibility is that thematic ETFs create value by providing hedging against
some risks which investors care about. In other words, these products operate like an insur-
ance policy. For this reason, their risk adjusted performance does not have to be positive,
to the extent that it negatively correlates with some risk factor that is of hedging concern
to investors.
Thus, the first test that discriminates between the two conjectures relies on measuring
the risk adjusted performance of thematic ETFs. We do that in the next subsection.
5.1 The Performance of Thematic ETFs
To measure the performance of thematic ETFs, we use a standard approach in the asset
pricing literature. We form a monthly portfolio that holds all the available ETFs in the
market. We separately consider the universes of broad-based and thematic products. The
portfolios are reformed each month and are either equally- or market-capitalization-weighted.
Then, we run regressions of the returns9 of these portfolios in excess of the risk free rate on
commonly-used risk factors,10 as is customary in the asset pricing literature.
In Table 3, we present the intercept from these regressions, which reflects the risk-adjusted
performance of the portfolios, and is commonly labeled ‘alpha.’ The table shows that the-
matic ETFs persistently generate negative alpha of about −3% per year for Fama-French-
Carhart 4 factors (i.e., −0.26% × 12). Underperformance is closer to zero (but still negative)
when using more elaborate factor models. The underperformance cannot be attributed to
the high fees (0.54% on average; see Table 1). In comparison, broad-based ETFs generate
negative alpha of about −0.72% a year, using the same risk model, which is closer to the
fees they charge.
9
ETF returns are net of fees.
10
Risk factors returns are downloaded from Professor French’s website: https://mba.tuck.dartmouth.
edu/pages/faculty/ken.french/data_library.html and Professors Hou, Xue, and Zhang’s website:
http://global-q.org/factors.html.
13Table 3. Calendar-Time Portfolios of ETFs
The table presents risk-adjusted performance of ETFs from 2000 to 2019. In Panel (A), we form portfolios
consisting of all ETFs in the same category. In Panel (B), we identify new ETFs that have been launched
within the previous five years in each month, per ETF category. Then we form portfolios consisting of all
new ETFs in the same category. In Panel (C), we identify old ETFs that have been launched more than five
years ago in each month, per ETF category. Then we form portfolios consisting of all old ETFs in the same
category. The portfolio returns are value-weighted using one-month-lagged market capitalization as weights.
Excess return refers to average monthly return in excess of risk-free rate. CAPM, FF3, FFC4, FF5, FFC6,
and Q denote alphas with respect to CAPM, Fama-French 3-factor model, Fama-French-Carhart 4-factor
model, Fama-French 5-factor model, Fama-French-Carhart 6-factor model, and Q-factor model respectively.
The remaining columns report alphas using various asset pricing models. The portfolios of all broad-based
(thematic) ETFs include 182 (180) ETFs on average. TH minus BB denotes thematic ETF portfolio minus
broad-based ETFs portfolio. The alphas are in percentage points and t-statistics are reported in parentheses.
*, **, and *** indicate significance at the 10%, 5%, and 1% levels, respectively.
Panel A: All Months
Excess return CAPM FF3 FFC4 FF5 FFC6 Q
Broad−Based ETFs 0.62** −0.08** −0.07** −0.06* −0.02 −0.02 −0.02
(2.20) (−2.29) (−2.22) (−1.83) (−0.70) (−0.55) (−0.47)
Thematic ETFs 0.42 −0.26*** −0.27*** −0.26*** −0.16* −0.15* −0.14
(1.41) (−3.19) (−3.27) (−3.09) (−1.85) (−1.81) (−1.65)
TH minus BB −0.18** −0.19*** −0.20*** −0.20*** −0.14* −0.14* −0.13*
(−2.33) (−2.67) (−2.74) (−2.71) (−1.81) (−1.82) (−1.69)
Panel B: Months ≤ 60
Excess return CAPM FF3 FFC4 FF5 FFC6 Q
Broad−Based ETFs 0.44 −0.19** −0.19** −0.14 0.02 0.03 −0.00
(1.49) (−2.04) (−2.02) (−1.59) (0.23) (0.40) (−0.01)
Thematic ETFs 0.10 −0.51*** −0.52*** −0.50*** −0.36** −0.36** −0.34**
(0.28) (−3.75) (−3.85) (−3.61) (−2.49) (−2.47) (−2.40)
TH minus BB −0.25 −0.32** −0.32** −0.35** −0.42** −0.43** −0.37**
(−1.64) (−2.05) (−2.07) (−2.19) (−2.48) (−2.50) (−2.21)
Panel C: Months > 60
Excess return CAPM FF3 FFC4 FF5 FFC6 Q
Broad−Based ETFs 0.79*** −0.04* −0.03 −0.03 −0.06*** −0.06** −0.05*
(2.79) (−1.67) (−1.26) (−1.19) (−2.66) (−2.58) (−1.96)
Thematic ETFs 0.67** −0.17** −0.17** −0.17** −0.16* −0.16* −0.12
(2.32) (−2.14) (−2.15) (−2.12) (−1.91) (−1.88) (−1.41)
TH minus BB −0.08 −0.12* −0.14** −0.14* −0.11 −0.11 −0.08
(−1.14) (−1.75) (−2.01) (−1.97) (−1.53) (−1.49) (−1.11)
To summarize, this analysis suggests that thematic ETFs do not create value for their
investors by providing outperforming investment strategies. Hence, the high fees and lack of
diversification of these products remain a puzzle. For this reason, we entertain more closely
the hypothesis that thematic ETFs provide insurance against some risk factors.
145.2 Hedging Properties of Thematic ETFs
Our results suggest that thematic ETFs deliver negative risk-adjusted performance, on
average. To explain investors’ demand for these products in spite of their underperformance,
we conjecture that thematic ETFs deliver value as a form of insurance. In the asset-pricing
language, it is possible that our earlier tests fail to capture some unobserved risk factor that
rational investors care about. Thematic ETFs might be the right vehicle that allows these
investors to hedge against this unobserved risk factor. For this reason, investors are willing
to accept lower returns.
The implication of this conjecture is that the performance of thematic ETFs has a nega-
tive correlation with a portfolio of assets that rational investors dislike, i.e., a portfolio that
pays a positive risk premium. To test this prediction, we construct a portfolio of stocks
that have negative correlation with the portfolio of all thematic ETFs. In more detail, every
month, we sort stocks based on their beta on the excess return of the market-capitalization-
weighted portfolio of thematic ETFs. The beta is estimated using 60-month-rolling-window
regressions, requiring each stock to have at least 36 months observations with returns. Then,
we form five portfolios corresponding to the quintiles of the estimated betas. Portfolio 1 (5)
has the stocks with the lowest (highest) correlation with the thematic portfolio.
Table 4 reports the alphas from regressions of these portfolios’ returns on different factor
models. We also report the estimates of alpha for the portfolio that is long low-thematic-beta
and short high-thematic-beta stocks (i.e., quintiles 1 minus 5), which mimics the factor for
which thematic ETFs should provide insurance.
In no specification are the alphas of low-thematic-beta stocks consistent with a positive
risk premium. In particular, the long-short portfolio delivers insignificant alphas. This
evidence, therefore, does not support the conjecture that thematic ETFs provide hedging
for an underlying risk factor.
Another way to investigate whether investors hold thematic ETFs for hedging purposes
is to study investors’ loyalty to these products as they experience negative performance.
Specifically, if the negative performance of thematic ETFs reflects an insurance premium,
investors should not be disappointed, and they should stick with them in spite of the low
returns.
To shed light on investor behavior, in Table 5, we study investor capital flows over the
life of an ETF. We ask whether investors’ likelihood to put new money into thematic ETFs
changes over the life cycle of the product. Because there can be life-cycle patterns in flows
that do not depend on the performance of the product, we benchmark thematic products
to the broad-based ones. The estimates suggest that investors are very enthusiastic about
thematic ETFs at their inception, as they are more likely to put money in these products
15Table 4. Hedging Motive
The table presents risk-adjusted monthly performance of stocks from 2000 to 2019, per loading on the
thematic ETFs portfolio returns. In each month, we sort stocks based on their beta on the excess return
of the market-capitalization-weighted portfolio of thematic ETFs. The beta is estimated using 60-month-
rolling-window regressions, requiring each stock to have at least 36 months observations with returns. Then,
we form five portfolios corresponding to the quintiles of the estimated betas. Portfolio Q1 (Q5) has the
stocks with the lowest (highest) correlation with the thematic portfolio. The alphas are in percentage points
and t-statistics are reported in parentheses. *, **, and *** indicate significance at the 10%, 5%, and 1%
levels, respectively.
Exposure to thematic ETFs: Low Q2 Q3 Q4 High Q5−Q1
CAPM alpha -0.04 0.02 0.13** -0.07 -0.32 -0.28
(-0.24) (0.31) (2.00) (-0.81) (-1.48) (-0.80)
FF3 alpha 0.06 0.03 0.11* -0.09 -0.34* -0.40
(0.47) (0.40) (1.68) (-1.07) (-1.67) (-1.37)
FFC4 alpha 0.07 0.03 0.11 -0.09 -0.35* -0.42
(0.53) (0.49) (1.65) (-1.05) (-1.72) (-1.43)
FF5 alpha 0.14 0.01 0.08 -0.03 -0.25 -0.39
(1.08) (0.11) (1.24) (-0.43) (-1.28) (-1.38)
FF6 alpha 0.15 0.01 0.08 -0.03 -0.26 -0.41
(1.10) (0.18) (1.24) (-0.41) (-1.31) (-1.42)
Q alpha 0.02 0.02 0.10 -0.06 -0.24 -0.27
(0.13) (0.21) (1.54) (-0.67) (-1.11) (-0.75)
than in broad-based ones in the early stages of their life cycle (i.e., the positive slope on the
thematic dummy). However, as time passes, investors are also more likely to lose affection for
thematic products (i.e., the negative slope on the interaction between age and the thematic
dummy). This disenchantment manifests itself soon enough after the inception of the ETFs,
as suggested by the estimates in the second column, where we condition on less-than-five-
year-old ETFs. We interpret these results as suggestive of investor disappointment following
the poor performance of thematic products.
Overall, the evidence in this subsection does not support the conjecture that investors
purchase thematic ETFs for insurance purposes. We, therefore, turn to a different hypothesis
to explain the demand for thematic products. The results in Table 5 reveal that these
products attract a lot of investor interest around their inception. This finding may indicate
that they are launched at times of positive investor sentiment for a specific investment style.
Therefore, in the next section, we investigate the hypothesis that the issuance of thematic
ETFs responds to the demand for trendy investment themes.
16Table 5. Disappointment in Flows
The table presents flow dynamics of ETFs since launch, per ETF category. The dependent variable is
a dummy variable, taking the value of 1 if a flow is positive. ETF flows in month t + 1 are defined as
100 × (AUMt+1 − AUMt × ETF returnt+1 )/AUMt . Thematic is a dummy variable, taking the value of 1 if
an ETF is the thematic ETF. log(Age) is the ETF’s logged age (in months). The first column reports results
using the full sample from 2000 to 2019 and the second column reports results with new ETFs that have
been launched in the previous five years. Standard errors are clustered at the ETF and the calendar-month
levels and t-statistics are reported in parentheses.
Dependent variable: Positive flow dummy
Sample: Full Sample Age ≤ 60 months
Thematic 0.08*** 0.06***
(3.73) (2.66)
log(Age) −0.06*** −0.05***
(−10.71) (−9.09)
Thematic × log(Age) −0.03*** −0.03***
(−5.96) (−3.85)
Year FE Yes Yes
Observations 86,715 46,612
R2 0.040 0.023
6 Do Thematic ETFs Cater to Investor Sentiment?
The hypothesis that we test in this section is that thematic ETFs are launched in response
to investors’ demand that is driven by sentiment as opposed to rational expectations. In
other words, some investors have demand for securities in trendy industries or themes. ETF
providers identify the current popular trends in the market and design ETF portfolios that
satisfy this demand. A similar pattern was documented in the mutual fund industry, in
which funds changed their names in order to attract sentiment-driven flows in the late 1990s
(Cooper et al., 2005).
Several predictions arise from this conjecture. First, if thematic ETFs ride recent trends,
then the securities that they hold in their portfolios should (i) have attracted investors’
attention and (ii) display traits of overvaluation (indicative of positive sentiment). Second,
since this overvaluation should at some point revert, thematic ETFs should have disappoint-
ing performance after their launch. Finally, investors in thematic ETFs are likely to be
unsophisticated and sentiment-prone.
In what follows, we test these predictions.
176.1 Characteristics of the Holdings of Thematic ETFs
To understand whether the launch of ETFs caters to investor sentiment, we analyze the
characteristics of the stocks in the ETF portfolios at the time of the launch for thematic
and broad-based products. We focus on several characteristics that could imply heightened
investor attention and overvaluation.
For each stock in an ETF portfolio, we measure a relevant characteristic in the two-year
period before the launch. Then, we compute the value-weighted average characteristic at
the ETF level at the time of launch. Table 6 compares the average ETF-level characteristic
for thematic and broad-based portfolios.
The table shows that stocks included in the portfolios of thematic ETFs were recently
under the spotlight. Relative to broad-based portfolios, stocks in thematic ETFs experienced
higher past market-adjusted returns, higher media exposure, with positive sentiment, and
larger earnings surprises. Overall, thematic stocks experience more positive market sentiment
before the launch of the ETF.
Incidentally, we note that also the stocks in broad-based products experience positive
pre-launch returns. This finding raises the possibilities that the sets of broad-based and
thematic products are not entirely disjoint or, more likely, that the product classification
into broad-based and thematic ETFs is necessarily an approximation.11
The fact that stocks in thematic ETFs display high past returns makes them attrac-
tive to unsophisticated investors with extrapolative believes (Greenwood and Shleifer, 2014;
Barberis et al., 2018). Moreover, thematic stocks display more positive skewness, which is
appealing for investors who have preference for gambling (Brunnermeier and Parker, 2005;
Brunnermeier et al., 2007; Mitton and Vorkink, 2007; Barberis and Huang, 2008; Kumar,
2009).
Table 6 also suggests that thematic ETFs hold glamour stocks that are likely to be
overvalued (Lakonishok, Shleifer, and Vishny, 1994). Specifically, stocks in thematic ETFs
have a high market-to-book ratio and high short interest. These characteristics are typically
associated with lower future returns (Daniel and Titman, 1997; Boehmer, Jones, and Zhang,
2008; Ben-David, Drake, and Roulstone, 2015).
Overall, the characteristics of the securities included in the portfolios of thematic ETFs
indicate that they are ‘hot’ stocks. This evidence is also consistent with a causal observation
of ETF launches in recent times. In 2019, for example, the new ETFs included products
11
For example, smart beta ETFs are classified as broad-based since they do not have a theme- or a sector-
focus. These ETFs hold, on average, stock that outperformed in the pre-launch period. Going forward,
these funds generate zero alpha. See an analysis of the performance of smart beta stocks in (Huang, Song,
and Xiang, 2020).
18focusing on cannabis, cyber security, and video games. In 2020, new thematic ETFs covered
stocks related to the Black Lives Matter movement, COVID-19 vaccine, and the work-from-
home trend.
Table 6. Portfolio Characteristics of ETFs Around Launch
The table shows portfolio characteristics of ETFs prior to their launch dates. For each characteristic of
interest, we construct an ETF-month-level time series of the characteristic from month −24 to month −6
using an ETF’s initial portfolio weights in the launch month 0. Then we calculate the average of the
characteristic across all ETFs in the same category. We report mean and t-test results. Abnormal return
represents returns in excess of CRSP value-weighted market returns. Return skewness is the skewness of
monthly returns following Ghysels et al. (2016). We use the 25th and 75th percentiles as cutoffs. Media
exposure is the number of monthly news articles scaled by market capitalization. Media sentiment is the
sum of composite sentiment scores from the RavenPack scaled by market capitalization. Regarding the two
media-related variables, we subtract the median in each month to purge out time components. Earning
surprise denotes average EPS surprise scaled by one-quarter-lagged stock price. In each year, we standardize
the earning surprise variable. Market-to-book is market equity divided by book equity. Short interest is the
monthly short interest ratio. We subtract median of the short interest ratio in each month to purge out time
components. t-statistics are reported in parentheses. *, **, and *** indicate significance at the 10%, 5%,
and 1% levels, respectively.
Broad-based ETFs Thematic ETFs Difference
Abnormal return 0.67 1.08 0.41***
(7.19) (5.67) (4.27)
Return skewness 0.02 0.17 0.14***
(0.35) (3.08) (3.62)
Media exposure −0.05 30.73 30.79***
(−0.02) (2.82) (3.42)
Media sentiment 0.26 0.62 0.36***
(4.25) (3.40) (3.32)
Earning surprise 0.02 0.03 0.01***
(4.59) (7.29) (2.79)
Market-to-book 1.93 2.04 0.11**
(25.27) (20.08) (2.20)
Short interest (%) 0.02 0.03 0.01**
(20.63) (14.77) (3.71)
Further evidence of excessive optimism around thematic stocks comes from Figure 5. We
find that thematic stocks enjoy more positive media sentiment (Panel A), consistent with
Table 6, and positive earnings surprises (Panel B), which are also likely to feed positive
investor sentiment. Second, the figure shows that the positive sentiment around thematic
stocks quickly reverts in the year after launch. This quick reversal of the initial hype suggests
that the underperformance that we observe for thematic ETFs should materialize soon after
the launch. In what follows, we study this conjecture.
19Figure 5. Dynamics of ETF Portfolio Characteristics
The figure presents characteristics dynamics of ETFs, per ETF category. Panel (a) reports the dynamics
of media sentiment and Panel (b) reports the dynamics of earning surprise. For each characteristic of
interest, we construct an ETF-month-level time series of the characteristic from month −24 to month 24
using an ETF’s portfolio weights. In the pre-launch periods, we use the ETF’s initial portfolio weights in the
launch month 0. In the post-launch periods, we use one-month-lagged portfolio weights. Then we calculate
the average of the characteristic across all ETFs before and after launch, per ETF category. Bar charts
represent average characteristics and error bars represent 1.96 standard error confidence intervals.
(a) Abnormal return (%) (b) Media sentiment
Broad-based ETFs 0.8
1
Abnormal return
Thematic ETFs
Media sentiment
0.6
0.5
0.4
0
0.2
−0.5
−24 ≤ Month ≤ −1 1 ≤ Month ≤ 24 −24 ≤ Month ≤ −1 1 ≤ Month ≤ 24
6.2 Performance After Launch
To investigate the performance dynamics of broad-based and thematic ETFs, we focus
on the first five years after launch. As in subsection 5.1, we use the calendar-time portfolio
approach and estimate risk-adjusted returns (alphas). In greater detail, we form calendar
time portfolios that hold all the ETFs in each of the two categories that were launched in the
prior five years. Each month, new ETFs that are just launched enter the portfolio and ETFs
that are delisted or were launched earlier than five years are removed from the portfolio.
The ETFs in the portfolios are weighted by their lagged AUMs.
Table 3 reports the estimates. Similar to our previous findings, Panel A of Table 3 shows
that thematic ETFs display negative risk-adjusted performance. Moreover, the performance
of thematic ETFs is significantly lower than that of broad-based products. Importantly,
the new evidence is that this underperformance is concentrated in the five-year period after
launch. For completeness, Panel B shows that, after the first five years, the risk-adjusted
performance, while still negative, is substantially closer to zero.
Figure 1 in the Introduction provides a graphical description of this evidence. In this
setting, each point in the chart is produced by one regression. The alpha associated with
month one, for example, is produced from a regression on the performance of a portfolio that
includes all the ETFs existed for only one month; the alpha associated with month two, is
produced by a portfolio that includes ETFs that have two-month life; we repeat the process
20Figure 6. Performance of ETFs, Split by Pre-launch Stock Characteristics
The figure presents Fama-French-Carhart 6 factor model (FFC-6) alphas of the portfolios of ETFs from
2000 to 2019, split by ETF categories and stock characteristics groups. In Panel (a), we split each ETF
category into two groups by past abnormal returns and in Panel (b) we split each ETF category into two
groups by past media sentiment as in Table 6. For each month, we identify new ETFs that have been
launched within the previous five years, per ETF category and stock characteristic group. Then we form
a portfolio consisting of all new ETF in the same category. The portfolio returns are value-weighted using
one-month-lagged market capitalization as weights. To adjust returns for risk factors, we estimate Fama-
French-Carhart 6 factor model (FFC-6) alphas of the portfolios using squared roots of the number of ETFs
in each portfolio-month as weights. The alphas are in percentage points. Error bars represent 1.96 standard
error confidence intervals.
(a) FFC-6 alphas, split by past returns (b) FFC-6 alphas, split by media sentiment
FFC-6 factor alpha (%)
0 0
−0.2 −0.2
−0.4 −0.4
Low past returns Low media sentiment
−0.6 High past returns −0.6 High media sentiment
Broad-based ETFs Thematic ETFs Broad-based ETFs Thematic ETFs
up to the 60-month-life span.12
Using a similar approach, we can support the claim that the characteristics in Table 6
capture overvaluation of thematic ETFs. Specifically, in Figure 6, we further split ETFs
based on whether the average characteristic in the portfolio is above or below the median.
The figure shows that portfolios of the thematic ETFs scoring high on the metrics of investor
attention and sentiment display more negative performance after launch.
Overall, our results show that thematic ETFs start underperforming right after launch.
Given that the pre-launch performance of the underlying portfolios of these ETFs as well as
the attention that they attract are high, the negative post-launch alpha suggests that the
launch of thematic ETFs occurs near the peak of valuation for the underlying securities. In
order words, it appears that ETF providers cater to sentiment-driven demand for investment
themes.
6.3 Who Invests in Thematic ETFs?
To bring further evidence that ETF providers cater to unsophisticated investors, in the
last part of our analysis, we study the investor clienteles in the two categories of ETFs. We
12
We also verify that our results are not driven by ETFs that hold foreign stocks. In Appendix Table A.I,
we restrict the sample of thematic ETFs to those that includes at least 80% of their market cap invested in
stocks traded in the U.S. The results of the analysis are similar to those reported in Figure 1.
21You can also read