Computers in Human Behavior
←
→
Page content transcription
If your browser does not render page correctly, please read the page content below
Computers in Human Behavior 114 (2021) 106558
Contents lists available at ScienceDirect
Computers in Human Behavior
journal homepage: http://www.elsevier.com/locate/comphumbeh
Gender variability in E-learning utility essentials: Evidence from a
multi-generational higher education cohort
David Eshun Yawson a, *, Fred Amofa Yamoah b
a
Business School, Ghana Institute of Management and Public Administration (GIMPA), Ghana Dept. of Management, P.O. Box AH 50, Achimota, Accra, Ghana
b
Birkbeck University of London, Malet Street, Bloomsbury, London, WC1E 7HX, UK
A R T I C L E I N F O A B S T R A C T
Keywords: The paper reports a quantitative investigation into the nuances of gender perspectives of E-Learning utility across
Multi-generations the social categorisations of Generation X, Y, and Z in the current phenomena of accelerated usage of e-learning
Gender variability in the emerging multi-generational undergraduate cohorts: using multi-generational undergraduate cohorts (N
E-Learning utility
= 611) taking a mandatory online course in a Business School curricular. Using multi-group partial least-squares
Multi-group analysis
Undergraduate E-learning courses
analysis, the study shows differences exist in the utility of e-learning within gender and Generations of X, Y, and
E-Learning user-satisfaction utility Z. These differences may not be apparent when examined at only the gender level, which has led other re
searchers to conclude the gender gap is narrowing. However, we establish that within gender and across gen
erations in a developing country context, the gender divide is not narrowing at the same pace as found in other
developed countries. To accelerate the implementation of e-learning in traditional (face-to-face) undergraduate
programmes globally, there is the need to contextualise Course Development, Learner Support, Assessment, and
User Characteristics factors along with the different genders, and across generations to improve Results
Demonstrability and Student Overall Satisfaction of utility of e-learning. In developing countries, there is a need
to enhance Institutional factors to strengthen the drive to e-learning.
1. Introduction Ramírez-Correa et al., 2015) with Shaw and Grant (2002) arguing that
the gender gap is closing. On the other hand, Kolb and Kolb (2005) and
The drive for Higher Educations Institutions (HEIs) to employ E- Seters et al. (2012) posit that there are differences in learning styles.
Learning Management Systems due to restrictions of human movement Thirdly, is the initial emergence of multiple generations of students in
to manage a global pandemic has brought to the fore some critical im the traditional undergraduate cohort degree-awarding programmes
peratives. First and foremost is the rapid deployment of these E-Learning (Giunta, 2017) with known distinct identities (Howe & Strauss, 2003;
systems in traditional face-to-face delivered degree-awarding pro McCuskey, 2020; Sandeen, 2008) and characteristics (Coomes &
grammes. This phenomenon has necessitated shortened decision- DeBard, 2004; Seters et al., 2012) that depicts their learning styles
making times required for deployment of the E-Learning Systems, (Williams, Matt & O’Reilly, 2014; Kolb & Kolb, 2005). However, these
making it critical to interrogate all the necessary factors of utility es emerging phenomena and their imperatives have not been studied.
sentials by those who are to use these systems to improve satisfaction Research on gender and E-Learning has generally been a comparison
and success (Al-Fraihat et al., 2020). Secondly, Adamus et al. (2009) between males and females as individual groups (Ramirez-Correa et al.,
have argued that computer culture and the internet have been tradi 2015; González-Gómez, Guardiola, Rodríguez, & Alonso, 2012; Cua
tionally associated with men. In line with this argument, Cua drado-García et al., 2010; Bruestle et al., 2009; Price, 2006; Rovai &
drado-García et al. (2010) has argued that males and females do not Baker, 2005), whereas literature on birth generations have mainly dealt
make use of technology in the same ways or at the same levels of with student and faculty generational learning (Tisdell et al., 2004).
expertise or experience and that men more likely than women do use Also, most studies examined generations as a group (Giunta, 2017; Dong
online media while women are more likely than men to express a lower & Zhang, 2011; Koutropoulos, 2011; Sandeen, 2008; Howe & Strauss,
overall proficiency with computers. The outcome of this debate has been 2000, 2003). Carpenter et al. (2012) report that the strand of literature
mixed in the literature (Bruestle et al., 2009; Dorman, 1998; Price, 2006; comparing multiple generational cohorts is rare. However, these
* Corresponding author. Business School, Ghana Institute of Management and Public Administration (GIMPA), P.O. Box AH 50, Achimota, Accra, Ghana.
E-mail addresses: dyawson@gimpa.edu.gh (D. Eshun Yawson), f.yamoah@bbk.ac.uk (F. Amofa Yamoah).
https://doi.org/10.1016/j.chb.2020.106558
Received 15 July 2020; Received in revised form 30 August 2020; Accepted 7 September 2020
Available online 8 September 2020
0747-5632/© 2020 Published by Elsevier Ltd.
D. Eshun Yawson and F. Amofa Yamoah Computers in Human Behavior 114 (2021) 106558
segregated lines of inquiry have created a gap in research on how gender intentional integration of traditional (i.e., face-to-face) and E-Learning
issues differ across generations and whether there are differences among to provide educational opportunities that maximize the benefits of each
the various generations of a particular gender. This study, therefore, platform to effectively facilitate student learning. This, they suggest,
explores how the utility of E-Learning differ across gender, generations, offers students flexibility, as well as convenience, supporting the
and among various generations of a particular gender. blending of different times and places for learning. This evolution,
In exploring this gap, we identify that E-Learning literature has a however, has been accelerated by current happenings in the global
wide agreement that user satisfaction is an attitude held by individual environment, necessitating the evaluation of these systems to ensure
users (Thong & Yap, 1996), for which Remenyi and Money (1991, successful delivery, effective use, and positive impacts on learners.
p.163) defined as "a measure of the discrepancy between a user’s ex The literature, has it that the notion of gender differences has
pectations about a specific information system compared to the fascinated people for years, and in general, it has been believed that
perceived performance of the system". The use of user-satisfaction is these differences are large and immutable (Bruestle et al., 2009; Cua
recognized by many IT researchers as an appropriate surrogate for IT drado-García et al., 2010; González-Gómez et al., 2012; Price, 2006;
effectiveness (Remenyi & Money, 1991). Also, the literature on birth Ramírez-Correa et al., 2015). While gender differences have been re
generations argues that birth generation is an important variable as a ported concerning learning (Williams et al., 2014; Kolb & Kolb, 2005),
social construct that categorises people into birth cohorts (Howe & some studies suggest that these differences remain in other areas of
Strauss, 1993), with differences in values, needs, preferences, and be learning (Cuadrado-García et al., 2010; Ramírez-Correa et al., 2015).
haviours among generations (Howe & Strauss, 1993, 2000, 2003; Reeves However, other studies posit that the gap is narrowing (Shaw & Grant,
& Oh, 2008; Strauss & Howe, 1991). Indeed, the birth generations 2002). In Higher Education, Price (2006) challenged the stereotypical
literature argues that this construct is a more embracing one and en view that females are disadvantaged by technology when studying on
capsulates important attributes that socially affect and identifies people, line courses and do not have reduced computer access compared to men.
with the ability to determine their learning styles (Williams et al., 2014). However, Price found out that females, place greater value on the pas
We, therefore, use this construct to pursue our study, noting that the toral aspect of tutoring and have different interaction styles compared
differences in gender across generations and between various genera with men, which may be related to their stronger desire to be academ
tions of gender have not been studied among undergraduates in higher ically engaged. These findings contradict the findings of other studies
education. The literature of generations in higher education has gener such as Venkatesh and Morris (2000) and Adamus et al. (2009). Cua
ally targeted traditional degree-awarding institutions, addressing aca drado-García et al., (2010; p.368) posit that in gender studies "While one
demic and student affairs issues (Giunta, 2017; Howe & Strauss, 2003; position argues that there are gender-specific behaviour patterns that may
Strauss & Howe, 2007; Dziuban et al., 2005) and continuing higher lead to a discrimination of women using e-learning (e.g., Astleitner &
education (Sandeen, 2008). But none of the extensive body of literature Steinberg, 2005; McSporran & Young, 2001), others argue that e-learning,
on generations specifically addresses the emergence of the through its flexible and interactive learning approach favours particularly
multi-generation cohort students currently found in the undergraduate women (e.g., Bruestle et al., 2009)". Besides, literature establishes that
degree-awarding institutions and their utility of the emerging men and women express varying degrees of anxiety, acceptance, and
E-Learning management systems application to education. interest in new technologies across time, and such differences highly
The study contributes to the current literature by clarifying the E- influence learning situations (McCoy & Heafner, 2004; Ramírez-Correa
Learning utility differences in generations of each gender and elucidates et al., 2015). Therefore, it is necessary to investigate whether there are
the nuances among various generations of gender in the emerging gender differences in the use of e-learning in this era of an accelerated
traditional undergraduate multi-generation cohort degree-awarding period of implementation and assess the varied nuances in these dif
programmes. We establish that differences in students’ utility of ele ferences. Besides, if gender differences exist, it will be necessary to
ments of e-learning systems are conditioned by birth generations implement integration policies concerning the use of e-learning by
marked by the social categorisations of Generations X, Y, and Z. We also Higher Education managers. We, therefore, pose the first research
show that undergraduate multi-generation cohorts contextualise stu question:
dents’ utility-satisfaction of e-learning components in their usage of e- RQ1: Do differences exist in the utility of E-Learning courses in
learning management systems in undergraduate programmes. Further gender across generations?
more, we suggest that student utility-satisfaction in e-learning delivered
courses is likely to improve when different multi-generational learning 3. Generations as social category characteristics
environments are contextualised in undergraduate programmes.
The study employs an E-Learning Systems user-satisfaction model to The literature on generations studies have conceptualised and clas
test student utility using partial least squares analysis on a multi- sified society from three perspectives genealogical, pedagogical, and
generational birth cohort and the subsamples of gender across genera historical-sociological (Franz & Scheunpflug, 2016). Within the
tions X, Y, and Z students. A partial least squares multi-group test was historical-sociology literature, Strauss and Howe (1991) popularized the
utilized to examine differences between groups. The paper is composed generational cohort theory, of which Ryder (1965, p.845) defined a
of sections on existing literature, research questions, hypotheses, and generational cohort as "the aggregate of individuals (with some population
conceptual development. The study then presents sections on method definition) who experienced the same event within the same time interval."
ology, Results, and discussion. Finally, the study’s contributions and The literature also defined a generational cohort as a cohort of people
implications, limitations, and areas for future research are presented. born within a particular period with an interval of approximately 20
years (Davis, 2004; Strauss & Howe, 1991). Besides, the literature ar
2. E-learning in higher education and gender gues that generation cohort as a social categorization is a safer basis for
personality generalization than other social categories (Strauss & Howe,
In the education sector, E-Learning refers to the use of software- 1991) and terms the distinct differences as ’peer personality’ (Strauss &
based and online learning (Campbell, 2004). It has, however, become Howe, 2000). Peer personality was later termed as ’generational
increasingly online (internet) and cloud-based due to development in persona’ (Howe & Strauss, 2000), and defined as "a distinctly human
technology (Chaubey & Bhattachary, 2015; Hubackova, 2015). Thus, and variable creation embodying attitudes about family life, gender
becoming an internet-enabled learning process with the application of roles, institutions, politics, religion, culture, lifestyle, and the future"
technology in design, delivery, and management of degree programmes (pp.40–41). The literature acknowledges that it is these distinctions of
(Chaubey & Bhattachary, 2015). Horvat et al. (2015) argued that in experiences that students construct knowledge and differ in education
Higher Education, the emerging trend of blended learning is the (Kerr, Rynearson, & Kerr, 2006; Kolb & Kolb, 2005). However,
2
D. Eshun Yawson and F. Amofa Yamoah Computers in Human Behavior 114 (2021) 106558
generational studies have used different categorisations in different 4. Materials and methods
disciplines (i.e., demography, marketing, sociology, and psychology)
(Giunta, 2017; Carpenter et al., 2012; Davis, 2004; Howe & Strauss, 4.1. Conceptual development
2003). To be able to set the markers for the generations and cover the
prominent generations currently found in Higher Education under From the literature, Hadullo et al. (2017) developed a model for
graduate programmes, this study used the following categorization: evaluating e-learning systems quality in higher education in developing
Generation X (1965–1979), Generation Y (1980–1995), and Generation countries that takes into consideration the idiosyncrasies of developing
Z (1996–2003) (Giunta, 2017; Edelman/StrategyOne, 2010; Wendover, countries (Bhuasiri et al., 2012; Mohammadi, 2015). The literature on
2002). In the education literature, the current phenomena of accelerated e-learning in developing countries identifies the impediments found in
usage of e-learning and the utility nuances of the emerging undergrad e-learning are resource availability, accessibility, infrastructure (i.e., the
uate generations’ gender differences have sparingly been researched. absence of vast communication infrastructure) and the role of social
Besides, we posit that since these differences may exist in a factors (e.g., learner and instructor) remaining dominant (Aung &
multi-generation undergraduate cohort, the general characteristics Khaing, 2016; Bhuasiri et al., 2012; Mohammadi, 2015). These are in
visible is an amalgamation of these generations, as they engage in contrast to developed countries, where the usefulness of the systems,
intergender and intergenerational learning (Franz & Scheunpflug, 2016; quality of information, ethical and legal considerations are dominant
Corrigan et al., 2013). Besides, the apparent gender differences are factors (Al-Fraihat et al., 2020). We, therefore, deem this model an
overlaid by personal values and characteristics of students derived from appropriate foundation for the research context. The Hadullo et al.
their birth generations. The literature on generation studies is domi (2017) model conceptualised the e-learning evaluation model as having
nated by research on cross-cutting generational studies over gender six constructs of course development, learner support, assessment, user
(Ahmad & Tarmudi, 2012; Giunta, 2017; Prensky, 2001; Slavin, 2014). characteristics, institutional factors, and overall performance. The con
Thus, most studies consider generations as social grouping without structs and items were derived from literature adapted from Hadullo
considering the gender differences within a generational cohort. et al., (2017, p.190). In this model, Hadullo et al. (2017) posited that the
Furthermore, Wagner et al. (2010) state that "When it comes to using overall performance measures of the E-Learning system quality are
computers, older adults have different needs and concerns compared to affected by course development, learner support, institutional factors,
younger adults resulting from the natural physical and cognitive changes that and assessment constructs and overall performance. These relationships
come with ageing" (pp.870). Sandeen (2008), therefore, argued that if are mediated by user characteristics. Since this study is about utility, we
researchers and educational stakeholders knew more about these dif propose a new framework by adapting the Hadullo et al. (2017) model.
ferences, they might perform better at developing and delivering The e-learning literature has established that there is a relationship
effective educational programmes. between perceived usefulness as among the key reasons acting on the
In the extant literature, Generation X (1965–1979) is identified as disposition of university undergraduates to use e-learning (Raspopovic
the "latchkey generation" and known for their independent and expected et al., 2014; Ngai et al., 2007). Besides, the updated Delone and McLean
freedom (Selingo, 2018). Sandeen (2008) classified them as the first to Model (Delone & McLean, 2003) introduce the concepts of intention to
grow up with computers, and associated them with the appreciation of use, use, and user satisfaction in the evaluation of information systems.
feedback and generally want information about their progress. They are We posit that these constructs be measured not at the macro level but at
also known to look for and appreciate opportunities for professional the micro-level of the individual components of the system. Also, Ven
development. Generation Y (1980–1995) grew up with computers and katesh and Bala (2008, p.280), drawing from the work on the de
encountered its use in education. They are highly digitally connected terminants of perceived usefulness, introduced the variable Results
(Frand, 2000; Prensky, 2001) since they experienced the rapid adoption Demonstrability as having a relationship with perceived use in their
of technology (i.e., internet, cell phones, and other mobile devices) TAM 3 (Technology Acceptance Model 3). Results demonstrability is
(Monaco & Martin, 2007; Sandeen, 2008). They are also the social defined as the degree to which an individual believes that the results of
media pioneers, prefer learning in groups, and are known to have using a system are tangible, observable, and communicable (Venkatesh
brought consumer mentality to higher education (McCuskey, 2020; & Bala, 2008, p.277). We, therefore, postulate that the perceived use
Selingo, 2018). Besides, they are characterised as team-oriented, confi fulness of the components of the E-Learning System has a relationship
dent, and highly optimistic, pressured, keen to achieve, and conven with the results demonstrability leading to overall satisfaction. Thus, we
tional (Howe & Strauss, 2000). Generation Z (1996–2003) has many argue that a discrete evaluation of usefulness to the user of the various
accolades, as "Digital natives", "iGeneration", "Internet Generation", component of the e-learning system will be more beneficial to lecturers
"Computer Generation", and "Net Natives", due to their dependency on and e-learning creators to enable them to modify elements of the
computer technology, as they have no experience of the pre-Internet era e-learning system to contextualise user characteristics to enhance
(Giunta, 2017; Koutropoulos, 2011; Prensky, 2001; Slavin, 2014). They overall satisfaction. This is shown in our model in Fig. 1. Also, each
are focused on value and seek a relevant education they can apply, construct and the indicators used to reflect each construct supported by
which has implications on higher education recruitment, pedagogy, and related studies are shown in Appendix 1. Based on the literature
lifestyle (Selingo, 2018). reviewed, we proceed to propose the following hypotheses to interro
These characterisations are expected to be evident in males and fe gate the research questions:
males, overlaying gender nuances and idiosyncrasies. Thus, it is
important to investigate whether these differences affect the use of e- H1: Statistically significant differences between males and females
learning in the era of an accelerated period of implementation and what exist in the relationships between the variables of the utility of the E-
are the nuances in these differences along with the two genders. If these Learning system.
differences exist within the genders, then there can be the con H11 Statistically significant differences exist between males of gen
textualisation in integration policies concerning the use of e-learning by eration X and females of generation X in the relationships between
Higher Education managers. the variables of the utility of the E-Learning system components.
We, therefore pose the second and third research questions: H12 Statistically significant differences exist between males of gen
eration Y and females of generation Y in the relationships between
RQ2: Do differences exist in the utility of E-Learning courses within the variables of the utility of the E-Learning system components.
the three generations of males? H13 Statistically significant differences exist between males of gen
RQ3: Do differences exist in the utility of E-Learning courses within eration Z and females of generation Z in the relationships between
the three generations of females? the variables of the utility of the E-Learning system components.
3D. Eshun Yawson and F. Amofa Yamoah Computers in Human Behavior 114 (2021) 106558
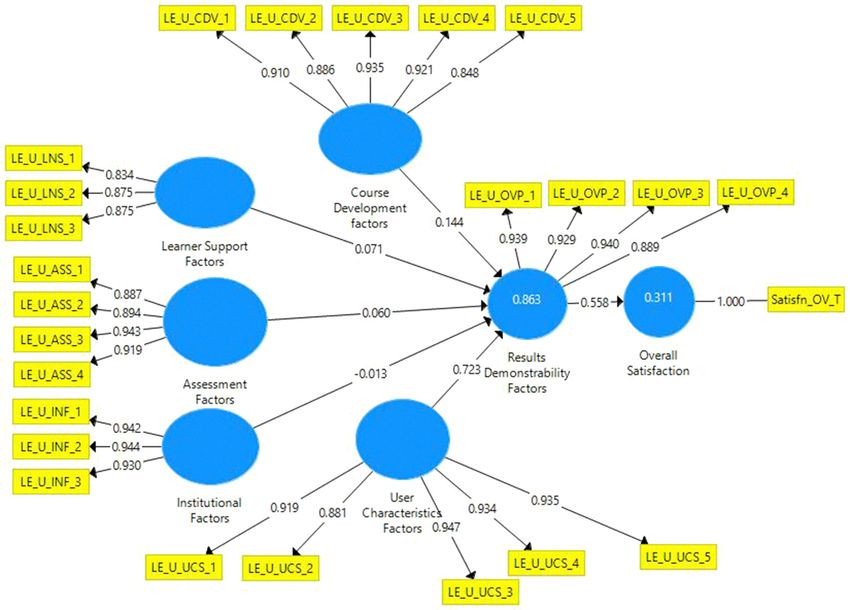
Fig. 1. Research model.
H2: Statistically significant differences exist between males of the the unique characteristics of the sample and subsamples. Ethical
three generations in the relationships between the variables of the approval was met as per the Institute’s ethical guidelines; students’
utility of the E-Learning system. grades were not part of this research, and respondents were informed of
H 21 Statistically significant differences exist between males of the possibility of their data being used for publication. The survey in
generation X and males of generation Y in the relationships between strument was administered electronically on another platform at the end
the variables of the utility of the E-Learning system components. of the semester for students as a Satisfaction Survey, which made it clear
H 22 Statistically significant differences exist between males of that it was not part of the course assignment to minimize students’
generation X and males of generation Z in the relationships between perception that they were obliged to complete the questionnaire.
the variables of the utility of the E-Learning system components. Multi-Group partial least squares analysis was then conducted to analyse
H 23 Statistically significant differences exist between males of the differences in the scores of the variables in the model for differences
generation Y and males of generation Z in the relationships between existing in generations of gender in the different constructs of the pro
the variables of the utility of the E-Learning system components. posed model. This procedure provides outcomes of three different ap
H3: Statistically significant differences exist between females of the proaches that are based on bootstrapping Results from every group (e.g.,
three generations in the relationships between the variables of the outer weights, outer loadings, and path coefficients) (Hair et al., 2018;
utility of the E-Learning system. Sarstedt et al., 2011). All analysis was done using SPSS 23 and Smartpls
H 31 Statistically significant differences exist between females of 3 (Ringle et al., 2015; Chin, 2010) software.
generation X and females of generation Y in the relationships be
tween the variables of the utility of the E-Learning system
4.3. Measures
components.
H 32 Statistically significant differences exist between females of
From a comprehensive satisfactory study for evaluating the learning
generation X and females of generation Z in the relationships be
experience and the management system, the study instrument was
tween the variables of the utility of the E-Learning system
derived. The study instrument utilized a set of twenty-five items
components.
measuring the seven components in the model relevant to participant
H 33 Statistically significant differences exist between females of
learning user experience. The instrument measures the six components
generation Y and females of generation Z in the relationships be
of the proposed model using items mainly from the Hadullo et al. (2017)
tween the variables of the utility of the E-Learning system
model (see Appendix 1). These are: 1) Course Development Factors
components.
(Course outline, List of reading materials, List of forum sessions in the
course, Current and accurate content in teaching videos/lectures, Easy
4.2. Methodology to use interface (website); 2) Learner Support Factors (Group support
work, Feedbacks from Emails, chats, and forum, Support from IT); 3)
The research employs the open-source internal network learning Institutional Factors (Availability of Internet, Availability of computers,
management system, Moodle, which is a leading global network used for Maintenance of infrastructure (use without any problems)); 4) Assess
blended learning, flipped classroom, and distance education in Higher ment Factors (Assignment due dates, None or minimal issue with grades,
Education globally (Chaubey & Bhattachary, 2015) as the context for the Feedback on Assignments, Feedback on Examination); 5) User Charac
study. This learning system was deployed in a leading business school in teristics Factors (Your belief in your ability to achieve goals (Self-
Accra, Ghana, to introduce a blended online mandatory course, which efficacy), Your training on the internet, Your personal motivation,
was a core course component for all undergraduate business school’s Incentives to take the sessions at your own time, Your experience with
four year-programmes in the 2019/2020 academic year. The study used the course content); 6) Results Demonstrability Factors (Information
registered students from the first two levels, which totalled 700, with quality of the videos, Service quality in the delivery of the course, Better
300 students from year 1, and 400 from year two respectively. From this opportunity to getting better grades, Cost-effectiveness of the new de
population, 624 students voluntarily submitted their surveys, out of livery system). Participants were asked to rate the usefulness of these
which 611 responses were useable, resulting in a response rate of 87.2%. items on a seven-point scale of usefulness (Extremely Useful (7) to
Table 1 shows the descriptive statistics and background information of Totally Useless (1)). An additional item was used to measure overall
4D. Eshun Yawson and F. Amofa Yamoah Computers in Human Behavior 114 (2021) 106558
Table 1
Descriptive statistics of sample and subsamples.
Descriptive Statistics Gender By Generation Total
Females in Females in Females in Males in Males in Males in
Generation Z Generation Y Generation X Generation Z Generation Y Generation X
(FGen Z) (FGen Y) (FGen X) (MGen Z) (MGen Y) (MGen X)
Gender Female 35.1% 58.2% 6.8% – – – 368
Male – – – 29.6% 60.9% 9.5% 243
Total 21.1% 35.0% 4.1% 11.8% 24.2% 23.8% 611
Generations Generation Z 64.2% – – 35.8% – – 201
(IGeneration) (16–23
yrs)
Generation Y – 59.1% – – 40.9% – 362
(Millennials) (24–39
yrs)
Generation X (40–54 – – 52.1% – – 47.9% 48
yrs)
Total 21.1% 35.0% 4.1% 11.8% 24.2% 3.8% 611
Course of Procurement 16.5% 39.1% 0.0% 9.6% 33.0% 1.7% 115
Study Project Management 10.7% 12.5% 1.8% 17.9% 46.4% 10.7% 56
Hospitality 38.3% 38.3% 8.3% 1.7% 13.3% 0.0% 60
Accounting 27.7% 14.9% 8.5% 31.9% 17.0% 0.0% 47
Administration 16.1% 39.7% 3.5% 10.6% 25.1% 5.0% 199
Finance 14.7% 35.3% 0.0% 14.7% 35.3% 0.0% 34
Human Resource 36.0% 41.3% 8.0% 5.3% 6.7% 2.7% 75
Marketing 16.0% 40.0% 8.0% 20.0% 4.0% 12.0% 25
Total 21.1% 35.0% 4.1% 11.8% 24.2% 3.8% 611
Student Full-Time Student 43.3% 18.3% 0.0% 24.7% 12.9% 0.8% 263
Status Student Worker 4.3% 47.7% 7.2% 2.0% 32.8% 6.0% 348
Total 21.1% 35.0% 4.1% 11.8% 24.2% 3.8% 611
satisfaction (Cidral et al., 2018) on a 7-point scale (Very Dissatisfied (1) 5.2. Results of the Structural Model
to Very Satisfied (7)). The three main generations were operationalized
as Generation X (40–54 years), Generation Y (24–39 years), and Gen A complete bootstrapping procedure with 500 bootstrapping sam
eration Z (16–23 years) (Giunta, 2017; Edelman/StrategyOne, 2010; ples was performed for all the subsamples using SmartPLS 3 Multi-Group
Wendover, 2002). Whilst gender was included as male and female, and procedure. The measure used for the explained variance of latent
background information on the course of study, student status and stu dependent variables to the total variance in the model was the coeffi
dents’ programme time (Little, 2005). cient of determination (R2) (using approximately 0.190 weak; 0.333
moderate; and 0.670 substantial) (Chin, 1998). This also measured the
5. Data analysis and results model’s predictive accuracy. These Results are presented in Table 2.
Course Development, Learner Support, Assessment, Institutional, and
5.1. Results of the measurement model User Characteristics factors explained variance in the following samples:
86.3% in the multi-generational sample; 88.3% in Males; 85.2% in Fe
The hypotheses were tested using the research model, using factor males; 96.8% in Females in Generation X; 85.5% in Females in Gener
analysis and partial least squares approaches where the sample was ation Y; 84.6% in Females in Generation Z; 81.8% in Males in Generation
grouped into gender and by generations. An exploratory factor analysis X; 87.5% in Males in Generation Y; and 91.8% in Males in Generation Z,
(using varimax rotation and principal components) was conducted and all with a substantial predictive power of the variance in Results
items loaded on corresponding constructs with an explained total vari Demonstrability Factors in e-learning utility. Also, Results Demonstra
ance of 84.86%. Content validity was achieved with the theoretical and bility Factors explained variance in the following samples, 31.1% in the
empirical evidence supported by the measurement instrument from the multi-generational sample; 37.4% in Males; 27.0% in Females; 20.9% in
literature reviewed. We then proceeded with the measurement model; Females in Generation X (which did not reach significance); 24.3% in
indicator reliability was established with measures above 0.7 (Hair Females in Generation Y; 32.8% in Females in Generation Z; 37.6% in
et al., 2014). Internal consistency reliability was assessed using the Males in Generation X; 43.6% in Males in Generation Y; and 27.4% in
Cronbach’s alpha (α), and Composite Reliability (CR) with a cut off Males in Generation Z all with a moderate predictive power of the
value of ≥0.70 for both tests (Urbach & Ahlemann, 2010), ensuring variance in Overall Satisfaction in e-learning utility. The predictive
internal consistency reliability and validity of the measures for the relevance of the model was evaluated using cross-validated redundancy
variables are met. Also, all constructs’ AVE exceeded 0.50 with com (Q2) with the blindfolding SmartPLS procedure, Q2 > 0 implies the
posite reliabilities above 0.70 supporting convergent validity (Hair model has predictive relevance whereas Q2 < 0 represents a lack of
et al., 2014) and indicators examined for cross-loadings with no evi predictive relevance of the model (Hair et al., 2014). All the relation
dence of cross-loadings. For discriminant validity, the Average Variance ships were predictive relevant.
Explained (AVE) values of the constructs were greater than the square of The significance levels of the model were assessed with the path
the correlations, hence, satisfying discriminant validity criterion (For coefficients, t-values, and p-values (p < 0.05, one-tailed distribution)
nell & Larcker, 1981; Hair et al., 2014; Urbach & Ahlemann, 2010). To (Hair et al., 2014). Fig. 2 shows the path coefficients for the
further confirm discriminant validity, the heterotrait-monotrait ratio multi-generational sample. We then proceed to present the Results in the
(HTMT) of the correlations was assessed with a specificity criterion rate subsamples (generational cohorts) as indicated in the relationships of
of 0.85–1.00 and accepted, using the liberal approach (Gaskin, Godfery the research model in Tables 3 and 4. In Table 3, the results show:
& Vance 2018; Henseler et al., 2015). Achieving discriminant validity Course Development factors - > Results Demonstrability Factors (R1): In
between constructs indicates their acceptability for hypothesis testing the relationship of Course Development factors with Results Demon
(Mathieu & Taylor, 2006). strability, results show that positive significant influence in the multi-
5D. Eshun Yawson and F. Amofa Yamoah Computers in Human Behavior 114 (2021) 106558
Table 2 Generation Y, Females in Generation Z, Males in Generation X, and
Predictive power estimation of the model in groups. Males in Generation Z.
R2 Predictive Q2 (=1- Learner Support Factors - > Results Demonstrability Factors (R2): In the
VALUES Power SSE/ relationship of Learner Support with Results Demonstrability, results
SSO) show positive significant influence in the multi-generational cohort (γ =
Overall Satisfaction Sample (N = 611) 0.311c Moderate 0.305 0.071, p = 0.046), Females (γ = 0.089, p = 0.037) and Males in Gen
Males 0.374c Moderate 0.348 eration Z (γ = 0.220, p = 0.045). Thus, in the E-Learning multi-
Females 0.270c Moderate 0.261 generational cohort environment, the utility of Learner Support leads
Females in 0.209(n. Moderate 0.084
Generation X s)
to positive Results Demonstrability with the strongest positive influence
(FGen X) in the order of Males in Generation Z, Females, and the multi-
Females in 0.243c Moderate 0.228 generational cohort respectively. Other subsamples did not reach sta
Generation Y tistical significance.
(FGen Y)
Table 4 presents the Results for Institutional factors, User Charac
Females in 0.328c Moderate 0.323
Generation Z teristics, and Results Demonstrability.
(FGen Z) Institutional Factors - > Results Demonstrability Factors (R4): In the
Males in 0.376a Moderate 0.297 relationship of Institutional factors with Results Demonstrability, results
Generation X did not reach significance in the multi-generational cohort and any of
(MGen X)
Males in 0.436c Moderate 0.430
the subsample cohort. However, the relationship was generally negative
Generation Y across the subsample cohorts.
(MGen Y) User Characteristics Factors - > Results Demonstrability Factors(R5): In
Males in 0.274b Moderate 0.239 the relationship of User Characteristics with Results Demonstrability,
Generation Z
results show positive significant influence in the multi-generational
(MGen Z)
Results Sample (N = 611) 0.863c Substantial 0.729 cohort (γ = 0.723), Males (γ = 0.656); Females (γ = 0.746); Females
Demonstrability Males 0.883c Substantial 0.748 in Generation X (γ = 0.916); Females in Generation Y (γ = 0.712); Fe
Factors Females 0.852c Substantial 0.712 males in Generation Z (γ = 0.729); Males in Generation Y (γ = 0.619)
Females in 0.968c Substantial 0.765 and Males in Generation Z (γ = 0.689) with all of them significant at p <
Generation X
0.001. Thus, in the E-Learning multi-generational cohort environment
(FGen X)
Females in 0.855c Substantial 0.714 the utility of User Characteristics lead to positive Results Demonstra
Generation Y bility with the strongest positive influence in the order of Females in
(FGen Y) Generation X; Females; Females in Generation Z; multi-generational
Females in 0.846c Substantial 0.690
cohort; Females in Generation Y; Males in Generation Z; Males; and
Generation Z
(FGen Z) Males in Generation Y respectively. The relationship did not reach sig
Males in 0.818c Substantial 0.458 nificance in students in the Males in Generation X cohort. Results
Generation X Demonstrability Factors - > Overall Satisfaction (R6): In the relationship of
(MGen X) Results Demonstrability with Overall Satisfaction, results show positive
Males in 0.875c Substantial 0.707
significant influence in the multi-generational cohort (γ = 0.558), Males
Generation Y
(MGen Y) (γ = 0.612); Females (γ = 0.519); Females in Generation X (γ = 0.457);
Males in 0.918c Substantial 0.812 Females in Generation Y (γ = 0.493); Females in Generation Z (γ =
Generation Z 0.573); Males in Generation X (γ = 0.613); Males in Generation Y (γ =
(MGen Z)
0.661) and Males in Generation Z (γ = 0.524) with all of them significant
Note: p-values. at p < 0.001. Thus, in the E-Learning multi-generational cohort envi
a
p < 0.05. ronment the utility of Results Demonstrability lead to positive Overall
b
p < 0.01. Satisfaction with the highest positive influence in the order of Males in
c
p < 0.001. n. s – non significant; Coefficient of determination (R2) (with the Generation Y; Males in Generation X; Males; Females in Generation Z;
cut off levels as: 0.190 weak; 0.333 moderate; and 0.670 substantial). multi-generational cohort; Males in Generation Z; Females; Females in
Generation Y and Females in Generation X respectively.
generational cohort (γ = 0.144, p = 0.004); Females (γ = 0.173, p =
0.004); Females in Generation Y (γ = 0.167, p = 0.031); Females in 5.3. Results of the Multi-Group Analysis and testing of hypotheses
Generation Z (γ = 0.200, p = 0.012) and Males in Generation Y (γ =
0.178, p = 0.019). Thus, in the E-Learning multi-generational cohort Using the Multi-Group Analysis in SmartPLS, an initial test was
environment, the utility of Course Development leads to positive Results conducted to establish the baseline of the path coefficients differences in
Demonstrability with the strongest positive influence in the order of the sample on gender. This test on the multi-generational cohort show
Females in Generation Z, Males in Generation Y, Females and Females in path coefficient differences in the variables in the utility of e-learning
Generation Y respectively. The general positive effect on the multi- between females and males were not significant and were also not sig
generational cohort is the least. The relationship did not reach signifi nificant from the parametric test. This is shown in Table 5.
cance in students in the following subsamples Males, Females in Gen To elicit the nuances in the multi-generational cohort, further anal
eration X, Males in Generation X, and Males in Generation Z. ysis was conducted on the subsample cohorts to test the hypotheses. The
Assessment Factors - > Results Demonstrability Factors (R3): In the analysis shows differences in path coefficient for the relationship be
relationship of Assessment factors with Results Demonstrability, results tween User Characteristics and Results Demonstrability is statistically
show positive significant influence in Males (γ = 0.198, p = 0.001) and significant for Females of Generation X and Males of Generation X (t-
Males in Generation Y (γ = 0.216, p = 0.001). Thus, in the E-Learning value = .1.879, p = 0.033) (Shown in Table 6). Hence, we partially
multi-generational cohort environment, the utility of Assessment Fac accept hypothesis H11’ Also, the results show differences in path coef
tors leads to positive Results Demonstrability for Male students and have ficient for the relationship between Assessment Factors and Results
a larger influence in Males in Generation Y. The relationship did not Demonstrability is statistically significant for Females of Generation Y
reach significance in students in the multi-generational cohort and the and Males of Generation Y (t-value = .1.892, p = 0.030) (Shown in
following subsamples Females, Females in Generation X, Females in Table 7). Hence, we partially accept hypothesis H12. Additional analysis
6D. Eshun Yawson and F. Amofa Yamoah Computers in Human Behavior 114 (2021) 106558
Fig. 2. Structural model for multi-generation sample with path coefficients.
shows the differences in path coefficient for the relationship between p = 0.039) (Shown in Table 13). Hence, we partially accept hypothesis
Course Development Factors and Results Demonstrability is statistically H32. Furthermore, the results show no statistical differences in path
significant for Females of Generation Z and Males of Generation Z (t- coefficients for the relationships in the model, and none did not reach
value = 2.415, p = 0.008) (Shown in Table 8). Hence, we partially statistically significant for Females of Generation Y and Females of
accept hypothesis H13 Generation Z, as shown in Table 14. Hence, we reject hypothesis H33.
The Results for the test for hypothesis H2 are presented in
Tables 9–11 show the differences in path coefficient for the relationship 6. Discussion
between Institutional Factors and Results Demonstrability is statistically
significant for Males of Generation X and Males of Generation Y (t-value The Results validated an e-learning utility model in a multi-
= 1.662, p = 0.049) (Shown in Table 9). Hence, we partially accept generational cohort with statistically significant variables of Course
hypothesis H21 Also, the results show the differences in path coefficient Development, Learner Support, and User Characteristics having a posi
for the relationship between Course Development Factors and Results tive substantial predictive relationship with Results Demonstrability,
Demonstrability is statistically significant for Males of Generation X and which leads to a statistically significant positive moderately predictive
Males of Generation Z (t-value = 2.111, p = 0.019) (Shown in Table 10). relationship with Overall Satisfaction. Thus, these factors are the pre
Hence, we partially accept hypothesis H22. Furthermore, the results dictors of student utility satisfaction in e-learning in a multi-
show the differences in path coefficient for the relationship between generational undergraduate cohort.
Course Development Factors and Results Demonstrability is statistically However, in the gender Results, males had statistically significant
significant for Males of Generation Y and Males of Generation Z (t-value variables of Assessment and User Characteristics having a positive
= 2.169, p = 0.016) (Shown in Table 11). Hence, we partially accept substantial predictive relationship with Results Demonstrability, leading
hypothesis H23. to a statistically significant positive moderately predictive relationship
The Results for the test for hypothesis H3 as presented in with Overall Satisfaction. On the contrary, Females were influenced by
Tables 12− 14, the differences in path coefficient for the relationship Course Development, Learner Support, and User Characteristics having
between Learner Support Factors and Results Demonstrability, for Fe a positive substantial predictive relationship with Results Demonstra
males of Generation X and Females of Generation Y (t-value = 1.665, p bility, which leads to a statistically significant positive moderately
= 0.123) (Shown in Table 12). However, it did not reach statistical predictive relationship with Overall Satisfaction. Therefore, the per
significance. We, therefore, reject hypothesis H31. The results also show spectives of males and females in the utility of e-learning have under
the differences in path coefficient for the relationship between Institu lying nuances. However, these differences may be obscured by their
tional Factors and Results Demonstrability is statistically significant for representative numbers in the multi-generational cohort.
Females of Generation X and Females of Generation Z (t-value = 1.772, The Results also show that within the multi-generational cohort, in
7D. Eshun Yawson and F. Amofa Yamoah Computers in Human Behavior 114 (2021) 106558
Table 3
Path estimates for the model for various groups.
PATH GROUPS Coefficients Sample Mean Standard Deviation T Statistics (|O/
(γ) (M) (STDEV) STDEV|)
Assessment Factors - > Results Demonstrability Factors Sample (N = 611) 0.060(n.s) 0.060 0.041 1.461
Males 0.198c 0.187 0.064 3.102
Females − 0.014(n.s) − 0.008 0.052 0.264
Females in Generation X − 0.083(n.s) − 0.083 0.091 0.919
(FGen X)
Females in Generation Y 0.002(n.s) 0.007 0.080 0.024
(FGen Y)
Females in Generation Z 0.016(n.s) 0.012 0.063 0.263
(FGen Z)
Males in Generation X (MGen 0.212(n.s) 0.183 0.201 1.052
X)
Males in Generation Y (MGen 0.216c 0.201 0.072 3.018
Y)
Males in Generation Z (MGen 0.237(n.s) 0.232 0.176 1.348
Z)
b
Course Development factors - > Results Sample (N = 611) 0.144 0.138 0.053 2.706
Demonstrability Factors Males 0.111(n.s) 0.106 0.077 1.451
Females 0.173b 0.175 0.064 2.680
Females in Generation X 0.133(n.s) 0.197 0.183 0.726
(FGen X)
Females in Generation Y 0.167a 0.176 0.089 1.868
(FGen Y)
a
Females in Generation Z 0.200 0.209 0.088 2.275
(FGen Z)
Males in Generation X (MGen 0.432(n.s) 0.355 0.316 1.370
X)
Males in Generation Y (MGen 0.178a 0.176 0.085 2.087
Y)
Males in Generation Z (MGen − 0.151(n.s) − 0.166 0.126 1.197
Z)
a
Learner Support Factors - > Results Demonstrability Sample (N = 611) 0.071 0.071 0.042 1.684
Factors Males 0.041(n.s) 0.049 0.058 0.705
Females 0.089a 0.086 0.050 1.792
Females in Generation X − 0.163(n.s) − 0.150 0.104 1.568
(FGen X)
Females in Generation Y 0.106(n.s) 0.100 0.075 1.421
(FGen Y)
Females in Generation Z 0.098(n.s) 0.111 0.077 1.280
(FGen Z)
Males in Generation X (MGen 0.059(n.s) − 0.041 0.196 0.302
X)
Males in Generation Y (MGen 0.009(n.s) 0.019 0.082 0.113
Y)
a
Males in Generation Z (MGen 0.220 0.207 0.130 1.698
Z)
Note: Standardized path coefficient.
a
p < 0.05.
b
p < 0.01.
c
p < 0.001, n. s – non significant.
the utility of Course Development to positively influence Results Institutional factors with Results Demonstrability, results did not reach
Demonstrability relationship, the highest positive groups influenced are significance in the multi-generational cohort and were generally nega
in the order of Females in Generation Z, Males in Generation Y, Females tive across the subsample cohorts. Therefore, the perspectives of the
and Females in Generation Y respectively. The general positive effect on various subsample cohorts for the utility of e-learning have underlying
the multi-generational cohort is the least. In the utility of Learner Sup differences that are not apparent when examined firstly, from only the
port to positive influence Results Demonstrability relationship, the perspective of gender or generational studies. Secondly, these results
highest positive groups influenced are in the order of Males in Genera establish the existence of differences due to gender and generations.
tion Z, Females, and the multi-generational cohort, respectively. Also, Thirdly the appearance in the multi-generational cohort obfuscates the
the utility of User Characteristics leading to positive influence on Results different utility perspectives in the utility of e-learning.
Demonstrability is categorised with the highest positive groups influ To further compare these influences on the utility of the e-learning
enced in the order of Females in Generation X; Females; Females in variables in our model, although there was evidence to show that the
Generation Z; multi-generational cohort; Females in Generation Y; differences between males and females did not reach statistical signifi
Males in Generation Z; Males; and Males in Generation Y respectively. cance, the analysis of the differences in the subsample cohorts are
Furthermore, in the utility of Results Demonstrability leading to a pos contrary. The analysis shows differences in path coefficient for the
itive influence in Overall Satisfaction relationship, the highest positive relationship between User Characteristics and Results Demonstrability is
groups influenced are in the order of Males in Generation Y; Males in statistically significant for Females of Generation X and Males of Gen
Generation X; Males; Females in Generation Z; multi-generational eration X. We therefore partially accept significant differences exist
cohort; Males in Generation Z; Females; Females in Generation Y and between males of generation X and females of generation X in the utility
Females in Generation X respectively. However, in the relationship of of the E-Learning system components. Also, the results show differences
8D. Eshun Yawson and F. Amofa Yamoah Computers in Human Behavior 114 (2021) 106558
Table 4
Path estimates for the model for various groups.
PATH GROUPS Coefficients Sample Mean Standard Deviation T Statistics (|O/
(γ) (M) (STDEV) STDEV|)
Institutional Factors - > Results Demonstrability Sample (N = 611) − 0.013(n.s) − 0.012 0.027 0.478
Factors Males − 0.026(n.s) − 0.025 0.030 0.867
Females − 0.009(n.s) − 0.008 0.039 0.234
Females in Generation X 0.166(n.s) 0.159 0.132 1.262
(FGen X)
Females in Generation Y 0.015(n.s) 0.013 0.051 0.294
(FGen Y)
Females in Generation Z − 0.085(n.s) − 0.081 0.056 1.522
(FGen Z)
Males in Generation X (MGen − 0.247(n.s) − 0.126 0.194 1.274
X)
Males in Generation Y (MGen − 0.041(n.s) − 0.039 0.036 1.144
Y)
Males in Generation Z (MGen − 0.020(n.s) − 0.014 0.062 0.322
Z)
User Characteristics Factors - > Results Sample (N = 611) 0.723*** 0.728 0.044 16.469
Demonstrability Factors Males 0.656*** 0.664 0.078 8.467
Females 0.746*** 0.742 0.051 14.515
Females in Generation X 0.916*** 0.857 0.131 7.011
(FGen X)
Females in Generation Y 0.712*** 0.706 0.074 9.592
(FGen Y)
Females in Generation Z 0.729*** 0.711 0.091 8.051
(FGen Z)
Males in Generation X (MGen 0.400(n.s) 0.470 0.270 1.478
X)
Males in Generation Y (MGen 0.619*** 0.628 0.085 7.320
Y)
Males in Generation Z (MGen 0.689*** 0.716 0.165 4.163
Z)
Results Demonstrability Factors - > Overall Sample (N = 611) 0.558*** 0.558 0.042 13.280
Satisfaction Males 0.612*** 0.611 0.067 9.188
Females 0.519*** 0.522 0.052 9.983
Females in Generation X 0.457** 0.456 0.182 2.517
(FGen X)
Females in Generation Y 0.493*** 0.499 0.074 6.632
(FGen Y)
Females in Generation Z 0.573*** 0.575 0.061 9.422
(FGen Z)
Males in Generation X (MGen 0.613*** 0.588 0.160 3.825
X)
Males in Generation Y (MGen 0.661*** 0.661 0.075 8.830
Y)
Males in Generation Z (MGen 0.524*** 0.523 0.111 4.736
Z)
Note: Standardized path coefficient; *p < 0.05, **p < 0.01, ***p < 0.001, n.s – non significant.
in path coefficient for the relationship between Assessment Factors and their representative numbers in the multi-generational cohort. There
Results Demonstrability is statistically significant for Females of Gen fore, in the accelerated implementation of e-learning for traditional
eration Y and Males of Generation Y. Hence, we partially accept that undergraduate business school courses, there is the need to con
statistically significant differences exist between males of generation Y textualise learners by gender and generation to optimise overall satis
and females of generation Y in the utility of the E-Learning system faction for students. This contextualisation may be through changes in
components. Besides, the differences in path coefficient for the rela design, pedagogy, delivery, and assessment that will impact Course
tionship between Course Development Factors and Results Demonstra Development, Learner Support, Assessment, and User Characteristics
bility was statistically significant for Females of Generation Z and Males Factors. It is important to also note that there is a need to improve
of Generation Z. We, therefore, partially accept differences exist be Institutional Factors to modify its apparent negative relationship with
tween males of generation Z and females of generation Z in the re Results Demonstrability in e-learning utility.
lationships between the variables of the utility of the E-Learning system
components. 6.1. New contributions to practice
Within the male gender, statistically significant relationships exist
for Institutional Factors and Results Demonstrability in Males of Gen The study notes that the digital divide may have narrowed in some
eration X and Males of Generation Y. Also, a statistically significant developed countries as argued by Shaw and Grant (2002) in the litera
relationship exists for Course Development Factors and Results ture. However, this study shows there are nuances in the utility of
Demonstrability for Males of Generation X and Males of Generation Z. E-Learning by undergraduates in our developing country case study,
Furthermore, the results show statistically significant differences for which is contrary to the literature. Also, there is the need to con
Course Development Factors and Results Demonstrability for Males of textualise the design and implementation of e-learning courses by
Generation Y and Males of Generation Z for the utility of the E-Learning gender and generations to ensure the maximisation of student Overall
system components. Satisfaction of the utility of e-learning. Secondly, the study provides a
These Results show these differences exist but may be obscured by validated e-learning user-satisfaction utility model with a moderate
9D. Eshun Yawson and F. Amofa Yamoah Computers in Human Behavior 114 (2021) 106558
Table 5 Table 7
Results of multi-group analysis of female and male students. Results of multi-group analysis for females of generation Y and males of gen
PLS-MGA PATH COEFFICIENTS PARAMETRIC TEST
eration Y.
PLS-MGA PATH COEFFICIENTS PARAMETRIC TEST
PATH Path p-Value t-Value (| p-Value
Coefficients- new Female vs (Female PATH Path p-Value t-Value(| p-Value
diff (Female - (Female vs Male|) vs Male) Coefficients-diff new FGen Y vs (FGen Y
Male) Male) (FGen Y - MGen (FGen Y MGen Y|) vs MGen
Y) vs MGen Y)
Assessment Factors - − 0.131 0.082 1.827 0.068
Y)
> Results
Demonstrability Assessment Factors - > − 0.214 0.023 1.892 0.030
Factors Results
Course Development 0.045 0.662 0.449 0.654 Demonstrability
factors - > Results Factors
Demonstrability Course Development − 0.011 0.465 0.088 0.465
Factors factors - > Results
Institutional Factors - 0.001 0.992 0.011 0.991 Demonstrability
> Results Factors
Demonstrability Institutional Factors - 0.056 0.183 0.838 0.201
Factors > Results
Learner Support 0.028 0.702 0.389 0.697 Demonstrability
Factors - > Results Factors
Demonstrability Learner Support 0.097 0.193 0.849 0.198
Factors Factors - > Results
Results − 0.094 0.243 1.191 0.234 Demonstrability
Demonstrability Factors
Factors - > Overall Results − 0.167 0.055 1.599 0.055
Satisfaction Demonstrability
User Characteristics 0.062 0.498 0.699 0.485 Factors - > Overall
Factors - > Results Satisfaction
Demonstrability User Characteristics 0.093 0.203 0.818 0.207
Factors Factors - > Results
Demonstrability
Factors
Table 6
Results of multi-group analysis for females of generations X and males of gen
eration X. Table 8
Results of mult-group analysis for females of generation Z and males of gener
PLS-MGA PATH COEFFICIENTS PARAMETRIC TEST
ation Z.
PATH Path p-Value t-Value(| p-Value
Coefficients-diff new FGen X (FGen X PLS-MGA PATH COEFFICIENTS PARAMETRIC TEST
(FGen X - MGen (FGen X vs MGen vs MGen PATH Path p-Value t-Value(| p-Value
X) vs MGen X|) X) Coefficients-diff new FGen Z vs (FGen Z
X) (FGen Z - MGen (FGen Z MGen Z|) vs MGen
Assessment Factors - > − 0.295 0.096 1.393 0.085 Z) vs MGen Z)
Results Z)
Demonstrability Assessment Factors - > − 0.220 0.106 1.501 0.067
Factors Results
Course Development − 0.299 0.178 0.866 0.195 Demonstrability
factors - > Results Factors
Demonstrability Course Development 0.351 0.011 2.415 0.008
Factors factors - > Results
Institutional Factors - 0.414 0.062 1.616 0.056 Demonstrability
> Results Factors
Demonstrability Institutional Factors - − 0.065 0.216 0.726 0.234
Factors > Results
Learner Support − 0.222 0.158 1.061 0.147 Demonstrability
Factors - > Results Factors
Demonstrability Learner Support − 0.122 0.198 0.881 0.190
Factors Factors - > Results
Results − 0.156 0.250 0.652 0.259 Demonstrability
Demonstrability Factors
Factors - > Overall Results 0.049 0.344 0.438 0.331
Satisfaction Demonstrability
User Characteristics 0.516 0.058 1.879 0.033 Factors - > Overall
Factors - > Results Satisfaction
Demonstrability User Characteristics 0.040 0.414 0.235 0.407
Factors Factors - > Results
Demonstrability
Factors
number of items that can be used in an iterative evaluation of e-learning
in traditional undergraduate business school programmes.
utility model for e-learning, which takes into consideration the imper
atives of developing countries. Secondly, the study also adds to the
6.2. Implications for research sparse number of research work that considers the gender and the three
social categorical generations of X, Y, and Z. Thirdly, the study also adds
First, the study conceptualised and validated a user-satisfaction
10You can also read