Concise Sustainability Report - Delivering for a sustainable future - Aurizon

Page created by Howard Chan
 
CONTINUE READING
Concise Sustainability Report - Delivering for a sustainable future - Aurizon
2020 | Concise Sustainability Report
Delivering for a sustainable future
Concise Sustainability Report - Delivering for a sustainable future - Aurizon
Managing Director & CEO message
We are pleased to present our 2020 Concise                      driving further significant improvements by
Sustainability Report, demonstrating our                        continuing to invest in technology, processes
continued commitment in being open and                          and people.
transparent in relation to social, environmental
                                                                Despite the emergence of COVID-19 this
and economic aspects of our business.
                                                                year, we have continued to provide safe,
We have worked hard to build a stronger,                        reliable services to our customers, and
more sustainable business in recent years                       continued to support regional communities
to focus on our core capabilities of hauling                    where our people live and work. Our people
bulk commodities and managing the Central                       are to be commended for their commitment,
Queensland Coal Network.                                        dedication and discipline throughout this
                                                                challenging time.
While it is important to note that over the
past decade there has been long-term                            To read our full 2020 Sustainability Report,
improvement in our safety performance and                       visit www.aurizon.com.au/sustainability.
culture, we remain absolutely focused on
                                                                Andrew Harding
                                                                Managing Director & CEO

As Australia’s largest rail-based transport business, we transport more than 250 million tonnes of Australian commodities each year,
connecting miners, primary producers, and industry with international and domestic markets. Our operations primarily span Queensland,
New South Wales and Western Australia, and consist of three business units: Coal, Bulk and Network.

More than 80% of our employees and                              Local procurement                                             Indigenous businesses is one way that we can
their families live and work in regional                        Our supplier relationships extend from local                  have greater social value impact and support
Australia. By providing job opportunities                       operators through to international suppliers.                 the communities in which we operate.
to people in these regions, and engaging                        This gives us the flexibility to match                        As a part of our commitment within our
with local business and suppliers for                           supplier solutions to the specific needs                      Reconciliation Action Plan (RAP), we have
products and services, we can help to create                    of operational requirements or a project.                     committed to increasing our procurement
a more economically sustainable community.                      Through local procurement, we can                             spend year-on-year with Aboriginal and
In FY2020, we spent an estimated $1.3 billion                   generate employment opportunities and                         Torres Strait Islander-owned businesses from
with suppliers, a large percentage of which                     provide economic benefits at all levels of                    a nominated baseline of approximately
was in regional Australia (see figure 1).                       the community.                                                $2 million. We achieved this in FY2020 with
                                                                                                                              an overall spend of $5.38 million, an increase
                                                                Inclusion at Aurizon goes beyond what we                      of $1.29 million from FY2019. Maintaining a
    Regional Australia                                          do internally as an organisation. Our ability                 membership with Supply Nation2 is key to
    Council 2031                                                to create greater social value is reflective of               enabling us to achieve this commitment.
    During FY2020, we became a founding                         who we are. Increasing our spending with
    member of the Regional Australia
    Council 2031 (RAC2031), with other                          Figure 1 – Aurizon’s FY2020 regional spend
    leading Australian companies1, to give
    a greater voice and support to the
    future development of regional Australia.
    Established by the Regional Australia
    Institute (RAI), RAC2031 aims to use the
    collective knowledge and influence of the
    Council and corporate members to help
    transform the regions. The Council’s work
    will focus on four pillars – jobs, population,
    liveability, and people/leadership.

    We are already well invested in regional
    Australia, but there is more potential to
    unlock for the benefit of local communities
    and the Australian economy. We know,
    for example, that recruiting and training
    people locally means a greater connection
    with the local community and likelihood
    to stay. This also builds a talent pipeline of
    future leaders who live and work close to
    home and their communities.

                                                                        total spend >$100k in a location.

1 Telstra, KPMG, NBN, Prime Super, Expedia Group, Bendigo Bank, Commonwealth Bank, APPEA
  (The Australian Petroleum Production & Exploration Association) and TransGrid.
2 Supply Nation is an organisation that works to connect verified Indigenous businesses with paid corporate, government and
  not-for-profit members in every state and territory in Australia. Available: https://supplynation.org.au/.
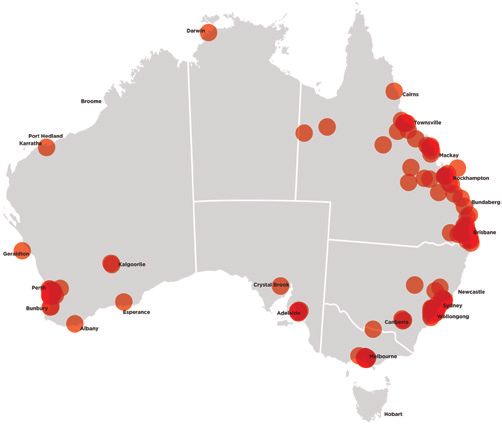
Concise Sustainability Report - Delivering for a sustainable future - Aurizon
Bulk
Our Bulk business includes haulage of a range of bulk commodities,                               future opportunities. For batteries, the global uptake of electric
such as iron ore, bauxite, alumina, base metals, grain and livestock.                            vehicles (EVs) is expected to drive demand for commodities
During FY2020, our Bulk business delivered 48 million tonnes of                                  such as nickel, cobalt, copper and lithium.
commodities. The business also provides supply chain services to
                                                                                                 In December 2019, the Queensland Government announced a
customers, including ballast cleaning, hook-and-pull, and handling
                                                                                                 $13.8 million New Economy Minerals Initiative to encourage
and stevedoring services.
                                                                                                 exploration for minerals such as copper, nickel and rare earth
Our business growth aspirations are underpinned by an optimistic                                 minerals used in emerging technologies, including EVs and
outlook for bulk commodity markets within Australia that are                                     renewable energy products3. Western Australia’s Future Battery
required to support the demands of the modern economy.                                           Industry Strategy also outlines the state’s plans to become a globally
In addition to commodities that are needed to build infrastructure,                              competitive producer and exporter of battery minerals through
exposure to growth markets of fertilisers and batteries will unlock                              increased exploration, innovation and investment4.

Future of coal
Aurizon’s role in Australia’s coal transportation                                                For thermal coal, 99%6 of Australian exports are destined for Asia
                                                                                                 (see figure 2), a region that now commands 81% of the seaborne
Our Company plays a significant role in Australia’s coal supply chain,
                                                                                                 market, increasing from just 35% in 19907. It is this region (rather than
with approximately two-thirds of Australia’s coal exports using
                                                                                                 global consumption) that is projected to use coal-fired generation
our below rail Network and/or carried by our above rail business.
                                                                                                 assets for a prolonged period, in addition to increased renewables
We also haul coal domestically for energy use.
                                                                                                 and other energy sources. Australian thermal coal export volume
Seaborne coal demand                                                                             to South-East Asia was 25 million tonnes in FY20208, more than
                                                                                                 double the volume from just five years prior.
Rather than global consumption, demand for Australian coal is
dependent on seaborne-traded markets, which are increasingly                                     Given the quality and the cost competitiveness of Australian coal,
concentrated in Asia. The differing properties of metallurgical                                  the opportunity remains for Australia — and therefore, our business
coal (for steel making) and thermal coal (for energy generation)                                 and our customers — to continue supplying the coal requirements
mean that there are distinct markets and, therefore, drivers of                                  of Asia.
future demand.

For metallurgical coal, steel-intensive growth in India is expected
to be the single largest driver of seaborne trade demand over
the coming decades. After surpassing annual production of more
than 100 million tonnes for the first time in 2017, India’s crude steel
production was 111 million tonnes in 20195. The Indian Government’s
National Steel Policy (2017) projects annual crude steel production
to reach 255 million tonnes by 2030–31.

Figure 2 – Export destinations for Australian coal9

Metallurgicalcoal
Metallurgical coal(FY2020)
                   (FY2020)                                                                       Thermalcoal
                                                                                                 Thermal  coal(FY2020)
                                                                                                               (FY2020)
 75
75                                                                                                75
                                                                                                 75         74mt
                                                                                                           74mt

                                                                           Total:177mt
                                                                          Total:  177mt                                                                                    Total:213mt
                                                                                                                                                                          Total:  213mt

 60
60                                                                                                60
                                                                                                 60

                                                                                                                        52mt
                                                                                                                       52mt
           50mt
          50mt

 45
45                                                                                                45
                                                                                                 45
                      40mt
                     40mt
                                                                                                             35%
                                                                                                            35%
                                  32mt
                                 32mt                                                                                              32mt
                                                                                                                                  32mt
 30
30                                                                                                30
                                                                                                 30
                                                                                                                        24%
                                                                                                                       24%                    23mt
                                                                                                                                             23mt
            28%
           28%
                                                                               19mt
                                                                              19mt
                       22%
                      22%                    16mt
                                            16mt                                                                                                                    16mt
                                                                                                                                                                   16mt
 1515                              18%
                                  18%                                                            1515                               15%
                                                                                                                                   15%                   13mt
                                                                                                                                                        13mt
                                                        10mt
                                                       10mt        10mt
                                                                  10mt                                                                         11%
                                                                                                                                              11%
                                                                                11%
                                                                               11%                                                                                   8%
                                                                                                                                                                    8%
                                              9%
                                             9%
                                                         6%          5%                                                                                   6%
                                                                                                                                                         6%                     3mt
                                                                                                                                                                               3mt
                                                        6%          5%
                                                                                                                                                                                 1%
                                                                                                                                                                                1%
 00                                                                                               00
           China
          China        India
                      India       Japan
                                 Japan       South Taiwan
                                            South   Taiwan Rest
                                                            Restof
                                                                 of Rest
                                                                     Restof
                                                                          of                                Japan
                                                                                                           Japan         China South
                                                                                                                        China   South Taiwan
                                                                                                                                       Taiwan Vietnam
                                                                                                                                               Vietnam Rest
                                                                                                                                                        Restof
                                                                                                                                                             of Rest
                                                                                                                                                                 Restof
                                                                                                                                                                      of
                                             Korea
                                            Korea            Asia
                                                            Asia     World
                                                                    World                                                       Korea
                                                                                                                               Korea                     Asia
                                                                                                                                                        Asia     World
                                                                                                                                                                World

3 Queensland Government Department of Natural Resources, Mines and Energy:                       5   World Steel Association, Statistics.
  New Economy Minerals. Available: https://www.dnrme.qld.gov.au/mining-resources/                6   Australian Bureau of Statistics (Customised report, June 2020).
  initiatives/new-economy-minerals.                                                              7   International Energy Agency, Coal Information (Data) (2020).
4 Government of Western Australia Department of Jobs, Tourism, Science and Innovation:           8   Australian Bureau of Statistics (Customised report, June 2020).
  Future Battery Industry Strategy. Available: https://www.jtsi.wa.gov.au/docs/default-source/   9   Australian Bureau of Statistics (Customised report, June 2020). Note: Due to rounding,
  default-document-library/future-battery-industry-strategy-wa-0119.pdf?sfvrsn=ccc7731c_6.           the sum of the individual elements may not equal the total value.
Concise Sustainability Report - Delivering for a sustainable future - Aurizon
Australia
      120                                            15%                                            57
                                                111
          ASEAN Member States (Selected)    109                                                53    6
        The future of seaborne metallurgical coal
      100                  +5.5%
                                   95
                                        101                                        50 51
                                                                                           48 6                                                                                                                                  The future of seaborne thermal coal
                                                                                        6
                            87 89and associated infrastructure development,
       Driven by urbanisation                                                42 43
                                                                                    6
                                                                                       The 6United Nations projects that India’s urbanisation rate will

                                                                                                                                                                                                                                                                          requirements are imported
       80              81                                               38
                  77
       the opportunity    remains  for India  and    10%
                                                    South-East  Asian   nations  7     increase  to 40% in 2030 compared to 34% in 2018, lifting the urban
              73                                                              7

                                                                                                                                                                                                                                                                             90% of coking coal
           69
00     to increase
     15,000         steel
                20,000    usage,
                            25,000as measured
                                       30,000    per   capita
                                                  35,000      (see
                                                               31  figure
                                                              40,000     645,000
                                                                           3).         population
                                                                                   50,000    55,000 from 461 million
                                                                                                       60,000        to 607 million14. While renewables and
                                                                                                                 65,000
       60
                                                                   26
       Crude steel production GDPhas grown     by 5.5%
                                        per capita       perUSD)
                                                      (PPP   annum
                                                               7      in India         other cleaner energy sources will undoubtedly grow in significance,
        over
        40    the past decade, driving demand for 5% metallurgical coal.
                                                                 7                                                                                                                                                               the age of the Asian coal-fired energy generation fleet and projected
        Faced with a structural deficiency of high-quality metallurgical coal10,                                                                                                                                                 capacity additions provides insight into the continuing demand for
         20                                                 25 20 32 36 37 44                                                                                                                                                    45 42 47 52
        India  turns to the seaborne market to meet demand (see figure 4).                                                                                                                                                       thermal coal (see figure 6). Figure 7 shows the International Energy
        Underpinned by shorter distances between mines and ports,                                                                                                                                                                Agency’s long-term projection for electricity generation in South-East
          0                                       0%
        as well as significant port and rail capacity exclusively servicing                                                                                                                                                      Asia under the Stated Policies Scenario. On average, Australia’s export
                                                 CY10

                                                                                                                                                           FY10
                                                                                     CY14

                                                                                                         CY16

                                                                                                                                   CY19
                                                                                                                           CY18

                                                                                                                                                                                              FY14
                                                                             CY13

                                                                                             CY15

                                                                                                                                                                                                                                 FY16

                                                                                                                                                                                                                                                                 FY19
                                                                      CY12

                                                                                                                 CY17

                                                                                                                                                                                                                                                        FY18
                                                                                                                                                                                   FY13

                                                                                                                                                                                                                         FY15
                                                                                                                                                                          FY12

                                                                                                                                                                                                                                                FY17
                                                           CY11

                                                                                                                                                                   FY11
        coal exports, Australia has comparatively low transportation and                                                                                                                                                         thermal coal has the highest energy content and relatively low ash
                        Crude steel5).
                                   production                    Domestic production                                                                                                                                             Imported volume
        port costs (see   figure                                                                                                                                                                                                 content,   when compared to most other major sources of seaborne
                                                                                                                                                                                                                                 thermal coal (see figure 8).

        Figure 3 – Apparent steel use (crude steel equivalent)                                                                                                                                                                   Figure 6 – Average age of coal-fired electricity capacity15
        per capita vs. GDP per capita11                                                                                                                                                                                                                                                                                                                          33 years
      120                                                                                                                                                                                          15%
                                                 1,200
                                                                                                                                                              109                     111
                                                                                                                                                     South Korea
      (crude steel equivalent) per capita (kg)

     100                                                          population                                     +5.5%                                 101
                                                                                                                                                95
                                                 1,000                                                               87           89                                                                                                                                                                      24 years
          80                                                                                        81
                                                                                     77                                                                                                            10%
                                                                        73                                                                                                                                                                                                                                                                    21 years
                Apparent steel use

                                                   69
                                                 800
          60
                                                                                    China                                                                                                                                                                                                                                  16 years
                                                                                                                                                     Japan
         40 600                                                                                                                                                              Germany 5%                                                        13 years                 13 years

           20 400                                                                                                                                                                             USA
                                                                                                                                                                      Australia
                        0                                        ASEAN Member States (Selected)                        0%
                                                 200
                                                 CY2010 CY2011 CY2012 CY2013 CY2014 CY2015 CY2016 CY2017 CY2018 CY2019
                                                     India
                                                                                                                     Crude steel production
                                             0            5,000 10,000 15,000 20,000 25,000 30,000 35,000 40,000 45,000 50,000 55,000 60,000 65,000                                                                                             China                    India                                          South Korea            Taiwan            Australia
                                                                                                                                                                                                                                                                                                           Japan
                                                                                                         GDP per capita (PPP USD)
                                                                                                                                                                                                                           0%                            Top five global thermal coal import nations (by volume)

        Figure 4 – India: coking (metallurgical) coal requirements12                                                                                                                                                             Figure 7 – International Energy     Agency (IEA) outlook
                                                                                                                                                                                                                                                          Indonesia: Export Average
                                                                                                                                                                                                                                                                                                                                                                       Australia:
                                                                                                                                                                                 57
                                                                                                                                                                                                                       10%       (Stated Policies Scenario) for electricity generation in                                                                           Export Average

                                                                                                                                           51
                                                                                                                                                                   53             6                                              South-East Asia, by source (TWh)16
                                                                                                                                                                                                                  Ash content

                                                                                                                             50
                                                                                                                                                      48            6                                                                                                                                                                                   South2,345TWh
                                                                                                                                                                                                                                                                                                                                                              Africa:
                                                                                                                              6            6                                                                        20%
                                                                                                                                                                                               requirements are imported

                                                                                             42                 43                                                                                                                                                                                                                                     Export Average
                                                                                                                                                      6
                                                                               38                                                                                                                                                                                                                                    China:                  2,009TWh
                                                                                                                7
                                                                                                                                                                                                  90% of coking coal

                                                                                             7                                                                                                                                                                                                                   Domestic Average
                                                 31                             6
                                                                                                                                                                                                                    30%                                                                                                  1,693TWh
                                                                  26
                                                 7                                                                                                                                                                                                                                                                                                              Increasing
                                                                  7                                                                                                                                                                                                                                     1,400TWh                                                  quality
                                                                                                                                                                                                                   40%                          India: Domestic Average
                                             25                   20           32            36                 37           44            45         42           47            52
                                                                                                                                                                                                                                                            1,045TWh

                                                                                                                                                                                                                                4,250    4,500                             4,750                         5,000        5,250          5,500           5,750       6,000          6,250
                                                                                                                                                                                                                                    684TWh
                            FY10                             FY11            FY12           FY13           FY14            FY15           FY16       FY17         FY18           FY19                                                                                                                   Energy (kcal/kg, gross as received)                                  +123%

                                                                                                                                                                                                                                                                                                                                                                    40%
                                                                                     Domestic production                                  Imported volume                                                                                                                                                                                      40%
                                                                                                                                                                                                                                                                                                                              41%
                                                                                                                                                                                                                                                                                                           43%
                                                                                                                                                                                                                                                                        40%
                                                                                                                                                                                                                                                27%

                                                                                                                                                                                                                                               2010                     2018                              2025f            2030f              2035f              2040f

                                                                                                                                                                                                                                                       Nuclear                       Oil                   Non-hydro renewables       Hydro            Gas           Coal

        Figure 5 – Land transport, port, and sea freight costs from major                                                                                                                                                        Figure 8 – Thermal coal energy and ash content17
        seaborne metallurgical coal export countries to India (USD/t)13
                                                                                                                                                                                                                                               0%
                                                                                                                                                                                       $71

                                                                                                                                                                                        $11                                                                                                                  Indonesia: Export Average
                                                                                                                                                                                                                                               10%                                                                                                              Australia:
                                                                                                                                                                                                                                                                                                                                                                Export Average
                                                                                                                                                                                       $12
                                                                                                                                                                                                                                 Ash content

                                                                                                                          $44                         $45                                                                                                                                                                                      South Africa:
                                                                                      $41                                                                                                                                                      20%
                                                                                                                                                                                                                                                                                                                                              Export Average
                                                                                                                           $8                         $14                                                                                                                                                          China:
                                                                                      $12                                                                                                                                                                                                                      Domestic Average
                                                                                                                           $11
                                                                                                                                                       $5                              $49                                                     30%
                                                  $20                                 $9                                                                                                                                                                                                                                                               Increasing
                                                                                                                                                                                                                                                                                                                                                         quality
                                                     $9
                                                                                                                          $26                         $26                                                                                      40%         India: Domestic Average
                                                     $4                               $20
                                                     $7                                                                                                                                                                                           4,250          4,500                          4,750      5,000     5,250        5,500      5,750      6,000       6,250
                                           Australia                                Canada                                Russia                 United States                   Mozambique                                                                                                           Energy (kcal/kg, gross as received)

                                                                                      Sea freight                          Port                  Land transport
                                                                                                                                                                                                                                 14 United Nations, Department of Economic and Social Affairs, Population Division (2018).
                                                                                                                                                                                                                                    World Urbanization Prospects: The 2018 Revision, online edition.
        10 Government of India, Coal Directory of India 2018-19 (page 8.1).                                                                                                                                                      15 Platts UDI Electric Power Plants Database (March 2020), capacity weighted.
        11 GDP (Purchasing Power Parity; international dollars) – World Bank (2018 data),                                                                                                                                           Australia included as reference.
           Population – World Bank (2018 data), Apparent Steel Usage & Apparent Steel Use per                                                                                                                                    16 International Energy Agency: World Energy Outlook (2019), Stated Policies Scenario.
           Capita – World Steel Association (2018 data). ASEAN Member States (Selected, based on                                                                                                                                 17 Australia (Export Energy/Ash By Mine): Wood Mackenzie Coal Supply Tool (Year: 2020, Data:
           data availability): Indonesia, Malaysia, Myanmar, Philippines, Singapore, Thailand, Vietnam.                                                                                                                             Q2 2020). Australia (Export Energy/Ash): Wood Mackenzie Coal Cost Curves (Year: 2020, Data:
        12 India Ministry of Coal, Coal Directory of India (multiple years), Provisional Coal Statistics                                                                                                                            May 2020). India (Domestic Energy/Ash): India Ministry of Coal Provisional Coal Statistics 2018-
           (2018-19). Note: Financial year is April to March. Total Requirements is the sum of Domestic                                                                                                                             19. China (Domestic Energy): IEA Coal Medium-Term Market Report 2016. China (Domestic Ash):
           Coking coal (Washed) Production plus Imported Coking Coal volume.                                                                                                                                                        Wood Mackenzie ‘China Limits Coal Ash Content’ (April 2017). Indonesia (Export Energy): Wood
        13 Wood Mackenzie Coal Cost Curves (Data: May 2020, Reference Year: 2020), Wood                                                                                                                                             Mackenzie Coal Cost Curves (Year: 2020, Data: May 2020). Indonesia (Export Ash): Argus (Indonesia
           Mackenzie Global Coal Markets Tool (Data: 2020 1H, Reference Year: 2020), Sea freight                                                                                                                                    5,000 benchmark), Methodology & Specifications Guide, April 2020. South Africa (Export
           export terminal assumptions: US – East Coast, Canada – West Coast, Australia – Hay Point.                                                                                                                                Energy): Wood Mackenzie Coal Cost Curves (Year: 2020, Data: May 2020). South Africa (Export
           Note: Due to rounding, the sum of the individual elements may not equal the total value.                                                                                                                                 Ash): Argus (Richards Bay 6,000 benchmark), Methodology & Specifications Guide, April 2020.
Scenario analysis: International Energy Agency                                                Based on Australia’s export volume in 2018 and assuming
                                                                                                 Australia’s participation in the trade market aligns with the
   One recommended disclosure from the Task Force on
                                                                                                 Stated Policies Scenario (including an estimated even split
   Climate-related Financial Disclosures (TCFD) is to consider
                                                                                                 of metallurgical and thermal coal export volume in 204022),
   different climate-related scenarios, including a 2°C or lower
                                                                                                 Australia’s export volume would be projected to reduce by 44%
   scenario. Although the Task Force does not recommend the
                                                                                                 in 2040 compared to 2018, representing a compound annual
   use of a specific scenario, we have drawn upon the best known
                                                                                                 growth rate of –2.6%. However, this projection for Australia takes a
   and most widely used scenarios produced by the International
                                                                                                 conservative approach, given an expected further preference for
   Energy Agency (IEA) in the annual release of the World Energy
                                                                                                 higher quality coal in such a carbon-constrained scenario.
   Outlook. This is used for comparison with our internal scenarios,
   as described in our full Sustainability Report.
                                                                                                 Aurizon’s resilience under an IEA Sustainable
   In addition to the (central) Stated Polices Scenario18, the IEA also                          Development Scenario
   publishes the Current Policies Scenario19 and the Sustainable                                 We consider the following points when assessing the resilience
   Development Scenario20. According to the IEA, the Sustainable                                 of our business under the IEA Sustainable Development Scenario:
   Development Scenario ‘charts a path fully aligned with the Paris                              1. Market share: We hold the view that in a carbon-constrained
   Agreement by holding the rise in global temperatures to well                                     environment, Australia could command a higher market
   below 2°C … and pursuing efforts to limit [it] to 1.5°C, and meets                               share given an expected preference for higher quality coal23
   objectives related to universal energy access and cleaner air’21.                                which Australia supplies. As such, we have modelled an
   In the (central) Stated Policies Scenario, the IEA projects global                               increased Australian market share (+10 percentage points
   coal trade to reduce by 7% in 2040 compared with 2018:                                           compared to estimated market share of both metallurgical
                                                                                                    and thermal coal from the estimated Stated Policies Scenario
                  For global metallurgical coal trade, the volume projection
                                                                                                    volume in 2040). In this projection, Australia’s export volume
                  increases by 16% in 2040 compared with 2018, representing
                                                                                                    would reduce by 112mtce in 2040 (–32% compared to 2018).
                  a compound annual growth rate of 0.7% across the period.
                                                                                                    This represents a compound annual growth rate of –1.7%
                  For global thermal coal trade, the volume projection reduces
                                                                                                    across the period, as illustrated as Aust exports: Sustainable
                  by 15% in 2040 compared with 2018, representing a compound
                                                                                                    Development (adjusted market share) in figure 9.
                  annual growth rate of –0.8% across the period.
                  Australia’s export volume is projected to increase by 18%                      2. Metallurgical coal: Two-thirds of coal volumes transported
                  in 2040 compared with 2018, representing a compound                               across the Central Queensland Coal Network (CQCN) is
                  annual growth rate of 0.8% across this period.                                    metallurgical coal. Given the limited viable alternatives in
                                                                                                    steel production, the Sustainable Development Scenario
   In the Sustainable Development Scenario, the IEA projects global
                                                                                                    projects more resilience in metallurgical coal trade (compared
   coal trade to reduce by 62% in 2040 compared with 2018.
                                                                                                    to thermal coal). When this figure is combined with the
   As the Sustainable Development Scenario (and Current Policies                                    expectation of increased market share for Australia export
   Scenario) do not provide country-level trade projections, we have                                volume, we can expect the CQCN to be resilient in a scenario
   applied market share assumptions for Australia in our analysis                                   of reduced global coal demand.
   (see figure 9).

   Figure 9 – Projected Australian export volumes under IEA scenarios24

                               600mtce                                                                                         CAGR:
                                                                                                                              to 2040
                               500mtce                                                                                          +1.6%
                                                                                                                                                      Aust exports: Current Policies
     Australia Export Volume

                                                                                                                                                      Aust exports: Stated Policies
                               400mtce                                                                                          +0.8%
                                                                                                                                                      Aust exports:
                                                                                                                                                      Sustainable Development
                               300mtce
                                                                                                                                                      Aust exports:
                                                                                                                                -1.7%                 Sustainable Development
                               200mtce                                                                                          -2.6%                 (adjusted market share)

                               100mtce

                                 0mtce
                                         2020                                   2030                                    2040

18 The Stated Policies Scenario incorporates today’s policy intentions and targets. Previously   21 International Energy Agency (IEA), World Energy Outlook (2019).
   known as the New Policies Scenario, it has been renamed to emphasise that it considers        22 Although the coal type split of Australian export volume in 2040 is not disclosed in the
   only specific policy initiatives that have already been announced (International Energy          World Energy Outlook (2019), the IEA noted in the World Energy Outlook (2018) that in
   Agency, World Energy Outlook (2019).                                                             2040 the split between the two coal types is roughly even.
19 The Current Policies Scenario shows what happens if the world continues along its present     23 For metallurgical coal, higher quality coal is typically considered to have low Coke Reactivity
   path, without any additional changes in policy (International Energy Agency, World Energy        Index (CRI) results and a high Coke Strength after Reaction (CSR). For thermal coal,
   Outlook (2019).                                                                                  higher quality coal is generally considered to be high energy, low ash and low sulphur.
20 The Sustainable Development Scenario maps out a way to meet sustainable energy goals          24 IEA World Energy Outlook (2019), Aurizon analysis. Note: Where individual year projections
   in full, requiring rapid and widespread changes across all parts of the energy system.           are not published in the IEA World Energy Outlook, figures have been extrapolated
   This scenario charts a path fully aligned with the Paris Agreement (International Energy         (straight line).
   Agency, World Energy Outlook (2019).
Safety
During FY2020, we updated our enterprise safety strategy to focus on and prioritise                                           Figure 10 – Safety in Action
improvements to our safety systems and culture, and to achieve our safety goal of protecting
ourselves, each other and our communities. This strategy, Safety in Action, leverages the
principles of our existing programs, and incorporates various operational safety initiatives,
creating a newly aligned safety focus across Aurizon.

The centrepiece of the strategy is Safety in Action (see figure 10), which identifies the three                                   Well-designed,                  Executed
key components of our work that enable us to deliver safe outcomes:                                                                planned and                   by engaged
                                                                                                                                    resourced                    and enabled
    Well-designed, planned and resourced work: we take the time to design and plan our                                                 work        Delivering      people

    work, using clear and simple practices, with the right people and tools to deliver the work.                                                    Safely
    Executed by engaged and enabled people: we take accountability, trust each other,
    promote curiosity, and have the capability and competence to support each other.
    Informed by risk: we understand the risk, we manage the risk, we know if our controls
    are effective, and we share what we learn.

Supporting this change is an update of our Safety Value statement to ‘We know safe, we choose                                                      Informed by
safe’, supporting decision-making and reinforcing our personal accountability for safety.                                                               risk

Safety in Action will drive our focus as we engage with our teams, identify and execute
improvements to our safe systems of work, and how we report on safety performance.

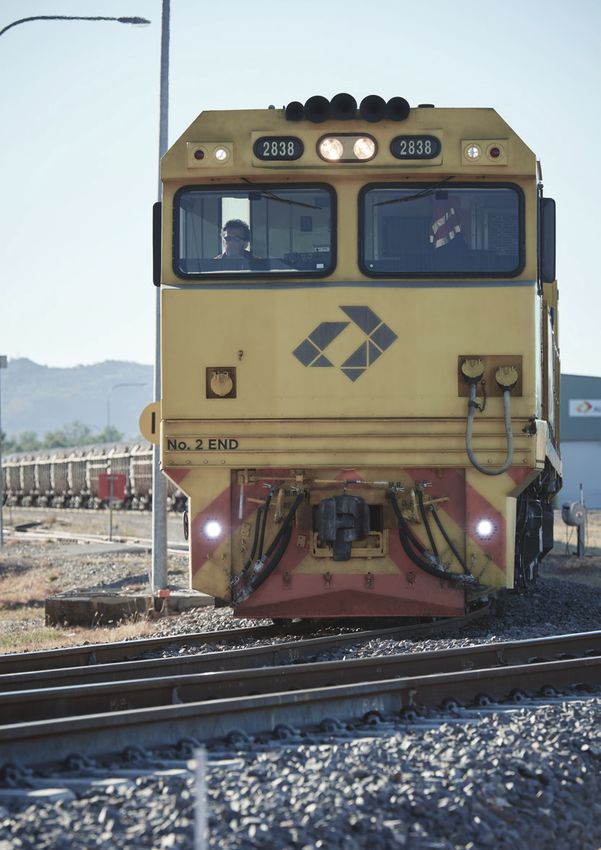
Environment                                                                                                            Benefits of rail freight
                                                                                                                          Environment: Road freight produces
As a rail operator with a large operational footprint we have a role in helping                                           16 times as much carbon pollution as rail
maintain a sustainable environment in our local communities. Our inaugural                                                freight per tonne kilometre26.
Climate Strategy and Action Plan25 sets out our actions and long-term targets                                             Safety: Rail transport is a far safer mode of
in reducing our emissions. It focuses on the role we can play in decarbonising                                            transport than road, with the freight volume
Australia’s key export supply chains while continuing to support the current                                              carried by one freight train equivalent to the
and future global competitiveness of our customers.                                                                       volume carried by 150 semi-trailer trucks27.
                                                                                                                          Over the course of a year, the freight task
We adopt an evidence-based approach to environmental management.
                                                                                                                          carried by one train removes the need for
Our continued focus is on reducing our environmental footprint by improving
                                                                                                                          thousands of truck journeys on our roads,
resource use and energy efficiency, using cleaner fuels, operating electric
                                                                                                                          reducing congestion and improving safety.
locomotives as part of our fleet, and promoting rail over road freight.
                                                                                                                          Productivity: Significant economic and
Aurizon directly advocates for policy actions to increase the use of rail freight                                         productivity gains are achievable where there
on key corridors. Rail offers productivity and environmental benefits and is far                                          are large volumes of freight and/or where the
safer than road transport.                                                                                                freight is carried over longer distances.

People
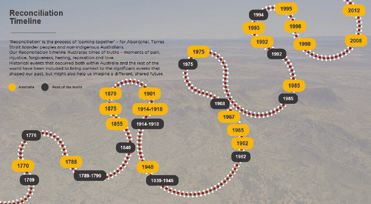
Walking together to achieve reconciliation                                                           commitment of fostering respect in line with our RAP. Over 90%
Fostering respect is an important pillar of our RAP. Part of our                                     of the workforce took the program within nine weeks, a testament
commitment included developing and rolling out an internal Cultural                                  to the creative and stimulating learning experience.
Awareness Online Learning Experience during FY2020.

Our vision was to create an experience beyond simply learning.
For us, this was an experience that employees could engage
with that didn’t involve measuring their cultural awareness.
Rather, we designed a program that fosters respect, connection and
understanding. The interactive learning experience uses language,
messaging and tone that not only connects emotionally with people,
but also stimulates curiosity and insight across our Australian depots.
We knew that to create lasting change, the program should be
built on themes inspired by our Indigenous Reference Group (IRG).
The result – a product developed by our people, for our people.
It has set a new benchmark for how we engage employees in learning.

By ensuring the IRG are the custodians of the Cultural Awareness                                       Aurizon’s Cultural Awareness Online Learning Experience
Online Learning Experience, this helps drive the delivery and

25 To be published in October 2020
26 Deloitte Access Economics 2017 Value of Rail: The Contribution of rail in Australia. Available:
   https://www2.deloitte.com/content/dam/Deloitte/au/Documents/Economics/deloitte-au-
   economics-value-rail-contribution-australia-161117.pdf
27 NSW Government: Consultation Paper: Clean Air for NSW, 2016.
You can also read