Convolutional Neural Network Architectures to Solve a Problem of Tuberculosis Classification Using X-Ray Images of the Lungs
←
→
Page content transcription
If your browser does not render page correctly, please read the page content below
Hindawi
Journal of Nanomaterials
Volume 2022, Article ID 2509830, 8 pages
https://doi.org/10.1155/2022/2509830

Research Article
Convolutional Neural Network Architectures to Solve a
Problem of Tuberculosis Classification Using X-Ray Images of
the Lungs

          Jalawi Alshudukhi ,1 Saud Aljaloud ,1 Talal Saad Alharbi ,1 and Solomon Abebaw                                                 2

          1
              College of Computer Science and Engineering, Department of Computer Science, University of Ha’il, Saudi Arabia
          2
              Department of Statistics, Mizan-Tepi University, Ethiopia

          Correspondence should be addressed to Solomon Abebaw; solomonabebaw@mtu.edu.et

          Received 6 January 2022; Accepted 26 January 2022; Published 4 February 2022

          Academic Editor: Palanivel Velmurugan

          Copyright © 2022 Jalawi Alshudukhi et al. This is an open access article distributed under the Creative Commons Attribution
          License, which permits unrestricted use, distribution, and reproduction in any medium, provided the original work is
          properly cited.

          Disease detection, diagnosis, and treatment can all be done with the help of digitalized medical images. Macroscopic medical
          images are images obtained using ionizing radiation or magnetism that identify organs and body structures. In recent years,
          various computational tools such as databases, distributed processing, digital image processing, and pattern recognition in
          digital medical images have contributed to the development of Computer-Aided Diagnosis (CAD), which serves as an auxiliary
          tool in health care. The use of various architectures based on convolutional neural networks (CNNs) for the automatic
          detection of diseases in medical images is proposed in this work. Different types of medical images are used in this work, such
          as chest tomography for identifying types of tuberculosis and chest X-rays for detecting pneumonia to solve the same number
          of classification problems or detect patterns associated with diseases. Finally, an algorithm for automatic registration of
          thoracic regions is proposed, which intrinsically identifies the translation, scale, and rotation that align the thoracic regions in
          X-ray images.

1. Introduction                                                          rithms. Segmentation methods such as Cuenca [1], image
                                                                         processing techniques such as Gaussian Laplacian, and local
By analyzing medical images that contain a representation of             binary pattern (LBP) [2], to name a few, are some of the
the human body or parts of it, diseases can be detected, diag-           most widely used algorithms. Convolutional neural net-
nosed, and treated. Even when medical history, vital signs,              works are a type of deep learning model that is currently
and laboratory tests are used to confirm diagnoses, medical               one of the most successful approaches to medical image
images can help improve diagnoses made by highly trained                 analysis (CNN). Efficient models called Mobile Nets for
medical specialists. Unfortunately, factors such as the                  mobile and embedded vision applications. Mobile networks
patient’s position, the image’s poor quality, or the doctor              are based on an optimized architecture that uses separable
in charge of capturing or interpreting the data’s lack of                depth convolutions to build light and deep neural networks,
expertise can lead to a misdiagnosis, resulting in the patient’s         two simple global parameters that efficiently trade latency
death. In recent years, digital images have enabled the devel-           and precision. These hyperparameters allow the model
opment of systems for computer-assisted diagnosis, which                 builder to choose the correct size model for their application
serves as an auxiliary tool in medicine, reducing costs and              based on the problem’s constraints. There are Mobile Nets in
allowing for more efficient disease detection through pattern              many applications and use cases, including object detection,
recognition. Some systems can automatically detect specific               classification, face attributes, and large-scale geolocation [3].
diseases in medical images. They extract significant patterns                 This work proposes the use of convolutional neural net-
associated with diseases using a variety of sophisticated algo-          work architectures for automatic disease detection in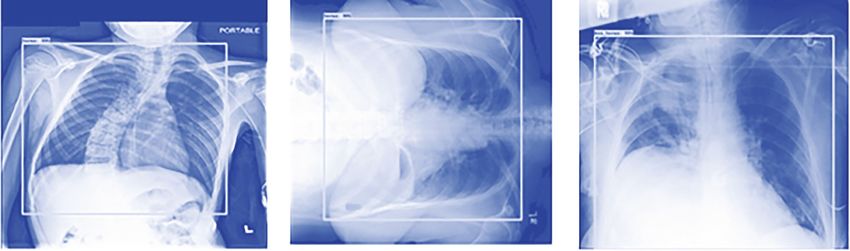
2                                                                                                      Journal of Nanomaterials

medical images and a preprocessing architecture that uses        tional neural networks and principal component analysis
neural networks to perform image registration. Under-            (PCA) to record chest images. The results of pneumonia
standing a convolutional neural network can contribute           detection on unregistered images are then compared to reg-
to automation, reduce processing time and cost, and add pre-     istered images. The evaluation shows a marginal improve-
processing stages, bringing machine learning methods and         ment in the classification precision when the proposed
computer-aided diagnostic systems to the forefront. CNNs         method aligns the images. Medical images allow you to
can reach up to 96% likelihood (for this reason, they are cur-   observe patterns that depend on certain aspects, such as
rently used by Google and Facebook) in such a way that           the angle at which the image was taken, the age of the
understanding a convolutional neural network can contrib-        patient, and the quality of the image. For this reason, the
ute to automation and reduction in processing time and cost,     registration process in chest X-ray images is carried out.
and adding preprocessing stages brings machine learning          The result of a registration process is to obtain the parame-
methods, and computer-aided paper explains the essential         ters of the translation, scaling, and rotation transformations
components of a CNN architecture. It examines how differ-         that align the images. Convolutional neural networks have
ent parameter variations affect the performance of the disease    local maximum clustering layers that allow a network to be
detection task. The application of computational tools and       spatially invariant to the position of features. However, due
mathematical methods allows the analysis, recognition, and       to the typically small spatial support for maximum cluster-
classification of patterns so that these methods can be applied   ing (e.g., 2 × 2 pixels), this spatial invariance is only realized
to the detection of diseases through the analysis of macro-      through a deep hierarchy of maximum clustering and con-
scopic medical images. Due to the great success and promis-      tributions and intermediate feature maps (convolutional
ing results obtained from classifying images, there is           layer activations). However, CNNs are not invariant to sig-
currently an interest in using deep learning techniques in       nificant transformations of the input data [6]. This limita-
medical imaging. Although not a new invention, convolu-          tion of CNNs is because it only has a predefined and
tional neural networks [4] can classify and identify specific     limited grouping mechanism to deal with variations in data
patterns in images. We now see many CNN-based models             space [7]. For this reason, it is proposed to carry out the
that achieve cutting-edge results in classification, location,    registration process in medical images, specializing in chest
segmentation, and task action recognition, among others          X-rays, to later train the convolutional neural network model
[5]. Following that, work on the classification task in medical   Inception V3 specializing in the classification of images and
images to detect pneumonia is shown, followed by work on         see how the results of images without process regarding
image registration using convolutional neural networks           images processed with our proposal. To carry out this pro-
and, finally, chest radiograph registration. This research uses   cess, digital image processing, training specialized convolu-
a convolutional neural network architecture model to solve a     tional neural networks in detection, and the PCA method
tuberculosis classification problem using CNN architecture        that allows adjusting the orientation of the images are
to register on chest X-ray images.                               proposed.

2. CNNs on Medical Image Recording and                           3.1. Basis of X-Ray Images of Healthy and Pneumonia
   Classification Issues                                         Subjects. The Radiological Society of North America (RSNA)
                                                                 is an international society of radiologists, physicians, and
Image registration is the process that seeks the geometric       other professionals with more than 54,000 members from
transformation to align two images in the best possible cor-     146 countries worldwide. This work uses a database pro-
respondence; this section focuses on a registration proposal     vided by RSNA [8], which contains a set of images showing
using CNNs and principal component analysis. The results         the presence of pneumonia and features showing abnormal
can be seen visually in the previous section. The proposed       lungs. The action of the registry is conditioned to samples
method eliminates unnecessary information and better             of said images for the realization of this section.
delimits the thorax region. Regarding the evaluation regard-
ing the classification of types of pneumonia in X-ray images,     3.2. Classification of Pneumonia. The worldwide research on
although the improvement is marginal by preprocessing the        the analysis of medical images using convolutional neural
images with the registration method, the results suggest that    networks is a proposal that shows high-impact results.
it is necessary to improve the preprocessing to reveal the       Stanford in 2017 presents a CheXNet convolutional neural
physiological details of the patterns associated with each       network: detection of pneumonia in chest radiographs with
type of pneumonia.                                               deep learning [9], analyzing images and diagnoses of
                                                                 patients; this translates into an accuracy of 85% using a com-
3. Registration of the Chest in X-Ray Images                     parison between the tool and a doctor. The research focused
   Using CNN                                                     on detection shows that current tools are helpful but still fall
                                                                 short of optimal automatic detection (reducing error in
Image registration is the geometric transformation process       detections).
to align two images in the best possible correspondence. This
process can be applied in medical imaging to improve classi-     3.2.1. Registration in Images Using Convolutional Neural
fication algorithms or automatic detection of disease-            Networks. To complement convolutional network process-
associated patterns. This section proposes using convolu-        ing, a Google DeepMind group proposed adding a space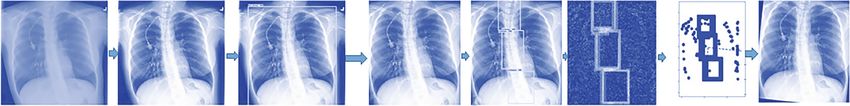
Journal of Nanomaterials                                                                                                                  3

                                                                                                             600

                                                                                                             500

                                                                                                             400

                                                                                                             300

                                                                                                             200

                                                                                                             100

                                                                                                               0

                                                                                                             -100   G               H
 A                  B                   C                    D               E               F                      0   200   400

Figure 1: Chest registration process in X-ray images using CNN: (a) incoming image, (b) preprocessing, (c) detection, (d) cutout, (e) second
detection, (f) detection boxes, (g) PCA, and (h) final picture.

                                                                            The automatic article extraction of checkpoints for chest
 Table 1: Chest and spine screening results using MobileNet 1.0.        X-ray images and elastic registration [21] of the thorax pre-
                                                       Number of
                                                                        sents an algorithm for detecting control points and the
Model                   Lost    Detection time                          extraction of the region of interest (ROI) for X-ray images.
                                                     training steps
                                                                        Using the mean, variance, and difference, a search strategy
         Chest screening results using MobileNet 1.0
                                                                        is used to find the control points and spatial intensity distri-
MobileNet 1.0     0.6694         20.258 sec          4573               bution in chest X-ray images [22].
         Spine screening results using MobileNet 1.0
MobileNet 1.0     1.0178         13.568 sec          33732              3.3. Proposed Registration Algorithm. This section describes
                                                                        the formulation of the specialized registration process for
                                                                        chest X-ray imaging. The mechanism of the registration pro-
transformer module in 2015. The basic idea behind this mod-             cess is divided into seven stages, as shown in Figure 1.
ule is to transform the input image so that subsequent layers               The first stage is the preprocessing of the images; this
can classify the examples more quickly. The authors propose             includes the equalization of the images and readjustment
changing the image before entering the relevant convolution             of the size. Subsequently, it is observed in the diagram that
layer rather than changing the central CNN architecture. This           there are two detection processes: one of the thorax and
module focuses on posture normalization (where the object is            the other of the spinal column. These processes are carried
tilted or scaled) and spatial attention (drawing attention to the       out using the MobileNet 1.0 convolutional network model.
correct object in a multi-object image). To learn to be invari-         The first detection focuses on the rib cage; this model was
ant to images with different scales and rotations, traditional           trained with 140 images; 42 images were used for testing
CNNs require many training examples.                                    and 98 for training. The training results were as shown in
                                                                        Table 1.
3.2.2. Record of Chest Radiographs. Reference [10] investi-                 The convolutional neural network retraining results can
gates and compares the performance of various registration              be seen in Figure 2.
algorithms based on different methods of feature extrac-                     With the results of the detection, a cropping operation is
tion and comparison in chest radiographic images. The                   carried out, readjusting the dimensions of the images, which
combination of three descriptors of points of interest (SIFT,           is equivalent to finding the translation and scaling parame-
an algorithm used in artificial vision to extract relevant char-         ters of some parametric models of feature-based registration
acteristics from images that can later be used in object recog-         (thus, the proposed model is partially size-invariant) image
nition, motion detection, image registration, and other                 or if it is moved. A new detection process was applied to
tasks), SURF (an algorithm capable of obtaining a visual rep-           the resulting images with a CNN model trained to detect
resentation of an image and extracting detailed and specific             the spine; the model was trained with 140 images. The train-
information from the content), and ORB (a fast and robust               ing results are presented in Table 1.
local detector of characteristic) is studied in particular. These           The convolutional neural network retraining results can
were used as feature detectors, and the SIFT and SURF                   be seen in Figure 3. The information provided by the spine
methods were used separately for the correspondence                     detection tool is rectangular boxes with regions of the spine
search. The tests were carried out on chest X-ray images                in the evaluated image. A color selection process allows the
obtained from actual patients at various times. When the                point cloud of the perimeter of each rectangle to be found.
SIFT and SURF descriptors are combined for POI extrac-                  Thus, from the point cloud coordinates, the principal com-
tion and the SIFT algorithm is used for feature comparison,             ponent analysis (PCA) is performed to locate the eigenvector
the highest registration precision is achieved [11–19]. We              with the highest associated eigenvalue to calculate the angle
present a method to detect rotated lungs on chest radio-                of rotation of the column in the rib cage.
graphs for quality control and to increase automated anom-                  The principal component analysis is one of the critical
aly detection in automatic detection of rotation on chest               tools of statistical data analysis; it rotates the axes on which
radiographs using the primary measure of rib orientation                the dimensions with which data are described are defined.
for quality control. The method increases automated anom-               The axes are selected so that the variance of the residuals
aly detection by calculating a primary measure of rib orien-            (the dispersion of the data points with respect to the axes
tation using a generalized line histogram technique for                 defined by the principal components) is minimized. In this
quality control [20].                                                   way, the original data is projected in subspaces in which its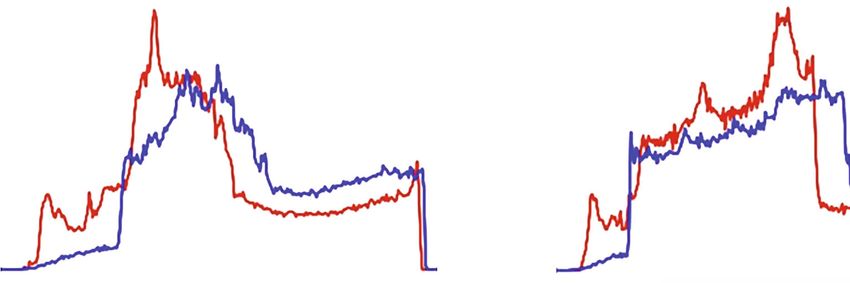
4 Journal of Nanomaterials
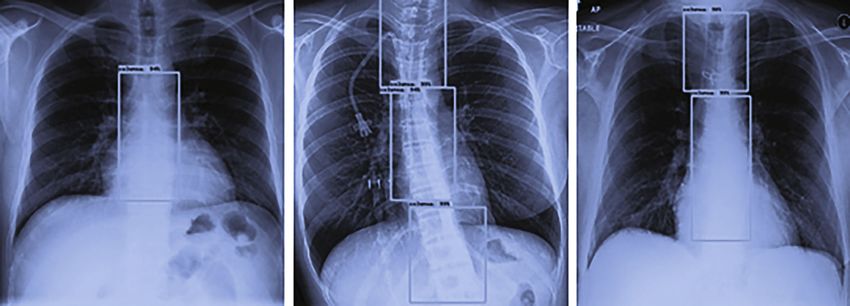
Figure 2: Result of chest cage detection using CNN.
Figure 3: Result of column detection using CNN.
Table 3: Results of the detection of the thorax and spine in 1000
Table 2: Results of chest and spine detection on rotated images
images using MobileNet 1.0.
using MobileNet 1.0.
Correct detection Correct detection
Correct No Images
Image type Erroneous detection for the chest cage for the spine
detection detection
With pneumonia
With pneumonia 72 8 0 100% 75.2% (376 images)
(500 images)
No pneumonia 73 3 4
Without pneumonia
Total images 145 11 4 100% 88.8% (444 images)
(500 images)
Spine Overall correct
With pneumonia 10 0 70 percentage of 100% 82% (820 images)
No pneumonia 10 0 70 1000 images
Total images 20 0 140
Table 4: Chest and spine detection results in 1000 images using
variance is maximized. Typically, only the first principal MobileNet 1.0.
components remain, sufficient to represent the variability Without detecting Without detecting
that exists in the data, which will allow us to reduce Images
chest cage the spine
dimensionality.
With pneumonia
Let fxi , yi g be the point cloud coordinate matrix of the 0% 24.8% (124 images)
(500 images)
perimeter of the detected regions with backbone portions,
Without pneumonia
for i = 1, 2, ⋯, N detected points. 0% 11.2% (56 images)
(500 images)
Next, we present the PCA algorithm to detect the axis
corresponding to the spine. The PCA is calculated as follows. Total error 0% 18% (180 images)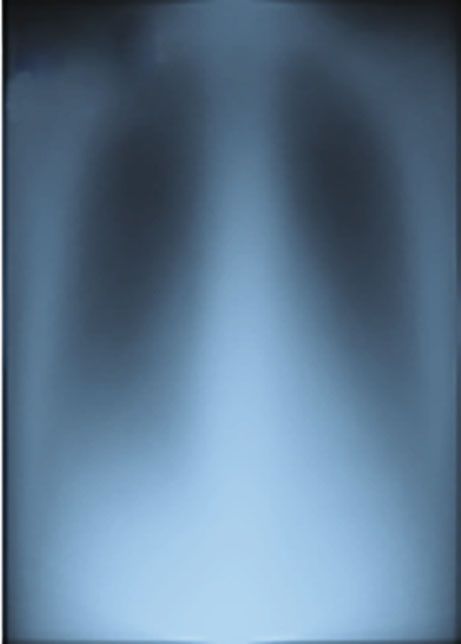
Journal of Nanomaterials                                                                                                                                 5

                                 Table 5: Results of pneumonia classification using Inception v3 & MobileNet v1.

Images                             Number of training steps                       Cross entropy         Validation accuracy         Final testing accuracy
                                                      Results of pneumonia classification using Inception v3
Without processing                                  4000                     0.156805               83.0% (N = 100)                   74.6% (N = 114)
Processed                                           4000                     0.212796               78.0% (N = 100)                   77.0% (N = 87)
Processed resized                                   4000                     0.228533               76.0% (N = 100)                   73.1% (N = 104)
                                                    Results of pneumonia classification using MobileNet v1
Without processing                                10,000                    0.026431             86.0% (N = 100)                      74.6% (N = 114)
Processed                                         10,000                    0.105245             64.0% (N = 100)                      72.4% (N = 87)
Processed resized                                 10,000                    0.238091             78.0% (N = 100)                      75.0% (N = 104)

   (1) Midpoints:
                                                    "        #
                                                        xi
                             "         #
                                 mx           N
                                                        yi                        ð1Þ
                                           =〠
                                 my           i=1       N

   (2) Covariance matrix:
       "                                                                    #
  1 N ðx i − m i Þ           ð x i − m x Þ ðx i − m x Þ            x i − my
C= 〠
  N i=0 ðxi − mi Þ             yi − my ðyi − mx Þ                   y i − my
                                                                                  ð2Þ
                                                                                                        (a)                             (b)

   (3) Decomposition of eigenvalues:                                                     Figure 4: (a) Average image of 500 raw samples. (b) Average chest
                                                                                         image recording samples by the proposed method using CNNs.
                         "         #          "         #
                             dxi                  dxi
                     C                 = λi                 i = 1, 2              ð3Þ        There are no incorrect images in this table, as you can
                             dyi                  dyi
                                                                                         see. The first neural network oriented to the detection of
                                                                                         the thorax cage is found to be invariant to image rotation
                                                                                         in this evaluation; as a result, the results are 145 images with
    λi is an eigenvalue, and ½dxi dyi T is the corresponding
                                                                                         a correct detection rate of 160. The neural network to detect
eigenvector. The eigenvalue measures the wealth of informa-
                                                                                         the spinal column, on the other hand, only manages to
tion in the orthogonal direction. Assuming that λ1 ≥ λ2 ,
                                                                                         detect 20 images out of 160, indicating that the convolu-
then, ½dxi dyi T is the main direction. The squares formed                              tional neural network has difficulty detecting the spine due
in Figure 1(g), and points are the set of pixels used to calcu-                          to the cloudiness of the images. The second evaluation is car-
late the eigenvectors, in black dotted lines, the obtained                               ried out with a total of 1000 images, 500 images showing
eigenvectors. Once the main direction is obtained, the image                             pneumonia, and 500 images without pneumonia. Table 3
is rotated. The leading eigenvector coincides with the Carte-                            shows the results of the evaluation of the CNNs retrained
sian axis, resulting in the spine’s alignment after processing                           to detect the thorax cage and the spine with said images.
the entire image base.                                                                       As can be seen in the previous table, the neural network
3.4. Evaluation of CNNs Focused on Detection. The evalua-                                does not mark any error to detect the thorax cage; on the
tion of the convolutional neural networks focused on the                                 other hand, the neural network to detect the spine shows
detection is carried out in two ways; the first focused on                                an 82% percent success rate.
the detection evaluating 20 images, 10 with pneumonia
and 10 without pneumonia; these images were rotated in                                   3.5. Evaluation of the Registration Algorithm. The evaluation
45°, 90°, 135°, 180°, 225°, 270°, and 315°. The total number                             of the proposed method is carried out with a total of 1000
of images produced was 160; Table 2 shows the results of                                 images: 500 chest X-ray images showing pneumonia and
the neural networks focused on detecting the thorax cage.                                500 images without pneumonia. When evaluating the CNNs
    Sample images are shown, illustrating the results of the                             MobileNet 1.0 models trained for detection, the following is
table above. The same test was performed to detect the spine                             observed.
with the same images of the previous test; the results are                                   In the images without pneumonia, the chest and spine
those shown in Table 2.                                                                  detectors have a detection rate in 100% of the images.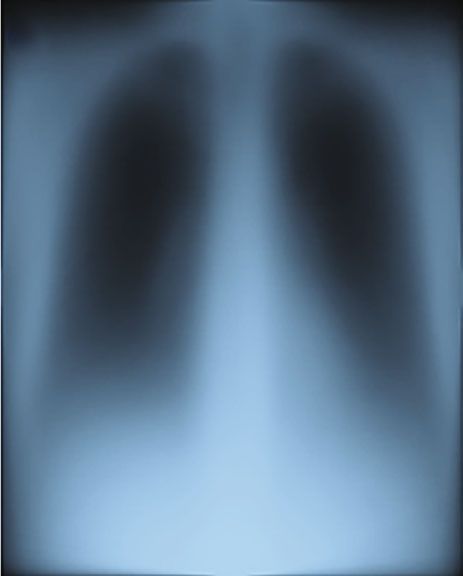
6                                                                                                                                Journal of Nanomaterials

                         1600
                                                 Avg. raw image                                       1200                          Avg. raw image
                         1400
                         1200                                                                         1000
                                                          Avg. processed

                                                                                 Lighting intensity
    Lighting intensity

                                                                                                                                           Avg.
                         1000                             image                                        800                                 processed
                          800                                                                                                              image
                                                                                                       600
                          600
                                                                                                       400
                          400
                          200                                                                          200

                           0                                                                             0
                                0   50     100       150          200      250                               0   50   100       150        200         250
                                           Number of pixels                                                           Number of pixels

                                         Figure 5: Comparative histogram between the average images with pneumonia.

However, only in the pneumonia images did the neural net-                        from our method without readjusting the sizes (which vary
works not detect the spine in several images; below, the                         depending on the size of the box. thoracic), and the third
errors are shown in Table 4.                                                     resizes all the resulting images by our method to a size of
    As can be seen in the previous table, the neural network                     320 × 400 pixels. Table 5 shows the results of this evaluation.
does not mark any error to detect the chest cage; on the                             When retraining the MobileNet 1.0 model, the data
other hand, to detect the spine, it shows an eighteen percent                    resulting from the training in the test images are shown in
error when patients have pneumonia. With these 1000                              the last column; the final accuracy in the test images is the
images processed using the proposed algorithm to record                          most critical metric of neural networks. A slight improve-
chest radiographs, three evaluations are carried out: the first                   ment of 0.4% can also be observed in this test with the
two focused on the training of different pretrained models                        resized processed images.
that allow the classification of images; in this way, we mea-
sure the improvement in the performance of the CNNs,
                                                                                 3.5.3. Third Evaluation. This evaluation analyzes the result
and the third evaluation analyzes the result of the average
                                                                                 of the average sum of 500 images that were not aligned with
sum of the images without and with the registration process.
                                                                                 our method and 500 images that, if recorded, the images
The first two evaluations compare the results of training
                                                                                 were evaluated included pneumonia. As shown in Figure 4
CNNs models with processed and unprocessed images,
                                                                                 on the left side, the average sum of the original images with-
showing the existence of improvements if they exist. The
                                                                                 out the registration process is shown. On the right side, it is
third evaluation analyzes the resulting images using a sum
                                                                                 shown that when the images are recorded, the thorax
of images; in this way, the histograms of the raw and proc-
                                                                                 occupies a greater area in the average image, eliminating
essed images are compared.
                                                                                 unnecessary information, which allows better detection.
3.5.1. First Evaluation. The first evaluation focuses on                          The dark areas that correspond to the lungs are more evi-
retraining the Inception v3 model in order to classify images                    dent. Average image of 500 raw samples and average image
with and without the presence of pneumonia. This model                           of the thorax recording the samples by the proposed method
was retrained in three different ways; the first was with                          using CNNs are shown in Figure 4.
images that are not processed by our registration method,                            The following histogram shows the frequency in pixels
the second was with the images resulting from our method                         with which the different intensity levels appear in the pre-
without readjusting the sizes (which vary depending on the                       vious images and the intensity level is in the range from 0
size of the box. thoracic), and the third resizes all the result-                to 255, where the value 0 represents the black color and
ing images by our method to a size of 320 × 400 pixels.                          255 the color white; observing the histogram, it is appre-
Table 5 shows the results of this evaluation. When retraining                    ciated how the illumination intensity is provided more
the Inception v3 model, the data resulting from the training                     equitably in the average image of the images processed
is the columns, and the final accuracy of the tests is our pri-                   by the registration algorithm. The following histogram
mary metric. A marginal improvement of 3% can be seen in                         shows (Figure 5) the frequency in pixels with which the
the processed images in this test without resizing.                              different intensity levels appear in the previous images
                                                                                 and the intensity level is in the range from 0 to 255,
3.5.2. Second Evaluation. The second evaluation focuses on                       where the value 0 represents the black color and 255 the
retraining the MobileNet v1 model to classify images with                        color white; observing the histogram, it is appreciated how
and without the presence of pneumonia, similar to the pre-                       the illumination intensity is provided more equitably in the
vious evaluation with the difference of the model to be                           average image of the images processed by the registration
retrained. This model was retrained in three different ways;                      algorithm.
the first was with images that are not processed by our reg-                          A similar test is performed with 500 images (Figure 6)
istration method, the second was with the images resulting                       but without pneumonia. Note that the average image
Journal of Nanomaterials                                                                                                                  7

                                                                        Data Availability
                                                                        The data underlying the results presented in the study are
                                                                        available within the manuscript.

                                                                        Conflicts of Interest
                                                                        The authors declare that they have no conflicts of interest.

                                                                        References
                                                                         [1] A. Abdullah Hamad, M. Lellis Thivagar, M. Bader Alazzam
                                                                             et al., “Dynamic systems enhanced by electronic circuits on
               (a)                                (b)                        7D,” Advances in Materials Science and Engineering,
                                                                             vol. 2021, Article ID 8148772, 11 pages, 2021.
Figure 6: Average images of 500 images without pneumonia, on             [2] M. B. Alazzam, A. A. Hamad, and A. S. AlGhamdi, “Dynamic
the left without registration and on the right with registration. (a)        mathematical models’ system and synchronization,” Mathe-
Raw original images. (b) Images processed with chest registration            matical problems in engineering, vol. 2021, Article ID
into X-ray images using CNN.                                                 6842071, 7 pages, 2021.
                                                                         [3] B. A. Al-Rahawe, A. A. Hamad, M. H. Al-Zuhairy, H. H. Kha-
                                                                             laf, and S. Abebaw, “The commitment of Nineveh Governorate
obtained by recording the images also improves the defini-                    residents to the precautionary measures against global 2019
tion of the features, making it less blurred in the section of               pandemic and dermatological affection of precautions,”
the lungs.                                                                   Applied Bionics and Biomechanics, vol. 2021, Article ID
    The following histogram shows the frequency in pixels                    1526931, 9 pages, 2021.
with which the different intensity levels appear in the previ-            [4] M. Alsaffar, A. A. Hamad, A. Alshammari et al., “Network
ous images and the intensity level is in the range from 0 to                 management system for IoT based on dynamic systems,”
255, where the value 0 represents the black color and 255                    Computational and Mathematical Methods in Medicine,
                                                                             vol. 2021, Article ID 9102095, 8 pages, 2021.
the color white; observing the histogram shows how the illu-
mination intensity is provided more equitably in the average             [5] M. Alsaffar, G. Alshammari, A. Alshammari et al., “Detection
                                                                             of tuberculosis disease using image processing technique,”
processed images. This evaluation, which is carried out by
                                                                             Mobile Information Systems, vol. 2021, Article ID 7424836, 7
calculating the average sum of 500 images (Figure 5), is                     pages, 2021.
shown in the first case (images with pneumonia) that there
                                                                         [6] G. Alshammari, A. A. Hamad, Z. M. Abdullah et al., “Applica-
is cloudiness in the area of the lungs. The second case                      tions of deep learning on topographic images to improve the
(images without pneumonia) shows that the cloudiness                         diagnosis for dynamic systems and unconstrained optimiza-
decreases, and the details are better appreciated in the aver-               tion,” Wireless Communications and Mobile Computing,
age image. In both cases, registering chest X-ray images                     vol. 2021, Article ID 4672688, 7 pages, 2021.
using CNN delimits the images to take better advantage of                [7] M. Engin, H. Oğul, M. Ağildere, and E. Sümer, “An evaluation
the information in the images.                                               of image registration methods for chest radiographs,” in 2015
                                                                             SAI Intelligent Systems Conference (Intelli Sys), pp. 822–827,
                                                                             London, UK, 2015.
4. Conclusions                                                           [8] S. W. X. Guo and Z. Luo, “Automatic extraction of control
                                                                             points for chest X-ray image and elastic registration,” in 2008
Image registration is the process that seeks the geometric                   2nd International Conference on Bioinformatics and Biomedi-
transformation to align two images in the best possible cor-                 cal Engineering, pp. 2651–2654, Shanghai, China, 2008.
respondence; this section focuses on a registration proposal             [9] A. A. Hamad, M. L. Thivagar, J. Alshudukhi et al., “Secure
using CNNs and principal component analysis. The results                     complex systems: a dynamic model in the synchronization,”
can be seen visually in the previous section. The proposed                   Computational Intelligence and Neuroscience, vol. 2021, Arti-
                                                                             cle ID 9719413, 6 pages, 2021.
method eliminates unnecessary information and better
                                                                        [10] A. Howard, M. Zhu, B. Chen, D. Kalenichenko, W. Wang,
delimits the thorax region. Regarding the evaluation regard-
                                                                             T. Weyand, M. Andreetto, and H. Adam, Eds., “Mobile Nets:
ing the classification of types of pneumonia in X-ray images,
                                                                             Efficient Convolutional Neural Networks for Mobile Vision
although the improvement is marginal by preprocessing the                    Applications,” 2017, https://arxiv.org/abs/1704.04861.
images with the registration method, the results suggest that           [11] A. Khadidos, A. Khadidos, O. M. Mirza, T. Hasanin,
it is necessary to improve the preprocessing to reveal the                   W. Enbeyle, and A. A. Hamad, “Evaluation of the risk of
physiological details of the associated patterns to each type                recurrence in patients with local advanced rectal tumours
of pneumonia. In a future work, we propose using the                         by different radiomic analysis approaches,” Applied Bionics
PCA (principal component analysis) to decompose the X-                       and Biomechanics, vol. 2021, Article ID 4520450, 9 pages,
ray images to form pseudo color images before the CNN                        2021.
input layer to detect the spine, which requires a decomposi-            [12] J. Naranjo-Torres, M. Mora, R. Hernández-García, R. J. Barrien-
tion in the images.                                                          tos, C. Fredes, and A. Valenzuela, “A review of convolutional
8                                                                          Journal of Nanomaterials

       neural network applied to fruit image processing,” Applied Sci-
       ences, vol. 10, no. 10, p. 3443, 2020.
[13]   M. Norval, Z. Wang, and Y. Sun, “Pulmonary tuberculosis
       detection using deep learning convolutional neural networks,”
       in ICVIP 2019: Proceedings of the 3rd International Conference
       on Video and Image Processing, pp. 47–51, Shanghai, China,
       2019.
[14]   P. Panchal, P. Patel, V. Thakkar, and G. R. Pose, “Pose, illumi-
       nation, and expression invariant face recognition using Lapla-
       cian of Gaussian and Local Binary Pattern,” in 2015 5th Nirma
       University International Conference on Engineering (NUi-
       CONE), pp. 1–6, Ahmedabad, India, 2015.
[15]   P. Rajpurkar, J. Irvin, K. Zhu et al., “Chenet: Radiologist-Level
       Pneumonia Detection on Chest X-Rays with Deep Learning,”
       2017, https://arxiv.org/abs/1711.05225.
[16]   B. Rodríguez-Cuenca, J. A. Malpica, and M. Alonso, “Region-
       growing segmentation of multispectral high-resolution space
       images with open software,” in 2012 IEEE International Geo-
       science and Remote Sensing Symposium, Munich, Germany,
       2012.
[17]   R. Talanow, K. Y. Lexington, E. Malthouse, and C. Bolan,
       “Radiological Society of North America (RSNA) 2012 Annual
       Meeting-Poster Presentation, Boston University, 2012.
[18]   L. Wang, A. A. Hamad, and V. Sakthivel, “IoT assisted
       machine learning model for warehouse management,” Journal
       of Interconnection Networks, vol. 3, article 2143005, 2021.
[19]   X. Wang, Y. Peng, L. Lu, Z. Lu, and R. Summers, “Tie net: text-
       image embedding network for common thorax disease classifi-
       cation and reporting in chest X-rays,” in Proceedings of the
       IEEE Conference on Computer Vision and Pattern Recognition
       (CVPR), pp. 9049–9058, San Juan, PR, USA, 2018.
[20]   S. Jha, S. Ahmad, H. A. Abdeljaber, A. A. Hamad, and M. B.
       Alazzam, “A post COVID machine learning approach in
       teaching and learning methodology to alleviate drawbacks of
       the e-whiteboards,” Journal of Applied Science and Engineer-
       ing, vol. 25, no. 2, pp. 285–294, 2021.
[21]   N. Jmour, S. Zayen, and A. Abdelkrim, “Convolutional neural
       networks for image classification,” in 2018 International Con-
       ference on Advanced Systems and Electric Technologies (IC_
       ASET), pp. 397–402, Hammamet, Tunisia, 2018.
[22]   K. Karthik and S. Sowmya Kamath, “Deep neural models for
       automated multi-task diagnostic scan management—quality
       enhancement, view classification, and report generation,” Bio-
       medical Physics & Engineering Express, vol. 8, article 01501,
       2021.
You can also read