Fast colorimetric detection of albumin-to-creatinine ratio using paper-based analytical devices with alkaline picrate and Bromothymol Blue reagents
←
→
Page content transcription
If your browser does not render page correctly, please read the page content below

Journal of Applied Pharmaceutical Science Vol. 12(01), pp 140-148, January, 2022
Available online at http://www.japsonline.com
DOI: 10.7324/JAPS.2021.120113
ISSN 2231-3354

Fast colorimetric detection of albumin-to-creatinine ratio
using paper-based analytical devices with alkaline picrate and
Bromothymol Blue reagents

Nurrahmah Nurrahmah1, Kikie Trivia Amalia1, Hermin Sulistyarti1, Akhmad Sabarudin1,2*
1
 Department of Chemistry, Faculty of Science, Brawijaya University, Malang, Indonesia.
2
 Research Center for Advanced System and Material Technology, Brawijaya University, Malang, Indonesia.

    ARTICLE INFO                        ABSTRACT
    Received on: 27/05/2021             This work aimed to report the paper-based analytical devices (PADs) developed to determine the albumin-to-creatinine
    Accepted on: 09/09/2021             ratio (ACR) using the colorimetric method as a simple detection system. The detection of albumin (ALB) was based
    Available Online: 05/01/2022        on the dye-binding reaction by immobilizing Bromothymol Blue (BTB) onto the PADs. The color change from yellow
                                        to blue was identified when ALB reacted with BTB. Creatinine (CRE) detection was carried out according to the Jaffe
                                        reaction by reacting CRE with alkaline picrate, which was immobilized onto the PADs, resulting in the color change
    Key words:
                                        from yellow to orange CRE–picrate complex. The intensity of the color formed is proportional to the concentration of
    albumin, creatinine, kidney,
                                        ALB and CRE. The proposed method was successfully applied to detect ACR in synthetic urine samples with accuracy
    nephropathy, paper-based
                                        in the range of 77%–93% and relative standard deviations < 5%. The detection limits for ALB and CRE were 2.4 and
    analytical devices.
                                        5.3 mg dl−1, respectively. This device provides an inexpensive, simple, fast, disposable, and affordable tool for possible
                                        early detection of kidney damage because of nephropathy.

INTRODUCTION                                                                                    Early detection of nephropathy for diabetics and
          Nephropathy is one of the global health problems, with a                    hypertension is urgently required to prevent kidney damage
prevalence increasing every year. The main causes of nephropathy                      from getting worse. Nephropathy occurs when the albumin-to-
generally come from diabetes and hypertension, which can develop                      creatinine ratio (ACR) in urine is > 30 mg g−1 or microalbuminuria
into kidney damage, chronic kidney disease (CKD), kidney failure,                     is obtained [urine albumin (ALB) level is in the range of 30–299
and even death (Mohart, 2013; Shiba and Shimokawa, 2011; Van                          mg/24 hour]. People with diabetes and hypertension, who suffer
Buren and Toto, 2011). The increasing number of hemodialysis                          from nephropathy for at least 3 months, are referred to as CKD
patients showed increasing kidney failure because of nephropathy.                     patients (Shaw and Cummings, 2012). If detected early and
According to the 2017 Global Burden of Disease, CKD ranks 12th                        handled properly, the CKD patients with a urine ACR of 30–299
and causes 1.1 million deaths worldwide. In the last 10 years,                        mg g−1 and an eGFR of 60–89 ml/minute/1.73 m2, the occurrence
deaths from kidney disease have increased by 31.7%, making                            of kidney failure can be prevented (Han et al., 2015). Hence, fast
kidney disease one of the leading causes of death, the fastest rising                 laboratory testing and good disease management are needed.
besides diabetes and dementia (Neuen et al., 2017).                                             Creatinine (CRE) and microalbuminuria detection
                                                                                      are standard and widely used laboratory tests to determine
                                                                                      kidney disorders in diabetic and hypertension patients. The
                                                                                      amount of CRE excreted in urine indicates the condition of
                                                                                      human kidneys. The collection of urine samples is effortless
                                                                                      and not invasive, so it does not cause pain for patients. Urine
*Corresponding Author
                                                                                      contains proteins, end products of nucleic acid metabolism,
Akhmad Sabarudin, Department of Chemistry, Faculty of Science,
Brawijaya University, Malang, Indonesia. E-mail: sabarjpn @ ub.ac.id                  metabolites (urea, uric acid, CRE, ammonia, and amino acids),

© 2022 Nurrahmah et al. This is an open access article distributed under the terms of the Creative Commons Attribution 4.0 International License (https://
creativecommons.org/licenses/by/4.0/).
Nurrahmah et al. / Journal of Applied Pharmaceutical Science 12 (01); 2022: 140-148                            141

various organic and inorganic salts, electrolytes, and many             PADs (Yamada et al., 2015). The chromatographic paper does not
vitamins, hormones, enzymes, and other components as end                need additives, and almost all impurities from the raw material
products of the metabolism process. Through quantitative                are removed after the bleaching process. Cellulose is the primary
and qualitative monitoring of changes in urine composition,             component of the paper material, with an abundance of hydroxy
it is possible to obtain important diagnostic information of            (−OH) groups and a small amount of carboxylic acid (−COOH)
concerning kidney and urinary tract diseases and pathologies            groups on the surface (Alila et al., 2005). PADs were first
other organs such as the cardiovascular system, endocrine               introduced as an analytical tool with microfluidic patterns on paper
system, and metabolic system (Simerville et al., 2005). This            to detect glucose and protein in artificial urine by Martinez et al.
urinalysis can also provide important information on disease            (2018). This device is very promising for use as a point of care
progression, prognosis estimation, and treatment options (Jalal         diagnosis. PAD is a self-standing analysis system equipped with
et al., 2017). However, concentrations of the urine component           all the components needed to carry out an analytical assay, such as
are influenced by diet, water intake, sweat, and other factors, so      the sample transport system, sample pretreatment, reagents, and
that the quantitative composition of urine varies significantly         detection system.
depending on the amount of urine excreted at a certain time.                      The Jaffe method, even though it has been more than one
Consequently, measurement of the CRE concentration from a               century, is still used as a reference by most clinical laboratories for
random urine sample as well as the concentration of the single          the quantitative determination of CRE. In this method, CRE reacts
urinary component CRE (Corder and Leslie, 2019; Fernandes               with alkaline picrate to form an orange-colored CRE–picrate
et al., 2017; Krishnegowda et al., 2017; Ramanavicius, 2007;            complex whose color intensity is equivalent to the concentration of
Yuen et al., 2004) does not provide accurate physiological              CRE in the sample (Delanghe and Speeckaert, 2011; Küme et al.,
information. Furthermore, CRE testing is considered less                2017). ALB is generally determined using the dye-binding reaction
sensitive because when the kidney damage reaches 50%, the               method, resulting in color change which corresponds to ALB
CRE level just rises. For accurate analysis of urinary micro-           concentration when the dyes bind to this protein. Bromothymol
ALB, a 24-hours urine collection is needed for analysis, which          blue (BTB) has higher sensitivity in comparison with Phenol red,
requires considerable patient effort (Methven et al., 2010).
                                                                        Cresol red, and Thymol blue for detection of ALB using a visible
          The effect of urine volume can be compensated by
                                                                        spectrophotometric method (Suzuki, 2003).
expressing the concentration of the desired urinary component
                                                                                  The use of PAD to detect kidney disorders based on the
as the number of analytes per total CRE. ALB index, which is
                                                                        multiple urinary components ACR has been reported. Disposable
the ratio of urinary ACR and is usually expressed as milligrams
                                                                        paper-based electrophoresis microchips with integrated pencil-
(mg) of ALB per gram (g) of CRE, is used as a substitute for
                                                                        drawn electrodes (Chagas et al., 2016) provided a limit of
this purpose. The urine ACR test avoids the volume influence
                                                                        detection (LOD) of 458 mg dl−1 for CRE and 262 mg dl−1 for
problem on urine samples and does not require a 24-hours urine
                                                                        ALB. Aerosolized deposition of polycaprolactone onto paper-
collection. Additionally, noninvasive sampling can be attributed
                                                                        based microfluidic tools (Heist et al., 2018) had an LOD of 50
to this method (Sabarudin, 2018). Accordingly, ACR is considered
an accurate method for screening albuminuria. Besides being used        mg dl−1 for CRE and ALB. Paper-based colorimetry device for
to identify nephropathy, kidney function laboratory testing can         the determination of ACR using Bromocresol green and alkaline
also be applied to detect patients at high risk of hypertension and     picrate reagents (Chaiyo et al., 2018) resulted in LOD of 5.4 and
heart disease requiring more intensive care. However, the use of        7.1 mg dl−1 for CRE and ALB, respectively.
expensive autoanalyzer instrumentation in this method, which is                   In this work, we developed colorimetric-based PADs
usually only available in major/modern health facilities, can cause     for ACR detection. BTB immobilized in the PADs was used to
kidney disease more difficult to be detected early, particularly for    determine ALB, resulting in a color change from yellow to blue.
patients away from the modern hospital.                                 Moreover, CRE is determined using alkaline picrate, which
          Various analytical methods have been developed for            results in a color change from yellow to orange. Although we
the detection of ACR, including sequential injection analysis           used the same alkaline picrate reagent for CRE detection as
(Sabarudin, 2018; Siangproh et al., 2009), spectrophotometry            reported by Chaiyo et al. (2018), the picric acid and NaOH
(Schosinsky et al., 1987), turbidimetric immunoassay (Hong et           concentrations used were different. Our optimized condition
al., 2016), and ELISA (Chapman et al., 2019). These methods             is better because it gives a sharper orange color (CRE–picrate
employ modern instruments with high sensitivity and accuracy.           complex) at the same creatine concentration so that it is easier
However, the use of these instruments has limitations, such as          to see with the naked eye. Using these reagents under optimum
high-cost analysis and time-consuming analysis, requires large          conditions, better sensitivity (LOD: 2.4 and 5.3 mg dl−1 for ALB
amounts of reagents and samples and less portable and high-             and CRE, resp.) than other works reported so far (Chagas et
priced instrument, and requires a trained operator. Therefore,          al., 2016; Chaiyo et al., 2018; Heist et al., 2018) was achieved
the development method, which is cheap, simple, fast analysis,          for ACR detection. The color changes were recorded using a
disposable, and affordable, is needed. This need can be achieved        digital camera, and their color intensities were measured using
using paper-based analytical devices (PADs).                            ImageJ software. The proposed method was then applied to
          Paper made from pure cellulose has chemical and               the determination of ACR in the synthetic urine samples with
physical properties, which are very suitable for application as         satisfying results.
142                         Nurrahmah et al. / Journal of Applied Pharmaceutical Science 12 (01); 2022: 140-148

MATERIALS AND METHODS                                                   Colorimetric detection of ALB and CRE
Chemicals and apparatus                                                           The colorimetric detection procedure is shown
                                                                        schematically in Figure 2. The BTB and the mixture of picric
           The Xerox ColorQube 8580DN solid ink color printer
                                                                        acid with NaOH (alkaline picrate) reagents were dropped on ALB
(USA) was employed to prepare PADs (Fig. 1) using Whatman
                                                                        and CRE detection zones until they filled the circle zone area as
chromatographic paper No.1 (Whatman TM, GE Healthcare,
                                                                        indicated by the formation of a yellow color. Then, the standard
UK). The digital drying oven (B-ONE, China) was used for
                                                                        solutions or samples were dropped on each detection zone and
posttreatment of the resulting PADs. The color changes on PADs
                                                                        allowed to change color from yellow to blue for ALB and yellow
were captured by the digital camera (Fujifilm X-A3, Japan) and
                                                                        to orange for CRE detection. These color changes were captured
further processed using ImageJ software to obtain the intensity of
                                                                        using the digital camera, and the resulting images were analyzed
red, green, and blue (RGB) colors.
                                                                        using ImageJ software to determine the RGB color intensity of
           All chemicals used in this work were of the analytical
reagent grade. Bovine serum albumin, BTB (C27H28Br2O5S/BTB),            ALB–BTB and CRE–alkaline picrate. The color intensity of the
CRE, and sodium hydroxide for detection of ACR were purchased           formed complexes can be represented by only one complementary
from Sigma-Aldrich (Singapore,) whereas picric acid (C6H3N3O7)          color, which showed a linear trend as the concentration of the
was obtained from Smart-Lab, Indonesia. For preparation of              analytes increased. In this work, the red intensity was used to
artificial urine solution, citric acid, urea, lactic acid, potassium    determine the ALB concentration, and green intensity was chosen
dihydrogen phosphate, dipotassium hydrogen phosphate, sodium            to determine the CRE concentration. Then, the color intensity was
chloride, sodium sulfate, sodium bicarbonate, ammonium                  corrected into ∆intensity (absolute value) by subtracting the blank
chloride, calcium chloride, and magnesium sulfate were obtained         intensity with red or green intensity, reflecting the actual intensity
from Sigma-Aldrich (Singapore). All chemicals were prepared             of the sample.
in distilled water except BTB, which requires ethanol (Merck,                     When photographing color changes using a digital
Indonesia) for dissolution.                                             camera (Fig. 2D), the PAD is adjusted to a fixed position and
                                                                        condition. The PAD is put inside a black controlled-light box with
Design and fabrication of µPADs                                         dimensions of 19 cm length × 14 cm width × 23 cm height; the
          The PAD pattern was designed using the CorelDraw              top has a hole with a diameter of 5 cm as a place to insert the
X7 software, which consists of two detection zones for ALB and          camera lens. At the bottom of the box, there is a place to put a
CRE. Each detection zone had a diameter of 10 mm, with PADs             PAD with a height of 3 cm, and the distance between the PAD and
dimensions of 42 × 23 mm. The design (Fig. 1) was printed on            the camera lens is 18 cm. An LED light (4 watts, 6,500 K, 330
Whatman chromatographic paper No.1 using the Xerox ColorQube            lm, 30 mA) is placed inside the box whose position is fixed not to
8580DN printer equipped with a CMYK (Cyan, Magenta, Yellow,             block the camera lens. Digital camera with fixed lens 16.0–50.0
Key) wax ink cartridge. The printed devices were placed in the          mm (Fujifilm X-A3) is set as follows: focal length 16.0 mm with
oven at 120°C for 3 minutes to allow the wax to melt and penetrate      ISO 200.
PADs, generating the hydrophobic barrier on both sides of the
paper. The backside of PADs was coated with transparent tape to         Synthetic urine samples
prevent leakage of solution through the device and avoid paper                 The synthetic sample solution was made by mixing ALB
bending when the reagents were dropped on the paper.                    and CRE at certain concentrations in artificial urine solution as

                             Figure 1. Design of the PADs.
Nurrahmah et al. / Journal of Applied Pharmaceutical Science 12 (01); 2022: 140-148                                        143

Figure 2. Colorimetric detection procedure for ALB and CRE detection. (A) Dropping BTB and alkaline picrate reagents to ALB and CRE detection zones. (B)
Dropping standard solutions or samples to ALB and CRE detection zones. (C) The resulting color changes: blue for ALB and orange for CRE. (D) Capturing the color
changes with the digital camera. (E) Analyzing RGB intensity using ImageJ software.

           Table 1. Composition of artificial urine solution.                      RESULTS AND DISCUSSION
              Components                        Concentration (mM)                 Effect of reagent and sample volumes on the color intensity
                Citric acid                               2                                  Investigation of the optimum reagent volume was
                  Urea                                   170                       carried out to determine the amount of reagent distributed in the
                Uric acid                                0.4                       PADs so that the color change obtained in the detection zone could
               Lactic acid                               1.1                       be observed evenly and homogeneously. The reagent volume was
                                                                                   varied from 1 to 3 µl, and the result is shown in Figure 3. The color
     Potassium dihydrogen phosphate                       7
                                                                                   intensity increased with increasing reagent volume and reached
    Dipotassium hydrogen phosphate                        7
                                                                                   optimum when 2 μl of each BTB and alkaline picrate was used for
             Sodium chloride                              90                       ALB and CRE detection, respectively. This selection was indicated
             Sodium sulfate                               10                       by the blue (ALB–BTB) and orange (CRE–alkaline picrate) color
           Sodium bicarbonate                             25                       formation, which provided the highest ∆ color intensity and color
           Ammonium chloride                              25                       distribution evenness in the detection zone. However, reagent
                                                                                   volume excess (> 2 μl) would result in the reagent passing through
            Calcium chloride                             2.5
                                                                                   the hydrophobic barrier of the detection zone.
           Magnesium sulfate                              2                                  The optimization of sample volume is required to find the
                                                                                   desired amount of sample that can react with reagents, resulting in
                                                                                   color change evenness in the detection zone without upward or
shown in Table 1 (Brooks and Keevil, 1997; Martinez et al., 2007)
                                                                                   downward bending of the PADs. In this work, the sample volume
at four different ALB index (ACR) concentrations as follows:                       was studied from 2 to 6 µl, and the results are shown in Figure 4.
synthetic sample 1 (CRE 100 mg dl−1; ALB 30 mg dl−1), synthetic                    The ∆ color intensity increased as the sample volume rose. It was
sample 2 (CRE 100 mg dl−1; ALB 50 mg dl−1), synthetic sample 3                     found that the blue color compound (ALB–BTB) and orange color
(CRE 100 mg dl−1; ALB 100 mg dl−1), and synthetic sample 4 (CRE                    complex (CRE–alkaline picrate) reached the highest ∆intensity
100 mg dl−1; ALB 400 mg dl−1). These compositions correspond to                    accompanied by excellent color distribution in the detection zone
the ALB index of 300, 500, 1,000, and 4,000 for synthetic urine                    when the sample volume was 4 µl. Accordingly, this volume was
samples 1, 2, 3, and 4, respectively.                                              chosen for further experiments. The sample volume of > 4 μl could
144                              Nurrahmah et al. / Journal of Applied Pharmaceutical Science 12 (01); 2022: 140-148

Figure 3. Effect of BTB reagent volume to the color intensity of ALB–BTB (A). Effect of alkaline picrate reagent volume to the color intensity of CRE–alkaline picrate
(B). Condition: volume of sample was 4 µl; ALB concentration was 100 mg dl−1; CRE concentration was 100 mg dl−1.

Figure 4. Effect of sample volume on the color intensity of ALB–BTB (A). Effect of sample volume on CRE–alkaline picrate’s color intensity (B). Condition: volume
of reagent was 2 µl; ALB concentration was 100 mg dl−1; CRE concentration was 100 mg dl−1.

not be applied since the excess amount of solution passed through                     Effect of reaction time on the color intensity
the hydrophobic barrier of circle detection zones.                                               Investigation of the optimum reaction time was studied
                                                                                      to find the appropriate reaction time so that the formation of faded
Effect of reagent concentration on the color intensity
                                                                                      colors in the detection zone of PADs could be avoided. PADs were
          BTB concentration affects the color change for ALB                          photographed using a digital camera with reaction times varying
detection, while alkaline picrate concentration affects the color                     from 5 to 75 minutes. In Figure 6, the results showed that the ∆
change for CRE detection. Optimization of reagent concentration                       color intensity of ALB–BTB (blue) and CRE–alkaline picrate
was carried out to obtain reagent composition that resulted in                        (orange) in the PADs detection zone tended to be constant from
sharp color changes in the detection zone of PADs. The BTB                            5 to 20 minutes. Conversely, at the reaction time > 20 minutes,
concentration was varied from 0.0004 to 0.004 M, while the                            the ∆intensity decreased and the color in the PADs detection zone
concentration of picric acid was studied from 0.01 to 0.05 M,                         faded. Therefore, the optimum reaction time for detection of ALB
and the concentration of NaOH for conditioning picric acid was                        and CRE can be carried out in the range of 5–20 minutes.
investigated from 1 to 3 M. For picric acid, concentration > 0.05
M could not be tested because it exceeded its solubility limit                        The analytical figure of merits
(saturated) (Cook et al., 1975).                                                                 In this work, linearity is an important part of evaluating
          As shown in Figure 5 (A), the results showed that the                       a method to determine the concentration of analytes with high
∆intensity increased with increasing reagent concentrations. The                      accuracy using PADs. Additionally, the linearity is constructed
optimum concentration of BTB was 0.0008 M because it provided                         according to the optimum conditions obtained. Due to the best
sharper and faster blue color change (ALB–BTB) in comparison                          linearity, the red intensity was applied to construct the calibration
with 0.004 M. In Figure 5 (B and C), the ∆intensity of CRE–                           curve of ALB, whereas green intensity was used to prepare the
alkaline picrate increased with increasing picric acid and NaOH                       calibration curve of CRE. Good linearity of ALB concentration
concentrations. Thus, 0.05 M picric acid in 3 M NaOH (alkaline                        was achieved in the range of 10–100 mg dl−1 (Fig. 7C) as indicated
picrate) was selected for the further experiment because it resulted                  by the correlation coefficient (R2) of 0.9948, whereas the linear
in sharper and faster orange color changes in the detection zone of                   range for the determination of CRE could be constructed from its
PADs when more CRE was dropped.                                                       concentration from 10 to 100 mg dl−1 (Fig. 7D), resulting in R2 of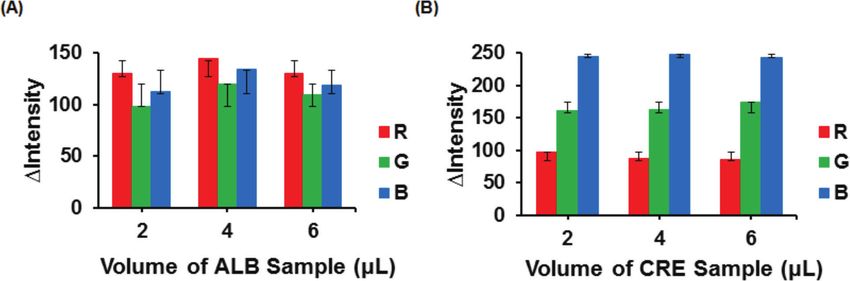
Nurrahmah et al. / Journal of Applied Pharmaceutical Science 12 (01); 2022: 140-148                                              145

Figure 5. Effect of reagent concentration on the color intensity of BTB (A)., Concentration of picric acid (B)., Concentration of NaOH (C). Condition: volume of
reagent was 2 µl; the volume of sample was 4 µl; ALB concentration was 100 mg dl−1; CRE concentration was 100 mg dl−1. For (B), concentration of NaOH was fixed
at 3 M. For (C), concentration of picric acid was fixed at 0.05 M.

Figure 6. Effect of the reaction time to color intensity for ALB and CRE detection. Condition: volume of reagent was 2 µl; the volume of sample was 4 µl; concentration
of BTB was 0.0008 M; concentration of picric acid was 0.05 M; concentration of NaOH was 3 M; ALB concentration was 100 mg dl−1; CRE concentration was 100
mg dl−1.

0.9723. The LOD of ALB and CRE were calculated according to                           Determination of ACR in synthetic urine samples
3 x standard deviation (3σ) of the blank intensity of PADs for 10                              ACR curve was constructed under optimum condition
measurements. After plotting to each linear equation, the LOD for                     using ALB concentration of 30–500 mg dl−1, while the CRE
ALB and CRE was found to be 2.4 and 5.3 mg dl−1, respectively.                        concentration was kept at 100 mg dl−1, corresponding to the ALB
          The reproducibility was estimated under optimum                             index (ACR) of 300 to 5,000 mg g−1 as calculated according to
conditions for five measurements of ALB (40 mg dl−1) and CRE                          Equation (1) as follows:
(90 mg dl−1). Excellent reproducibility could be achieved as
                                                                                                                         [ALB] in mg dL-1
relative standard deviations (RSD) of 0.27% and 0.24% were                                        ACR (mg g-1) =                                    × 100
obtained for ALB and CRE, respectively.                                                                                  [CRE] in mg dL-1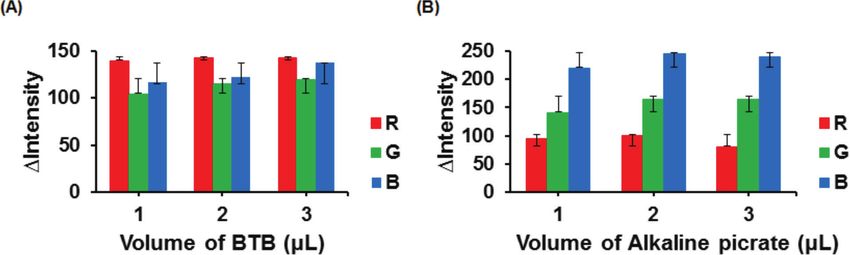
146                             Nurrahmah et al. / Journal of Applied Pharmaceutical Science 12 (01); 2022: 140-148

Figure 7. The color intensity of ALB–BTB (A) and CRE–alkaline picrate (B) at each range concentration of 10–100 mg dl−1 and calibration curves of ALB (C) and
CRE (D). Condition for ALB measurement: volume of reagent was 2 µl; the sample volume was 4 µl; concentration BTB was 0.0008 M; reaction time was 10 minutes.
Condition for CRE measurement: concentration of picric acid was 0.05 M; concentration of NaOH was 3 M; other conditions were similar to ALB measurement.

Figure 8. The relationship between Log ACR and the ratio of ∆intensity ALB/CRE. Condition: volume of reagent was 2 µl; the sample volume was 4 µl; concentration
BTB was 0.0008 M; concentration of picric acid was 0.05 M; concentration of NaOH was 3 M; reaction time was 10 minutes; n = 3.

          Then, the logarithmic of ACR was plotted against the                     ∆intensity ratio of ALB/CRE in the synthetic samples and
∆intensity ratio ALB/CRE, resulting in excellent linearity with a                  plotting the results into the linear equation (see Fig. 8), the ACR
correlation coefficient (R2) of 0.9965, as shown in Figure 8. The                  values could be obtained. Thus, the albuminuria levels, such as
relatively wide linear range was sufficient to allow the proposed                  ACR urine < 30 mg g−1 (normal albuminuria), > 30–300 mg g−1
method to be used as an alternative method to determine the                        (microalbuminuria), and > 300 mg g−1 (macroalbuminuria), can
albuminuria levels. Additionally, this proposed device demonstrates                be estimated.
a paper-based sensing capability to measure ACR easily.                                      The analytical results of synthetic urine samples are shown
          The application of this method for ACR detection                         in Table 2. The accuracy of ACR measurement was in the range of
using synthetic samples was carried out to ascertain the                           77%–93%, while the accuracy of ALB measurement was in the range
performance of the proposed PADs. By calculating the                               of 90%–98%. The RSD for both ACR and ALB measurements were
Nurrahmah et al. / Journal of Applied Pharmaceutical Science 12 (01); 2022: 140-148                                           147

                                       Table 2. Analytical results of synthetic urine samplesa using PADs (n = 3)
                                       Added                                           Found                                            %accuracy
          Sample             ALB                ACR                     ALB                            ACR
                                                                                                                                ALB                 ACR
                           (mg dl−1)           (mg g−1)b              (mg dl−1)                      (mg g−1)b
      Synthetic urine 1       30                 300                32.36 ± 0.12                  354.81 ± 0.01                 92.13               81.73
      Synthetic urine 2       50                 500                54.95 ± 0.56                  616.60 ± 0.01                 90.10               76.68
      Synthetic urine 3       100               1,000              102.33 ± 0.09                 1,122.02 ± 0.01                97.67               87.80
      Synthetic urine 4       400               4,000              407.38 ± 0.44                 4,265.80 ± 0.01                98.16               93.38

  Composed of ALB and CRE in artificial urine solution as shown in Table 1.
  a

  -cratio ACR: mg ALB per gram CRE.
  b

less than 5%. These results suggested that the proposed method has                 REFERENCES
relatively good accuracy and excellent precision, which is possible to                         Alila S, Boufi S, Belgacem MN, Beneventi D. Adsorption of a
be applied for practical applications in a clinical field.                         cationic surfactant onto cellulosic fibers I. surface change effects. Langmuir,
                                                                                   2005; 21(18):8106–13.
CONCLUSION                                                                                     Brooks T, Keevil CW. A simple artificial urine for the growth of
           Inexpensive, simple, fast, disposable, and affordable                   urinary pathogens. Lett Appl Microbiol, 1997; 24 (3):203–6.
                                                                                               Chagas CLS, Souza FR, Cardoso TMG, Moreira RC, Silva JAF,
PADs were developed as an analytical tool used to determine
                                                                                   Jesus DP, Coltro WKT. A fully disposable paper-based electrophoresis
the ACR in synthetic urine samples. The developed PADs can                         microchip with integrated pencil-drawn electrodes for contactless
simultaneously measure ALB and CRE levels using a single                           conductivity detection. Anal Methods, 2016; 8:6682–6.
microfluidic paper-based analytical device. In addition, this                                  Chaiyo S, Kalcher K, Apilux A, Chailapakul O, Siangproh W. A
method allows a simple way to directly calculate the ACR, which                    novel paper-based colorimetry device for the determination of the albumin
can be possibly applied for early screening of nephropathy. In the                 to creatinine ratio. Analyst, 2018; 143:5453–60.
future, this method should be examined for real urine samples                                  Chapman DP, Gooding KM, McDonald TK, Shore AC. Stability
since it can potentially be used as a medical diagnosis of a random                of urinary albumin and creatinine after 12 months storage at −20°C and
                                                                                   −80°C. Pract Lab Med, 2019; 22(15):e00120.
urine sample without having to collect urine for 24 hours.
                                                                                               Cook JGH. Factors influencing the assay of creatinine: prepared
                                                                                   for the association of clinical biochemists’ scientific and technical
ACKNOWLEDGMENTS
                                                                                   committee. Ann Clin Biochem, 1975; 12(36):219–32.
         A. Sabarudin would like to thank the Ministry of Finance                              Corder CJ, Leslie SW. 24-hour urine collection. In: StatPearls,
of the Republic of Indonesia for financially supporting this work                  StatPearls Publishing, Treasure Island, FL, pp 242–5, vol 17(3), 2019.
through RISPRO LPDP 2021 (PRJ-033/LPDP/2021).                                      Available from: https://www.ncbi.nlm.nih.gov/books/NBK482482/
                                                                                               Delanghe JR, Speeckaert MM. Creatinine determination
AUTHORS’ CONTRIBUTIONS                                                             according to Jaffe--what does it stand for? Clin Kidney J, 2011; 4(2):83–6.
          All authors made substantial contributions to the                                    Fernandes A, de Souza PS, de Oliveira AE, Chaves AR. A
                                                                                   new method for the determination of creatinine in urine samples based on
conception and design, acquisition of data, or analysis and
                                                                                   disposable pipette extraction. J Braz Chem Soc, 2017; 29(4):695–700.
interpretation of data; they took part in drafting the article or                              Han JS, Lee MJ, Park KS, Han SH, Yoo TH, Oh KH, Park SK,
revising it critically for important intellectual content; agreed to               Lee J, Hyun YY, Chung W, Kim YH, Ahn C, Choi KH. Albuminuria as a
submit to the current journal; gave final approval of the version                  risk factor for anemia in chronic kidney disease: result from the KoreaN
to be published; and agreed to be accountable for all aspects of                   cohort study for outcomes in patients with chronic kidney disease (KNOW-
the work.                                                                          CKD). PLoS One, 2015; 10(10):e0139747.
                                                                                               Heist CA, Bandara GC, Bemis DJ, Pommerenck JC, Remcho
CONFLICT OF INTERESTS                                                              VT. New paper-based microfluidic tools for the analysis of blood serum
                                                                                   protein and creatinine built via aerosolized deposition of polycaprolactone.
          The authors declare that no financial or other conflicts
                                                                                   Anal Methods, 2018; 10:2994–3000.
of interest.                                                                                   Hong DSC, Oh, IH, Park JS, Lee, CH, Kang CM, Kim GH.
                                                                                   Evaluation of urinary indices for albuminuria and proteinuria in patients
FUNDING
                                                                                   with chronic kidney disease. Kidney Blood Press Res, 2016; 41(3):258–66.
         This work was funded by the Ministry of Finance of the                                Jalal UM, Jin GJ, Shim JS. Paper–plastic hybrid microfluidic
Republic of Indonesia through RISPRO LPDP 2021 (PRJ-033/                           device for smartphone-based colorimetric analysis of urine. Anal Chem,
LPDP/2021).                                                                        2017; 89(24):13160–6.
                                                                                               Krishnegowda A, Padmarajaiah N, Anantharaman S, Honnur
ETHICAL APPROVAL                                                                   K. Spectrophotometric assay of creatinine in human serum sample. Arab J
                                                                                   Chem, 2017; 10:S2018–24.
        This study does not involve experiments on animals or
                                                                                               Küme T, Sağlam B, Ergon C, Sisman AR. Evaluation and
human subjects.                                                                    comparison of Abbott Jaffe and enzymatic creatinine methods: could
                                                                                   the old method meet the new requirements? J Clin Lab Anal, 2017;
PUBLISHER’S NOTE
                                                                                   32(1):e22168.
          This journal remains neutral with regard to jurisdictional                           Martinez AW, Phillips ST, Carrilho E, Thomas III SW, Sindi
claims in published institutional affiliation.                                     H, Whitesides GM. Simple telemedicine for developing regions: camera
148 Nurrahmah et al. / Journal of Applied Pharmaceutical Science 12 (01); 2022: 140-148
phones and paper based microfluidic devices for real-time, off-site using spectrophotometric sequential injection analysis. Talanta, 2009;
diagnosis. Anal Chem, 2018; 80(10):3699–707. 79(4):1111–7.
Martinez AW, Phillips ST, Butte MJ, Whitesides GM. Patterned Simerville JA, Maxted WC, Pahira JJ. Urinalysis: a
paper as a platform for inexpensive, low-volume, portable bioassays. comprehensive review. Am Fam Physician, 2005; 71(6):1153–62.
Angew Chem Int Ed, 2007; 46(8):1318–20. Van Buren PN, Toto R. Hypertension in diabetic nephropathy:
Methven S, MacGregor MS, Traynor JP, O’Reilly DS, Deighan epidemiology, mechanisms, and management. Adv Chronic Kidney Dis,
CJ. Assessing proteinuria in chronic kidney disease: protein–creatinine 2011; 18(1):28–41.
ratio versus albumin-creatinine ratio. Nephrol Dial Transplant, 2010; Yamada K, Henares TG, Suzuki K, Citterio D. Paper-based inkjet
25(9):2991–6. printed mikrofluidic analytical devices. Angew Chem, 2015; 54:2–19.
Mohart V. Hypertension and chronic kidney diseases. Cor Vasa, Yuen PST, Dunn SR, Miyaji T, Yasuda H, Sharma K, Star RA.
2013; 55(4):e397–402. Simplified method for HPLC determination of creatinine in mouse serum.
Neuen BL, Chadban SJ, Demaio AR, Johnson DW, Perkovic V. Am J Physiol Renal Physiol, 2004; 286(6):F1116–9.
Chronic kidney disease and the global NCDs agenda. BMJ Glob Health, Suzuki Y. Reaction between pH indicators with a large pKa
2017; 2(2):E000380. value and human serum albumin and its application to the determination of
Ramanavicius A. Amperometric biosensor for the determination the serum albumin concentration. Bunseki Kagaku, 2002; 52(10):939–44.
of creatine. Anal Bioanal Chem, 2007; 387(5):1899–906.
Sabarudin A. Sequential injection at valve mixing (SI-VM) for
determination of albumin-creatinine ratio in urine. Orient J Chem, 2018;
34(2):730–4.
Schosinsky KH, Vargas M, Esquivel AL, Chavarria MA. Simple
spectrophotometric determination of urinary albumin by dye-binding with
use of bromphenol blue. Clin Chem, 1987; 33(1):223–6. How to cite this article:
Shaw KM, Cummings MH. Diabetes: chronic complications. Nurrahmah N, Amalia KT, Sulistyarti H, Sabarudin A.
3rd edition, Wiley-Blackwell, Hoboken, NJ, pp 34–66, 2012. Fast colorimetric detection of albumin-to-creatinine ratio
Shiba N, Shimokawa H. Chronic kidney disease and heart using paper-based analytical devices with alkaline picrate
failure—bidirectional close link and common therapeutic goal. J Cardiol,
and Bromothymol Blue reagents. J Appl Pharm Sci, 2022;
2011; 57(1):8–17.
Siangproh W, Teshima N, Sakai T, Katoh S, Chailapakul 12(01):140–148.
O. Alternative method for measurement of albumin/creatinine ratioYou can also read