Corporate Presentation, September, 2019 - Generation Mining ...
←
→
Page content transcription
If your browser does not render page correctly, please read the page content below
Corporate Presentation, September, 2019
DISCLAIMER

This presentation (in this projected form and as verbally presented) (Presentation) is provided on the basis that neither Generation Mining Limited (Gen
Mining), nor its officers, shareholders, related bodies corporate, partners, affiliates, employees, representatives and advisors make any representation or
warranty (express or implied) as to the origin, validity, accuracy, reliability, relevance, currency or completeness of the material contained in the
Presentation and no responsibility is taken for any errors or omissions. Nothing contained in the Presentation is, or may be relied upon as, a promise,
representation or warranty, whether as to the past or the future.
Gen Mining excludes all warranties (including implied warranties) and all liability that can be excluded by law for any loss, claim, damage, cost or
expense of any nature (including that arising from negligence) arising out of the Presentation (or any accompanying or other information) whatsoever,
nor by reason of any reliance upon it. Gen Mining accepts no responsibility to update any person regarding any inaccuracy, omission or change in
information in this Presentation or any other information made available to a person or any obligation to furnish the person with any further information.
The Presentation contains "forward-looking statements". Where the Presentation expresses or implies an expectation or belief as to future events or
results, such expectation or belief is expressed in good faith and is believed to have a reasonable basis. However, forward-looking statements are
subject to risks, uncertainties and other factors, which could cause actual results to differ materially from future results expressed, projected or implied
by such forward looking statements. Such risks include, but are not limited to, price volatility, currency fluctuations, increased production costs and
variances in ore grade, recovery rates or other matters from those assumed in mining plans, as well as political and operational risks and governmental
regulation and judicial outcomes. Gen Mining does not undertake any obligation to release publicly any revisions to any "forward-looking statement" to
reflect events or circumstances after the date of the Presentation, or to reflect the occurrence of unanticipated events, except as may be required under
applicable securities laws. Statements relating to reserve and resource estimates are expressions of judgment, based on knowledge and experience
and may require revision based on actual production experience.
Such estimates are necessarily imprecise and depend to some extent on statistical inferences and other assumptions, such as metal prices, cut-off
grades and operating costs, which may prove to be inaccurate. Information provided relating to projected costs, capital expenditure, production profiles
and timelines are expressions of judgment only and no assurances can be given that actual costs, production profiles or timelines will not differ
materially from the estimates contained in this Presentation.
All persons should seek appropriate professional advice in reviewing or considering the Presentation and all other information with respect to Gen
Mining and evaluating the business, financial performance and operations of Gen Mining. Neither the provision of the Presentation nor any information
contained in the Presentation or subsequently communicated to any person in connection with the Presentation is, or should be taken as, constituting
the giving of investment or financial product advice to any person in respect of dealing in Gen Mining securities, and no such information should be
taken to constitute a recommendation or statement of opinion that is intended to influence a person in making a decision to deal in Gen Mining
securities.
This Presentation does not purport to contain all of the information that may be required to evaluate all of the factors that would be relevant in
determining whether to deal in Gen Mining securities, including but not limited to any person's objectives, financial situation or needs. Each person must
not rely on the information provided but should make, and will be taken to have made, its own investigation, assessment and analysis of the information
in this Presentation and other matters that may be relevant to it in considering whether to deal in Gen Mining securities. Gen Mining owns the copyright
in this Presentation.
                                                                                                                                                               2
                                                                                                                                                               2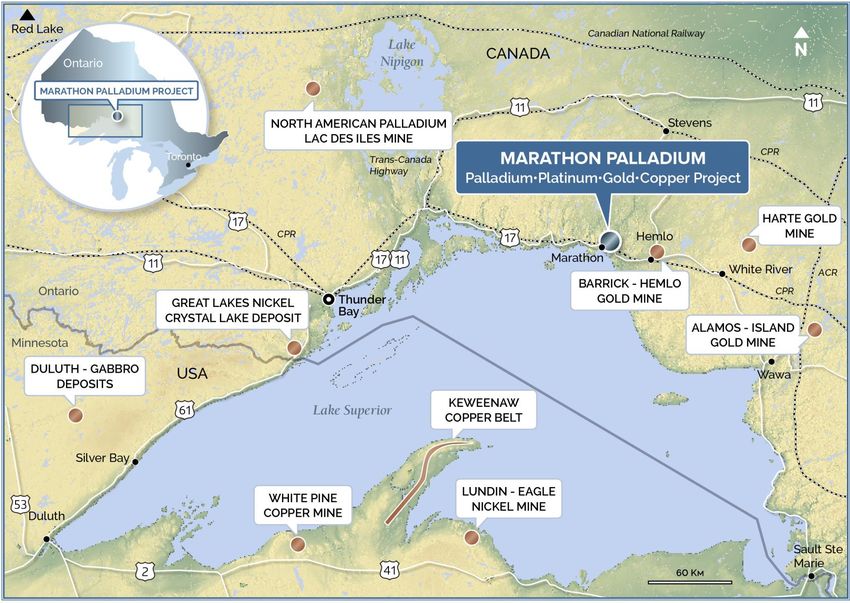
INVESTMENT HIGHLIGHTS

 PUREPLAY PGM DEVELOPER IN TIER ONE JURISDICTION

 ✓   Acquired a 51% interest in the largest undeveloped Palladium
     property in North America. Has an option to increase interest to 80%.

 ✓   Recent independent resource calculation estimates 7.1 million
     ounces of Palladium Equivalent in the Marathon Deposit.

 ✓   Property located near excellent infrastructure, including highway,
     rail, power, and near the mining town of Marathon, ON.

 ✓   Palladium prices have hit all time high of $1,600 per ounce due to
     increased demand combined with flat production profile.

 ✓   Gen Mining plans Preliminary Economic Assessment in Q4 2019
     to evaluate economics of Marathon Project.
                                                                             3
MARATHON DEPOSIT RESOURCES*

  3,238,000                                  1,064,000                                      390,000
   oz PALLADIUM                                 oz PLATINUM                                     oz GOLD

796,000,000                                  7,130,000                                        1.24 g/t
     lbs COPPER                                    oz PD EQ                               PD EQ GRADE

* Open pit Measured and Indicated Resources as estimated by P&E Mining Consultants, Sept 9, 2019. Further detail on
page 14. Does not include the Geordie or the Sally deposits.
                                                                                                                      4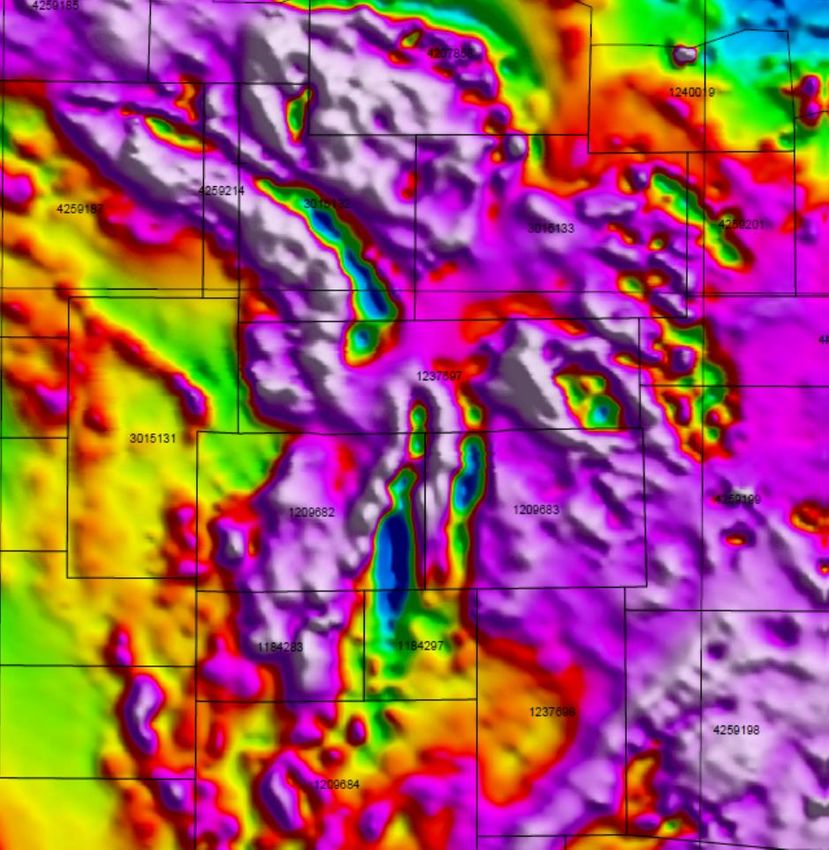
MANAGEMENT

JAMIE LEVY President, CEO & Director                          KERRY KNOLL Exec. Chairman & Director
25 years in financing and management of Cdn mining            Co-founded several successful mining companies over
companies. Was CEO of Pine Point Mining which was             35 years including Wheaton River, Thompson Creek
acquired by Osisko Metals. Formerly VP of Pinetree Capital.   and Glencairn Gold. Former editor of The Northern
                                                              Miner Magazine.

ROD THOMAS, P.Geo. VP, Exploration & Director                 PATRICIA MANNARD             Vice-President, Finance

Geologist with 40 years experience in Canada and abroad.      Managed administrative and financial aspects of
Former Exploration Manager BHP Minerals Eastern NA and        exploration companies for 30 years, including
General Manager of VM Canada (subsidiary of NEXA Res.)        Pine Point Mining from 1993-2018.

HALINA MCGREGOR Chief Financial Officer                       TABATHA LABLANC Manager of Sustainability
Chartered Accountant with extensive experience, including     25 years of environmental & community relations, including
former Chief Financial Officer of Sherritt International,     TransCanada Pipelines, North American Palladium,
Goldcorp Inc. and Pine Point Mining.                          Bowater-Abitib & oversaw the environmental assessment at
                                                              the Marathon Project for Stillwater Canada Inc. in 2012-14.

JOHN MCBRIDE Senior Exploration Geologist
Worked on the Company’s Marathon Project periodically
since 2007, and continuously as project geologist since
2013. He obtained an MSc. in geology from Lakehead
in 2010.

                                                                                                                        5
DIRECTORS

JAMIE LEVY President, CEO & Director                          KERRY KNOLL Exec. Chairman & Director
25 years in financing and management of Cdn mining            Co-founded several successful mining companies over
companies. Was CEO of Pine Point Mining which was             35 years including Wheaton River, Thompson Creek
acquired by Osisko Metals. Formerly VP of Pinetree Capital.   and Glencairn Gold. Former editor of The Northern
                                                              Miner Magazine.

ROD THOMAS, P.Geo. VP, Exploration & Director                 BRIAN JENNINGS Director
Geologist with 40 years experience in Canada and abroad.      Chartered Accountant with extensive experience in
Former Exploration Manager BHP Minerals Eastern NA and        financial management of resource companies, and
General Manager of VM Canada (subsidiary of NEXA Res.)        formerly Vice-President Corporate Restructuring at
                                                              Ernst and Young.

STEPHEN REFORD Director                                       PHILLIP C. WALFORD Director
Geophysicist and professional engineer for 35 years,          Geologist, President and CEO of Marathon Gold since
President of Paterson, Grant & Watson Limited,                2009. Was President and CEO and a founder of
an international geophysical consulting company.              Marathon PGM Corp. which sold Marathon palladium
                                                              project to Stillwater in 2010.

PAUL MURPHY Director
Chairman of Alamos Gold, was Chief Financial Officer
of Guyana Goldfields, former partner and head of mining
group for PricewaterhouseCoopers
                                                                                                                    6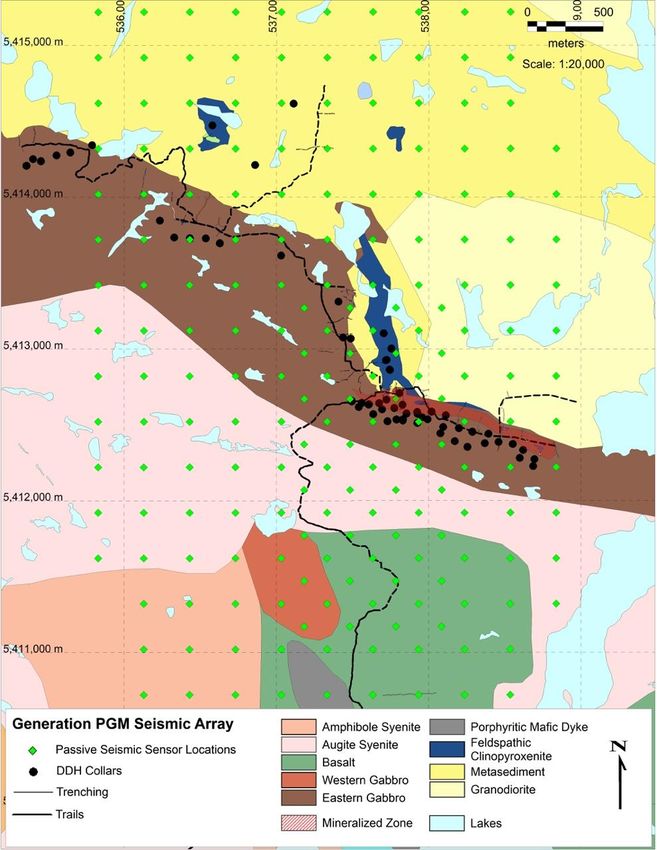
PALLADIUM MARKET

   Price has increased 340% since 2016
   85% used for autocatalysts
   A typical automobile uses 3-7 grams palladium
   Pd loads per vehicle increasing globally by
   regulation to reduce emissions*
   6.88 million oz mined worldwide in 2018*
   Further 3.21 million oz recovered from recycling*
   Total non-investment demand of 10.2 million oz
   800,000 oz deficit in 2018 according to
   Johnson Matthey, others indicate even higher
   Redemptions from ETFs supplied 555,000 oz
   Producer divestment (mainly NorNickel)
   supplied most of balance
                                                       7
*Johnson Matthey
PALLADIUM MARKET

                                            Palladium Market Supply and Demand Balance Historic & Forecast
                                  2,500

                                  2,000

                                  1,500
 Supply/Demand Balance (koz Pd)

                                  1,000

                                    500

                                      0

                                   -500

                                  -1,000

                                  -1,500

                                  -2,000
                                           2001A

                                                   2002A

                                                           2003A

                                                                   2004A

                                                                           2005A

                                                                                   2006A

                                                                                           2007A

                                                                                                   2008A

                                                                                                           2009A

                                                                                                                   2010A

                                                                                                                           2011A

                                                                                                                                   2012A

                                                                                                                                           2013A

                                                                                                                                                   2014A

                                                                                                                                                           2015A

                                                                                                                                                                   2016A

                                                                                                                                                                           2017A

                                                                                                                                                                                   2018A

                                                                                                                                                                                           2019E

                                                                                                                                                                                                   2020E

                                                                                                                                                                                                           2021E

                                                                                                                                                                                                                   2022E
                                                                                                                                                                                                                           8
*S&P Global Market Intelligence, Metals Focus                                                                                                                                                                              8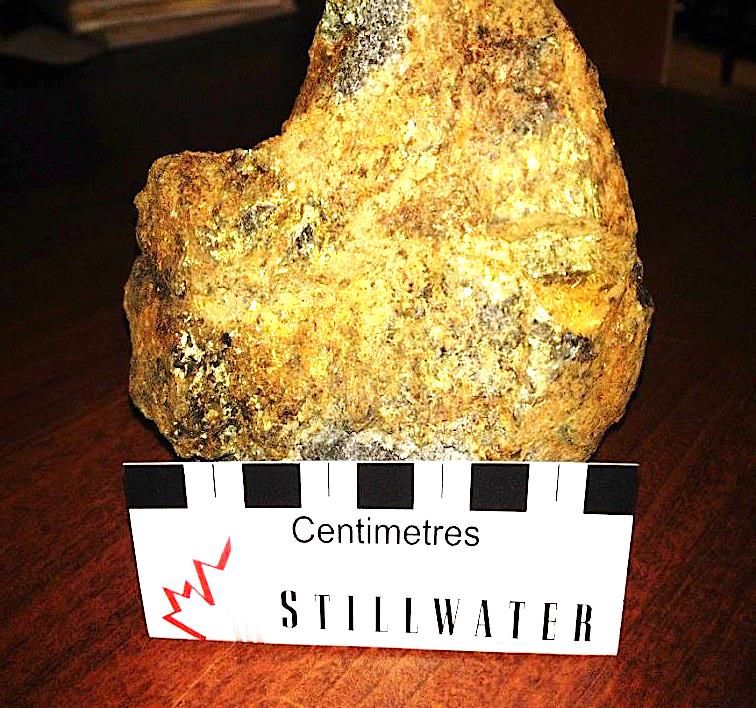
PALLADIUM OUTLOOK*

        “1 million oz deficit in 2019” – Johnson Matthey

  Market deficit to widen as demand       ETF holdings show rapid decline
  climbs by 9% in 2019 due to surge       No large immediate increases in mine
  in auto demand (May 13, 2019)           production are expected in next few
  Supply increases only 2%, mainly        years
  from recycling; mine supply flat        Recycling continues to increase by
  Stricter emission regulations in        double digits but cannot make up the
  Europe, and China are increasing        entire deficit
  palladium loadings in autocatalysts     Substitution to platinum a possibility,
  to 5 gm/vehicle                         however global platinum production
  Changes phased in until 2022            lower than palladium and auto-
  “Further, sizable deficits to come” –   catalysts use less Pd than Pt
  Metals Focus

*Johnson Matthey, Metals Focus                                                      9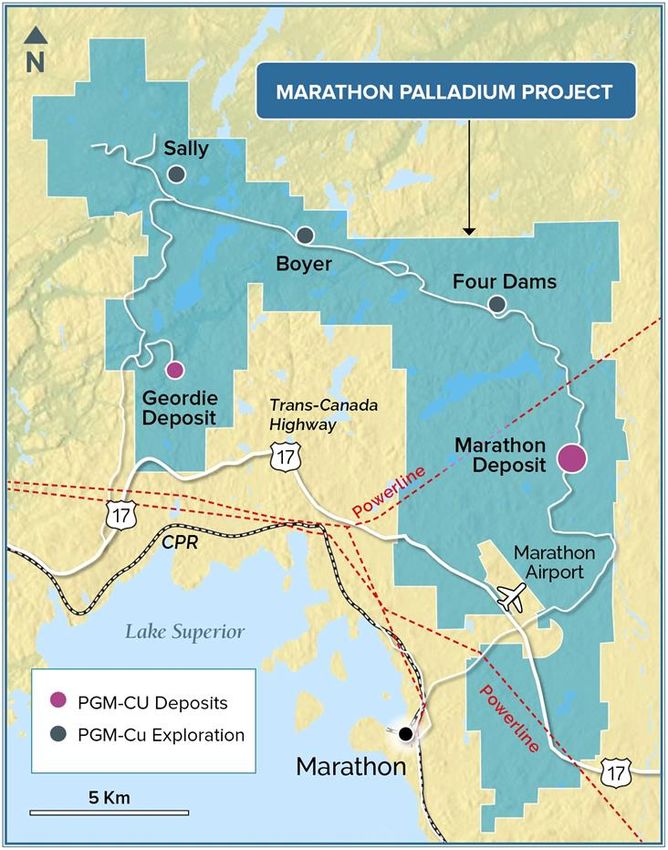
PALLADIUM MARKET*

Demand Inelasticity: Demand is                                   5 Year Palladium
                                                    1,800
increasing as automakers &
                                                    1,600
                                                                               HIGH: $1,600
governments continue to focus on
                                                    1,400
reducing emissions                                  1,200

                                        USD/Ounce
Both palladium and platinum are                     1,000

                                                     800
now in deficit
                                                     600
New Chinese regs will result in “step                400

change” auto consumption - JM                        200
                                                                          LOW: $467
                                                       0
Low substitution risk: Palladium
is a more effective converter than                          Based on New York Close | Source: kitco.com
platinum
“We expect to see double-digit                 Near-term production increases
                                               • Norilsk - +/- 500,000 oz by 2025
growth in palladium consumption
                                               • Platreef: 200,000 oz by 2021
over the 2019 – 2020 period” – JM              • Waterberg – 470,000 oz by 2024
 *Johnson Matthey                                                                                         10
LOCATION
11INFRASTRUCTURE Located on Trans-Canada Highway, served by CPR main rail line Property next to Marathon airport
MARATHON HISTORY & OWNERSHIP

    Developed from 1985 to 2010 by various companies, eventually owned
    by Marathon PGM Corporation

    Over 203,000 metres of drilling in 1,094 holes

    Stillwater took over Marathon in 2010 for
    US$118 million (Pd was trading at US$530/oz)

    Sold 25% to Mitsubishi for US$81.25 million in 2012,
    deal later unwound

    Sibanye Gold acquired Stillwater Mining in 2016 to become Sibanye

    No outstanding royalties on Main Marathon Deposit*

*Varying royalties on remaining land package
                                                                         13
MARATHON OPEN PIT RESOURCES
Tonnes Pd Pt Cu Au Ag PdEq Pd Pt Cu Au Ag PdEq
(k) (g/t) (g/t) (%) (g/t) (g/t) (g/t) (koz) (koz) (Mlb) (koz) (koz) (koz)
PIT CONSTRAINED MINERAL RESOURCE ESTIMATE at C$13/tonne NSR Cut-Off (1-7)
Measured 103,337 0.64 0.21 0.20 0.07 1.5 1.34 2,123 688 463 239 4,964 4,445
Indicated 75,911 0.46 0.15 0.20 0.06 1.8 1.10 1,115 376 333 151 4,371 2,685
M&I 179,248 0.56 0.18 0.20 0.07 1.6 1.24 3,238 1,064 796 390 9,335 7,130
Inferred 668 0.37 0.12 0.19 0.05 1.4 0.95 8 3 3 1 31 21
PIT CONSTRAINED MINERAL RESOURCE ESTIMATE SENSITIVITY at C$25/tonne NSR Cut-Off
Measured 70,792 0.82 0.25 0.25 0.09 1.5 1.67 1,864 578 387 194 3,510 3,794
Indicated 45,279 0.60 0.19 0.25 0.07 1.9 1.40 871 272 252 106 2,817 2,032
M&I 116,071 0.73 0.23 0.25 0.08 1.7 1.56 2,735 850 639 300 6,326 5,826
Inferred 144 0.62 0.16 0.28 0.05 0.9 1.41 3 1 1 0 4 7
OTHER HISTORIC RESOURCES – GEORDIE LAKE
Tonnes Pd Pt Au Cu Pd/oz Pt/oz Au/oz Cu/lbs
millions g/t g/t g/t % ‘000 ‘000 ‘000 million
TOTAL RESOURCES – Main and Hangingwall Zones
M+I 32.4 0.61 0.04 0.05 0.37 641 39.5 49.7 263
Inferred 7.96 0.59 0.03 0.04 0.36 151 8.6 10.4 62
1. Mineral Resources which are not Mineral Reserves do not have demonstrated economic viability.
2. The estimate of Mineral Resources may be materially affected by environmental, permitting, legal, title, taxation, socio-political, marketing, or other relevant issues.
3. The Inferred Mineral Resource in this estimate has a lower level of confidence than that applied to an Indicated Mineral Resource and must not be converted to a Mineral Reserve. It is reasonably
expected that the majority of the Inferred Mineral Resource could be upgraded to an Indicated Mineral Resource with continued exploration.
4. The Mineral Resources in this report were estimated using the Canadian Institute of Mining, Metallurgy and Petroleum (CIM), CIM Standards on Mineral Resources and Reserves, Definitions and
Guidelines prepared by the CIM Standing Committee on Reserve Definitions and adopted by the CIM Council.
5. The Mineral Resource Estimate was based on US$ metal prices of $1,100/oz Pd, $900/oz Pt, $3/lb Cu, $1,300/oz Au and $16/oz Ag. The US$:CDN$ exchange rate used was 0.77.
6. The NSR estimates use flotation recoveries of 93% for Cu, 82% for Pd, 80% for Pt, 80% for Au, 75% for Ag and smelter payables of 96% for Cu, 93% for Pd, 88% for Pt, 90% for Au, 90% for Ag .
7. The pit optimization used a mining cost of C$2 per tonne, combined processing, G&A and off-site concentrate costs of C$13/tonne and pit slopes of 50o.
14MARATHON MAIN DEPOSIT
CROSS SECTION
Deposit dips
moderately west
providing optimal
open pit mining
scenario
Mineralization has
a true thickness
ranging from 4m to
183 m, averaging
35m
Deposit is open at
depth with potential
for UG expansion
from bottom of pit
Source: Miller, J.D., Smyk, M.C. and Hollings, P.N., eds. 2010. Cu-Ni-PGE deposits in mafic
intrusions of the Lake Superior region: A field trip for the 11th International Platinum Symposium;
Ontario Geological Survey, Open File Report 6254, 166p. 15
15METALLURGY FROM 2010 DFS
Extensive metallurgical testing done at several labs during 1990s-2010
Testing indicates a quality copper/PGM concentrate, possibly saleable in
Canada
Stillwater improved recoveries above 80% for Pd; work being reviewed
Gen Mining to resume testing once adequate samples are extracted
SGS-L ESTIMATE OF METAL RECOVERIES (2008)
Metal Unit Feed Grade Concentrate Grade Recovery (%)
Copper % 0.28 22.00 91.0
Gold g/t 0.11 6.53 73.0
Platinum g/t 0.23 13.00 63.0
Palladium g/t 0.87 57.00 77.0
Work to be completed this year to further optimize recoveries
16COMPARABLE PGM
DEVELOPMENT PROJECTS*
Marathon is the largest pureplay PGM project located in a stable, mining friendly
jurisdiction, with great access to infrastructure, and a clear path to open pit production
M&I Resource (3PGE+Au Moz) Inferred Resource (3PGE+Au Moz)
10
9
8
Resource (3PGE + Au Moz)
7
6
5
4
3
2
1
0
Marathon
Nickel Shaw
Pedra Branca
NorthMet
Mayville-Makwa
Suhanko
Panton
Eagle's Nest
Dumont
Grasset
Tamarack North
River Valley
Waterberg JV
Akanani
Monchetundra
Platreef
Twin Metals
Thunder Bay North
North America Global North America
Pureplay PGM Pureplay PGM By-Product PGM
*Company Filings, Capital IQ 17COMPARABLE GOLD DEVELOPERS*
North American precious metals developers with great access to infrastructure
and capital trade at an average valuation of ~US$50/oz
Generation Mining trades at a fraction of its peers’ valuation despite holding
the largest Historic MI&I AuEq resource
$180 M&I Resource Inferred Resource EV/ AuEq MI&I Average EV/oz 6.0
$160
EV $3 PER OZ EQ 5.0
$140
AVERAGE
$120 EV/OZ: $65 4.0
Resources (Moz AuEq)
EV/oz (US$/oz AuEq)
$100
3.0
$80
$60 2.0
$40
1.0
$20
$0 0.0
OSK HRT VIT PGM SBB BGM MOZ TML MAX LGD GENM
*Company Filings, Capital IQ, Note: OSK shown as Windfall only, GENM resources on an 80% basis post financing 18GENERATION MINING TIMELINE
Key Steps for 2019
2019 EVALUATE
PURCHASE BUILD PRELIMINARY
DRILLING & POTENTIAL
MARATHON TECHNICAL ECONOMIC
EXPLORATION PRODUCTION
PROJECT TEAM ASSESSMENT
CAMPAIGN SCENARIOS
TIMELINE (ESTIMATED)
Q2 2019 Q3 2019 Q4 2019 2020
Asset Acquisition ✓
Build Technical Team ✓ ✓
Update Historic Resource ✓
New Listing
Exploration
PEA Study
Permitting
Feasibility Study
19CORPORATE STRUCTURE
Capital Structure Key Shareholders
Shares Outstanding 91.1M Sibanye Stillwater ~12%
Warrants 28.9M Zebra Holdings ~12%
(Weighted average exercise price: C$0.324)
Options 7M Osisko Mining ~10%
(Weighted average exercise price: C$0.208)
Fully Diluted Shares
127.2M Management/Directors ~9%
Outstanding
Basic Market
Capitalization C$27M Renvest Mercantile ~3%
(Share price: C$0.30)
20APPENDIX
GEOLOGY AND EXPLORATION
UPSIDE
21COLDWELL COMPLEX FAULTS
Lineaments are topographic SALLY
features that represent
feeder conduits (faults). BOYER
Lineaments are utilized to FOUR DAMS
prioritize initial exploration
GEORDIE
targets throughout the MARATHON
complex as a conduit for DEPOSIT
magma flow.
Mineralization commonly
occurs along lineament
features (red lines).
Lineament Legend
Lineament Fault Scarp Mineralized Feeder Zone
22MARATHON PROJECT
2018 SEISMIC TARGETS
Passive Seismic Slice at 650 metre-depth
23
23MARATHON PROJECT COINCIDENT
SEISMIC GRAVITY ANOMALY
2018 Passive Seismic
2018 Gravity Survey Profile
24
24POTENTIAL TO INCREASE
GEORDIE RESOURCE
The Geordie Offset to the
northeast has a significant
magnetic signature,
showing a strike length of Geordie
over 1.5 km North
The one drill hole GL-02-02
into Geordie Offset
intersected Geordie gabbro Geordie East
with 7.6 m @ 0.24 g/t
TPGM, 0.18% Cu
Geordie
Additional drilling is required
Deposit
to identity thickness, dip and
strike length of the offset
mineralization
Geordie North has the same
magnetic signature as the
Geordie Deposit
25SALLY AREA WITH DRILL HOLE COLLARS
& BEST INTERSECTIONS
The Area 41 occurrence is located within
the Sally Lake area at the northern
margin of the Eastern Gabbro.
The deposit strikes east-southeast, dips
at 45-50 degrees south and extends for
over 1.2 km along strike. The deposit is
open to the east and west. 56 holes have
been drilled in the Sally Lake area, of
which 45 were drilled into Area 41.
The drilling at Area 41 is considered to
be sufficient to define the thickness and
continuity of the mineralized envelope,
but closer spaced drilling is required to
define and characterize zones of higher
grade material.
Four Mineralized Zones
Zone 1: The uppermost mineralized zone contains Zone 3: Referred to as the Main zone because it is
Cu and trace amounts of Pd and is < 10 m thick. normally over 40 m thick and is the most continuous
over the strike length of the deposit.
Zone 2: The second mineralized zone is typically 40 to
50 m thick and contains some of the highest Pd grades Zone 4: Occurs below the main mineralized zone and
in the deposit. contains Cu and Pd values that are similar to the main
zone, but has increased pyrrhotite content, and thus is
considered to be lower tenor. 26SALLY SEISMIC PROGRAM EXTENDING
STRIKE & EXPLORING FOR MASSIVE SULPHIDES
27
27HIGH GRADE SAMPLE FROM SALLY
Sample K008054, 188.28g/t TPGM, 9.11% Cu, 0.60% Ni, 6.4% S
28INVESTIGATION
INTO HIGH GRADE SOURCE
Ore Geology Reviews 90 (2017) 723-747
Sample K008054, 188.28g/t TPGM,
9.11% Cu, 0.60% Ni, 6.4% S
29INVESTIGATION
INTO HIGH GRADE SOURCE (2)
Conclusion
“An important aspect of this study ...
of the Marathon deposit, is that conduit-style
environments are capable of producing such extreme
PGE-enriched orebodies similar to that of Noril'sk
disseminated ores and late - stage reef deposits in
the shallow parts of large layered intrusions (e.g.
Skaergaard, Bushveld) ... The formation of these
enriched ores likely resulted from early sulfide
segregation ... in a deep reservoir.”
30BOYER ZONE
Boyer Showing
K007980, Pt 5.58ppm, Pd 1.19ppm
K007981, Pt 0.22ppm, Pd 0.24ppm
TRENCH 1
250m
TRENCH 2
K008039, 4.16ppm TPGM, 0.61% Cu
K007997, 1.99ppm TPGM, 0.38% Cu
1,200m Strike Length
31SELECTED GRAB SAMPLES
AND TRENCHING RESULTS
Sample (grab) Au (ppm) Pt (ppm) Pd (ppm) TPGM (ppm) Cu (%)
K007980 0.006 5.58 1.19 6.78 0.003
K008039 0.342 0.723 3.09 4.16 0.605
K008216 0.048 0.808 1.08 1.94 0.009
Trench Length (m) Au (ppm) Pt (ppm) Pd (ppm) TPGM (ppm) Cu (%)
CC_BOY_A 2.48 0.165 0.270 0.520 0.955 0.227
CC_BOY_A 12.13 0.023 0.263 0.362 0.648 0.020
CC_BOY_B 2.02 0.010 1.946 1.146 3.102 0.007
CC_BOY_C 21.78 0.100 0.325 0.400 0.823 0.070
Including 6.64 0.105 0.462 0.545 1.111 0.074
CC_BOY_D 7.69 0.006 0.541 0.565 1.113 0.006
Including 1.38 0.013 1.528 1.473 3.013 0.005
32
32APPENDIX
PALLADIUM MARKET & PEER
GROUP ANALYSIS
33COMPARABLE PGM
DEVELOPMENT PROJECTS*
3PGE+Au 3PGE+Au 3PGE+Au
Owner Primary Mine Primary 3PGE+Au
Project Owner Location Stage M&I Inferred Inferred
Market Cap Asset Type Metal M&I Grade
Resource Resource Grade
(C$M) (Y/N) (PdEq Moz) (PdEq Moz) (PdEq g/t) (PdEq g/t)
Generation
Pureplay PGM
North America
Marathon $11 Y Open Pit Ontario PEA-FS Pd 4.6 0.3 0.96 0.55
Mining
New Age
River Valley $6 Y Open Pit Ontario PEA Pd 2.4 0.8 0.74 0.50
Metals
Thunder Bay Panoramic
$192 N Open Pit Ontario Exploration Pt + Pd 0.6 0.0 1.80 2.10
North Resources
Ivanhoe
Platreef $3,105 N Underground South Africa Construction 3PGE + Au 35.7 45.0 3.21 2.77
Mines
Akanani Lonmin $361 N Underground South Africa Development 3PGE + Au 20.4 8.9 4.18 3.41
Pureplay PGM
Suhanko
Suhanko Artic n/a Y Open Pit Finland Scoping PGE + Au 6.8 5.4 1.80 1.85
Global
Platinum
Panoramic
Panton $192 N OP + UG Australia FS Pt + Pd 1.5 0.2 3.93 3.22
Resources
Eurasia
Monchetundra $24 Y Open Pit Russia Construction Pd 1.3 - 1.47 -
Mining
Jangada
Pedra Branca $8 Y Open Pit Brazil FS Pd 0.9 1.3 0.93 0.88
Mines
Twin Metals Antofagasta $17,617 N Underground USA Development Ni-Cu-PGM 23.7 14.5 0.57 0.37
NorthMet PolyMet $213 Y Open Pit USA FS Ni-Cu-PGM 6.2 5.2 0.30 0.32
Nickel Shaw Nickel Creek $12 Y Open Pit Yukon PEA Ni 4.8 1.7 0.47 0.49
By-Product PGM
North America
Noront
Eagle's Nest $98 Y Underground Ontario FS Ni-Cu-PGM 1.5 1.2 4.26 4.25
Resources
RNC
Dumont $233 N Open Pit Quebec FS Ni 1.3 0.3 0.02 0.02
Minerals
Mayville-
Grid Metals $5 Y Open Pit Manitoba PEA Ni-Cu-PGM 0.2 0.0 0.23 0.19
Makwa
Balmoral
Grasset $17 Y Underground Quebec Resource Ni-Cu-PGM 0.1 0.0 1.06 0.61
Resources
Tamarack North Talon Metals $51 Y Underground USA PEA Ni-Cu-PGM 0.1 0.1 0.79 0.53
*Company Filings, Capital IQ
34ONTARIO, A WORLD MINING HOTSPOT
Ontario has 28 operating mines, with 10 more advancing towards production
Mine Owner Commodity Status
Century Goldcorp Gold PFS/Permitting (2023)
Borden Goldcorp Gold Construction (Q1 2019)
Cochenour Goldcorp Gold Construction (n/a)
Sugar Harte Gold Gold DFS/Production (Q3 2018)
Goliath Treasury Gold PEA (2019)
Hardrock Premier/Centerra Gold DFS/Construction (2020)
Magino Argonaut Gold DFS/Permitting (2020)
Madsen Pure Gold Gold DFS (Q4 2019)
Springpole First Mining Gold PEA (Q4 2022)
PAK Frontier Lithium Lithium PFS (n/a)
35
35INVESTOR RELATIONS
JAMIE LEVY
President & CEO
jlevy@genmining.com
Phone: 416 567-2440
100 King St West, Suite 7010
Toronto, Ontario, Canada M5X 1B1
36You can also read