Corporate Presentation September 2021 - Driving growth, profitability and responsibility in the Trinidad energy industry
←
→
Page content transcription
If your browser does not render page correctly, please read the page content below

Corporate Presentation
September 2021

   Driving growth, profitability and
 responsibility in the Trinidad energy
                industry

                                         TSX : TXP | AIM : TXP   1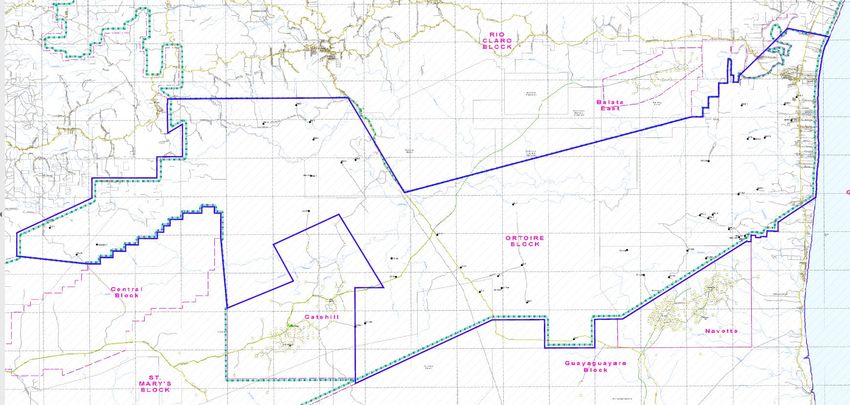
Touchstone at a Glance
Capital Structure
Common shares outstanding                         210,731,727
TSX share price (C$)(1)                                 $1.61
Market capitalization (C$)(2)                $339,278,080
First Half 2021 Results                                                           TSX : TXP
Average daily oil production (bbls/d)                   1,350
Petroleum sales ($000's)                             $13,706
Funds flow from operations ($000's)(3)                $1,743
Operating netback ($/bbl) (3)(4)                      $24.24
                                                                                   AIM : TXP
Reserves(5)                                 1P            2P
Reserves (MMboe)                           34.2          65.0
After tax NPV10 ($MM)                    $163.0       $289.2

                                                                Corporate Presentation | September 2021   2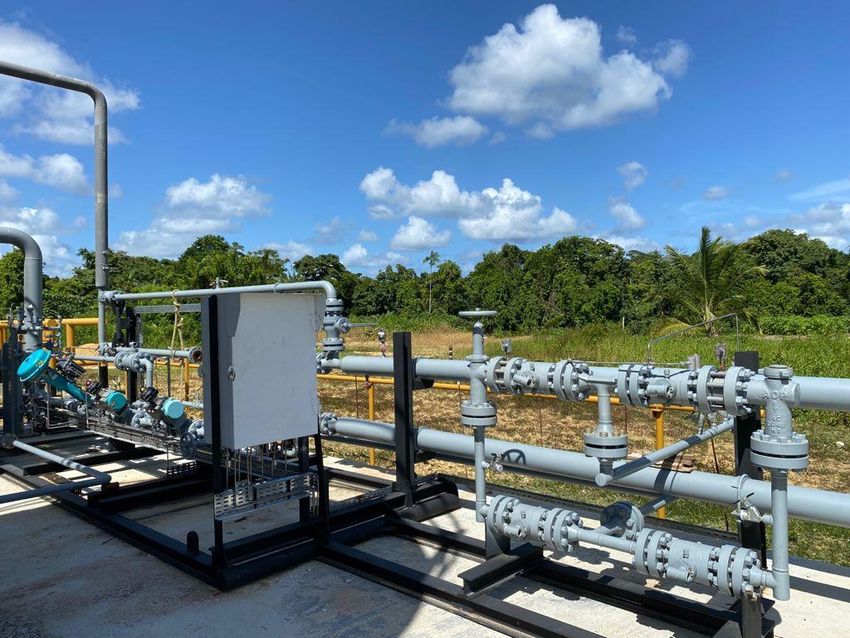
Why Touchstone
        Strong Assets and Management
            ➢ Experienced and dedicated board and management team
            ➢ Properties located in one of the richest hydrocarbon environments in the world
            ➢ World class discoveries on our exploration assets

        Sustainable
            ➢ Striving to be a leading supplier of natural gas in Trinidad and Tobago
            ➢ Operate in a manner that ensures the safety of all our employees
            ➢ Act in the best interest of our stakeholders

        Financially Disciplined
            ➢ Prudent management of the balance sheet
            ➢ Continually strive to optimize netbacks
            ➢ Targeting significant growth in our funds flow

                                                                              Corporate Presentation | September 2021   3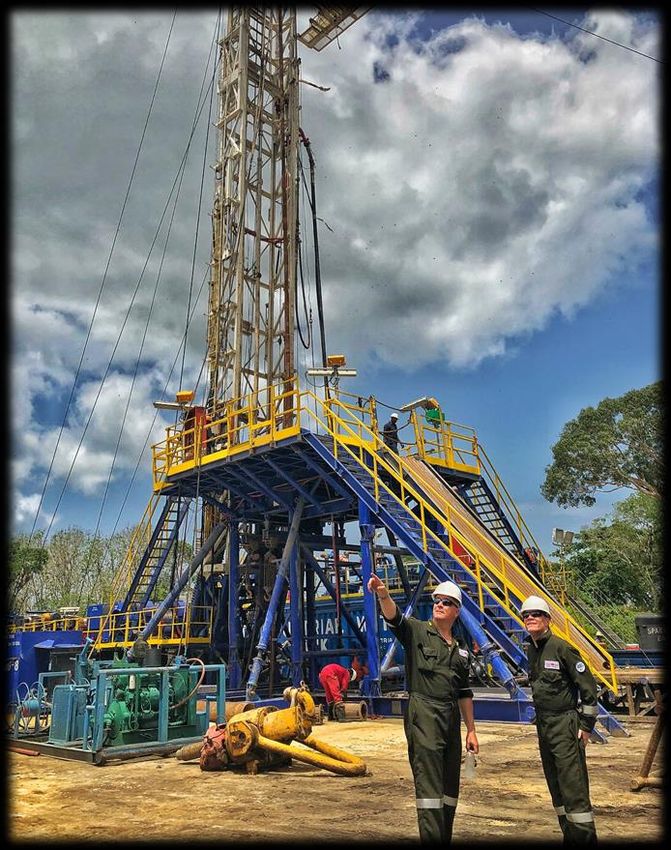
About Trinidad
                                     Energy-intensive           Access to world class
  Largest producer of oil
                                    industries such as                facilities
  and natural gas in the
                                 ammonia, methanol,            House one of the largest natural
       Caribbean(6)
    9th largest LNG supplier   fertilizers, and aluminium       gas processing facilities in the
                                 Methanol Holdings, Nutrien,       Western Hemisphere(6)
           worldwide(7)
                                  Nitrogen, Cantrex Limited

                                                                       Corporate Presentation | September 2021   4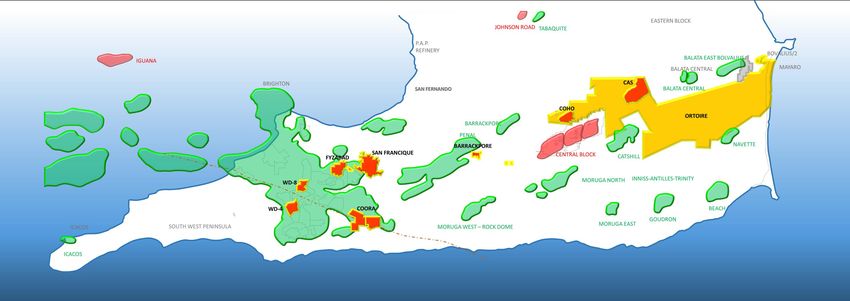
Hydrocarbon Rich Environment

                            Guyana Oil
      EASTERN               Discoveries
    VENEZUELAN    GUYANA                  Surname Oil
       BASIN     SURINAME                 Discoveries
                   BASIN

                                                    Corporate Presentation | September 2021   5
Trinidad Natural Gas – Supply and Consumption                                                                                                                              (8)
                              Trinidad Natural Gas Production and Consumption                                 5,000
                                                                                                                                            Trinidad Gas Consumption by Group
         4,500
                                           January 2015 - Present                                                                                 January 2017 to Present
         4,000
                                                                                                              4,000
         3,500
         3,000
                                                                                                              3,000

                                                                                                     MMcf/d
MMcf/d

         2,500
         2,000                               Current Production c. 2.50 Bcf/d
                                                                                                              2,000
         1,500
         1,000                                                                                                1,000
          500                   Average Historic Domestic Consumption c. 1,449 MMcf/d
            0                                                                                                    0

                      Domestic (MMcf/d)     LNG (MMcf/d)    Production (MMcf/d)   Total (MMcf/d)                 Power Generation           Ammonia Manufacture     Methanol Manufacture      Refinery
                                                                                                                 Iron & Steel Manufacture   Cement Manufacture      Ammonia Derivatives       Gas Processing
                                                                                                                 Small Consumers            LNG
                            Production                                                                                                Consumption
                 Total Trinidad Natural Gas Production                                    Total Natural Gas Demand                                    Domestic Natural Gas Demand
                                                                                          ~ 95% of Total Production                                   ~ 45% of Total Demand
                 2015 Average             3.83 Bcf/d                                      2015 Total Avg.                    3.58 Bcf/d               2015 Domestic Avg.                   1.61 Bcf/d
                 2016 Average             3.33 Bcf/d                                      2016 Total Avg.                    3.11 Bcf/d               2016 Domestic Avg.                   1.45 Bcf/d
                 2017 Average             3.35 Bcf/d                                      2017 Total Avg.                    3.18 Bcf/d               2017 Domestic Avg.                   1.45 Bcf/d
                 2018 Average             3.58 Bcf/d                                      2018 Total Avg.                    3.39 Bcf/d               2018 Domestic Avg.                   1.46 Bcf/d
                 2019 Average             3.59 Bcf/d                                      2019 Total Avg.                    3.44 Bcf/d               2019 Domestic Avg.                   1.47 Bcf/d
                 2020 Average             3.04 Bcf/d                                      2020 Total Avg.                    2.93 Bcf/d               2020 Domestic Avg.                   1.28 Bcf/d
                 2021 Average YTD         2.74 Bcf/d                                      2021 Total Avg. YTD                2.57 Bcf/d               2021 Domestic Avg. YTD               1.40 Bcf/d

                                                                                                                                                           Corporate Presentation | September 2021             6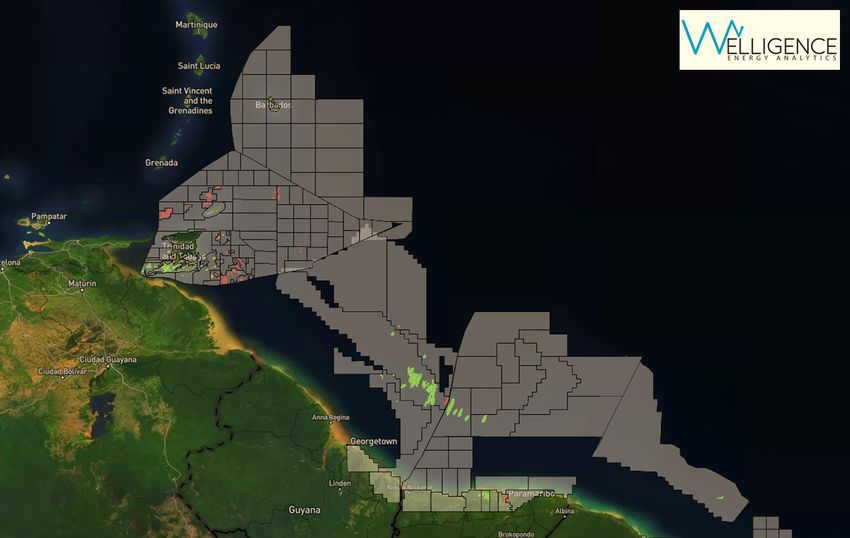
Touchstone Land Holdings
            Core Exploration Acreage                                                                     Oil Pool
                                                Developed Acreage
            34,468 net working interest acres   6,418 net working interest acres
                                                                                                         Gas Pool

    N
W       E
    S

                                                                                   Corporate Presentation | September 2021   7
Touchstone Assets
                       ➢ Current field production is approximately 1,350 bbls/d
Producing blocks       ➢ Total proved plus probable reserves of 16,462 Mboe(5)

                       ➢ 1 development well scheduled (12)
Coho                   ➢ Estimated net initial production of approximately 1,333 boe/d(9)
                       ➢ Total proved plus probable reserved of 3,454 Mboe(5)

                       ➢ 8 development well locations identified (12)
Cascadura              ➢ Estimated net initial production of approximately 9,200 boe/d(9)
                       ➢ Total proved plus probable reserves of 45,031 Mboe(5)

                       ➢ Completing phase one of our exploration program
                       ➢ Three exploration prospects in our phase two exploration outlook (12) (13)
Exploration                ➢ Krakken, Steelhead and Guabine
                       ➢ Identified an additional 20 exploration prospects (12) (13)

                       ➢ Trinidad is a hydrocarbon rich environment with opportunities for M&A
Growth Opportunities   ➢ Projected funds flow to deploy for business expansion
                       ➢ Onshore bid round

                                                                                 Corporate Presentation | September 2021   8
Producing Blocks
“A 20-year crude oil drilling program providing Touchstone with a strong organic growth platform.”

 H1 2021 crude oil production of
                                         7 Producing fields             215 Drilling locations(10)
          1,350 bbls/d

                                                                        Corporate Presentation | September 2021   9
Ortoire Operations
                                        NGC GAS PIPELINE

                                                                                                                   Balata East
                                                                                                                   10 MMbbls

                                                                    CASCADURA
                                                                    Full Development

                                          Cascadura-1ST1
                                                                                           HERITAGE OIL PIPELINE
                                                                          CHINOOK
                                                                          Full Development

                   COHO
                   Full Development                           GAUBINE                  ROYSTON            KRAKKEN
                                                              Herrera Prospect         Full Development   Cretaceous Prospect

                               Baraka
                                East

COHO                                                                                                      STEELHEAD
Planned Pipeline    Baraka
                                                                                                          Karamat Prospect

                                                                                                                                          Navette
                                                                                                                                          57 MMbbls
                                                  Catshill
                                                  30 MMbbls
 Carapal Ridge
                                                                                                                                 Gas Discovery        Gas Development Pad

                                                                                                                                 Oil Discovery        Oil Development Pad

                                                                                                                                 Unknown Result       Exploration Location

                                                                                                                                  Corporate Presentation | September 2021    10
Coho
Coho
Reserves (2P)(5) 3,454 Mboe
2P before tax NPV10(5) $23.9 MM
Wells drilled
Coho-1
Depth 8,560 ft.
Feet of pay(9) 105 ft.
Formation Herrera GR7b
Estimated initial production (net)(9) 1,333 boe/d
Development wells(12) 1
Exploration prospects(12) 2
Corporate Presentation | September 2021 11Cascadura
Cascadura
Reserves(5) 45,031 Mboe
2P before tax NPV10(5) $411.8 MM
Wells drilled
CAS-1ST1
Depth 6,350 ft.
Feet of pay(9) 1,037 ft.
Lower formation - test 1 GR7c/GR7b
Upper formation - test 2 GR7bc
Estimated initial production(9) 6,133 boe/d
CAS Deep-1
Depth 8,303 ft.
Feet of pay(9) 2,100 ft.
Formation Herrera GR7abc
Estimated initial production (net)(9) 3,067 boe/d
Development wells(12) 3-6
Exploration prospects(12) 5
Corporate Presentation | September 2021 12Royston-1 – Natural Gas Prospect
Royston Shell Trinidad Limited
Reserves None assigned Lizard Springs (OL-4)
c. 1965
Wells drilled
Royston-1 Put new Seismic in this!
Spud date August 12, 2021
Estimated total depth 10,700 ft.
Targeted formation Herrera GR7a/GR7bc
Development wells -
Exploration prospects(12) 7
Corporate Presentation | September 2021 13Ortoire Phase Two Exploration (13)
Outlook NGC GAS PIPELINE
Balata East
10 MMbbls
HERITAGE OIL PIPELINE
GUABINE KRAKKEN
Herrera Prospect Cretaceous Prospect
Baraka
East
STEELHEAD
Baraka
Karamat Prospect
Navette
57 MMbbls
Catshill
30 MMbbls
Carapal Ridge
Corporate Presentation | September 2021 14Reserve Growth
1P Net reserve additions increased 189% from 2019
Gross Reserves Summary(11) 2P Net reserve additions increased 194% from 2019
(Mboe) 3P Net reserve additions increased 236% from 2019
120,000
100,150
100,000
80,000
Mboe
64,947
60,000
40,000 29,791
34,238
24,456 25,540
20,376 22,056
18,535 19,275
20,000 15,698
10,733 11,222 11,840
8,977
-
2016 2017 2018 2019 2020
Proved (1P) Proved + Probable (2P) Proved + Probable + Possible (3P)
Corporate Presentation | September 2021 152021 Capital Overview
First Half 2021 Second Half 2021
Exploration and seismic Exploration and seismic
➢ Completed and tested Chinook -1 and Cas ➢ Drill and test Royston-1
Deep-1 $2.7
➢ Completed 22 km. 2D seismic program in ➢ Analyze and process seismic shot at Ortoire
Royston area
➢ Acquired seismic on our legacy blocks
Facilities and pipelines Facilities and pipelines
$5.3
➢ Constructed coho facility ➢ Construct pipeline at Coho and bring the
well onto production
➢ Complete the Environmental Impact
Assessment and source materials for the $3.8
facility at Cascadura
Maintenance and development Maintenance and development
➢ Workovers and completions ➢ Workovers and completions
➢ Drill four minimum work obligation wells on
our legacy blocks
Corporate Presentation | September 2021 162022 and Beyond
Significant growth opportunity for Touchstone and the Trinidad oil and gas industry
Mid term
➢ Complete the Cascadura production facility which is initially designed for 90 MMcf/d, expandable up to
200 MMcf/d
➢ Bring both Cascadura wells online, initial estimated net production to be in excess of 9,200 boe/d(9)
➢ Continue with phase two of our exploration prospects at Ortoire, including Steelhead, Krakken and
Guabine (12) (13)
➢ Design and begin to drill development well locations at Cascadura(12)
➢ Drill a minimum of four development wells per year on our legacy blocks
Long term
➢ Evaluate the additional 20 exploration prospects on the Ortoire Block (12) (13)
➢ Be an industry leader on reducing greenhouse gas emissions and environmental impacts
➢ Be a leading onshore energy producer in the Caribbean
Corporate Presentation | September 2021 17Vision and Values
➢ Provide an inclusive and respectful work environment
➢ 82% of our workforce are from Trinidad
➢ 24% of our workforce are women
➢ Operate in an environmentally responsible manner to reduce our
environmental footprint
➢ 740+ days since an environmental incident
➢ Leading industry's initiative to eliminate surface release of produced water
➢ Aiming to capture all solution gas from our wells and sales facilities to sell or
use in our operations
➢ Conduct business in manner that ensures the safety of all
stakeholders
➢ YTD 2021 lost time recordable incident frequency of nil
➢ Work to enhance the local communities involved in our daily
operations
➢ Donated over 380 food hampers in local communities since the onset of
COVID-19
➢ Close affiliation with local charities and schools
Corporate Presentation | September 2021 18Driving growth, profitability and
responsibility in the Trinidad energy
industry
TSX : TXP | AIM : TXP 19Corporate Information Abbreviations
Head Office Year End: December 31 bbl(s) barrel(s)
Suite 4100, 350 7th Ave SW bbls/d barrels per day
Calgary, AB T2P 3N9 Engineers: GLJ Ltd.
Mbbls thousand barrels
Office: (403) 750-4400 Auditors: Ernst & Young LLP MMbbls million barrels
Website: www.touchstoneexploration.com
Fax: (403) 266-5794 Legal: Norton Rose Fulbright LLP
info@touchstoneexploration.com Nunez & Co. Mcf thousand cubic feet
Mcf/d thousand cubic feet per day
Trinidad Office Transfer Agent: Odyssey Trust Company MMcf million cubic feet
Touchstone Exploration (Trinidad) Ltd. MMcf/d million cubic feet per day
#30 Forest Reserve Road Bcf billion cubic feet
Fyzabad, Trinidad Bcf/s Billion cubic feet per day
Office: (868) 677-7411 MMBtu million British Thermal Units
Contacts boe barrels of oil equivalent
Paul R. Baay boe/d barrels of oil equivalent per day
President and Chief Executive Officer Mboe thousand barrels of oil equivalent
pbaay@touchstoneexploration.com
MMboe million barrels of oil equivalent
(403) 750-4488
Scott Budau AIM AIM market of the London Stock Exchange plc
Chief Financial Officer AOF Absolute open flow rate
sbudau@touchstoneexploration.com Brent Dated Brent
(403) 750-4445
LOA Lease Operator Agreement
James Shipka NGLs Natural gas liquids
Chief Operating Officer SPT Supplemental Petroleum Tax
jshipka@touchstoneexploration.com
TSX Toronto Stock Exchange
(403) 750-4455
$ or US$ United States dollars
$MM million dollars
Corporate Presentation | September 2021 20End Notes
1) Touchstone’s September 10, 2021 closing share price on the TSX.
2) Calculated as the product of the Company’s TSX common share closing price on September 10, 2021 (C$1.61/share) and 210,731,727 common shares outstanding.
3) Non-GAAP measure. Refer to "Advisories: Non-GAAP Measures".
4) Operating
. Netback Six months ended
($000’s unless otherwise indicated) June 30, 2021
Petroleum revenue 13,706
Royalties (4,153)
Operating expenses (3,610)
Operating netback 5,943
Total production (bbls) 245,175
Operating netback ($/bbl) 24.24
5) Based on December 31, 2020 GLJ Ltd. independent reserves evaluations. See "Advisories: Oil and Gas Reserves".
6) Source: Ministry of Energy and Energy Affairs, Oil and Gas Industry Overview.
7) Source: BP Statistical Review of World Energy 2021.
8) Source: Ministry of Energy and Energy Industries Publications: https:www.energy.gov.tt/publications/
9) Coho-1, CAS-1ST1 and CAS Deep-1 feet of pay and estimated initial net production are based off drilling and production test results. Actual results may differ from
estimates, and such variances may be material. See "Advisories: Forward-looking Statements" and "Advisories: Oil and Gas Drilling and Test Results".
Corporate Presentation | September 2021 21End Notes
10) Development drilling locations are based on December 31, 2020 GLJ Ltd. independent reserves evaluation and internal estimates. See "Advisories: Drilling Locations".
11) Based on December 31, 2016 , December 31, 2017 , December 31, 2018, December 31, 2019 and December 31, 2020 GLJ Ltd. independent reserves evaluations. See
"Advisories: Oil and Gas Reserves" and "Advisories: Oil and Gas Metrics".
12) Ortoire development and exploration drilling locations are solely based on current internal estimates. See "Advisories: Drilling Locations".
13) Ortoire phase two exploration is subject to an extension of the Company’s Ortoire exploration and production licence. See "Advisories: Forward-Looking Statements".
Corporate Presentation | September 2021 22Advisories
Currency
Unless otherwise stated, all financial amounts herein are presented in United States dollars. The Company may also reference Canadian dollars ("C$"), Trinidad and Tobago dollars ("TT$") and Pounds Sterling ("£") herein.
Forward-Looking Statements
Certain information regarding Touchstone Exploration Inc. ("Touchstone", "we", "our", "us", or the "Company") set forth in this presentation may constitute forward-looking statements and information (collectively, "forward-
looking statements") within the meaning of applicable securities laws. All statements other than statements of historical fact may be forward-looking statements. Forward-looking statements are often, but not always, identified by
the use of words such as “seek”, “anticipate”, “plan”, “continue”, “estimate”, “expect”, “may”, “will”, “project”, “predict”, “potential”, “targeting”, “intend”, “could”, “might”, “should”, “believe” and other similar expressions.
Forward-looking statements in this presentation include, but are not limited to, those in respect of the Company’s exploration, development and production opportunities and activities, including anticipated drilling, timing,
production testing, development, tie-in, facilities construction, and ultimate production and production rates from exploration and development wells; the quality and quantity of prospective hydrocarbon accumulations based on
wireline logs, including the Company's interpretations thereof; field estimated production rates; the Company's expectation of future funds flow and capital expenditures; the Company's future Ortoire exploration activities and the
expectation of an Ortoire licence extension; the extent to which local communities will benefit from the Company's operations; the sufficiency of resources and available financing to fund future capital expenditures and maintain
financial liquidity; and general business strategies and objectives. Statements relating to “reserves” and “resources” are deemed to be forward-looking statements, as they involve the implied assessment, based on certain
estimates and assumptions, that the reserves and resources described exist in the quantities predicted or estimated and can be profitably produced in the future. The Company has a reasonable basis for disclosing such
statements, which represent the Company’s internal projections, estimates or beliefs concerning future growth, and results of operations.
With respect to forward-looking statements contained in this presentation, the Company has made assumptions regarding: financial condition, outlook and results of operations, exploration, development and associated
operational plans (including drilling, testing, facilities construction and recompletion programs) and the anticipated costs and timing thereof; estimated oil and gas reserves (including the magnitude, ability to recover,
commerciality and net present value thereof); production rates and production decline rates; net feet of pay based on internal estimates of wireline logs; the success of exploration opportunities; plans for and results of production
testing; the ability to secure necessary personnel, equipment, production licences, regulatory approvals and services; environmental matters; future commodity prices; changes to prevailing regulatory, royalty, tax and
environmental laws and regulations; the impact of competition, future capital and other expenditures (including the amount, nature and sources of funding thereof); future financing sources; and business prospects and
opportunities; and the impact the COVID-19 pandemic will have on the Company’s future operations and future petroleum pricing, among other things.
Since forward-looking statements address future events and conditions, by their very nature they involve inherent risks and uncertainties. Actual results could differ materially from those currently anticipated due to a number of
factors and risks. New factors emerge from time to time, and it is not possible for Management to predict all of such factors and to assess in advance the impact of each such factor on Touchstone’s business or the extent to which
any factor, or combination of factors, may cause actual results to differ materially from those contained in any forward-looking statements. Although the Company believes that the expectations and assumptions on which the
forward-looking statements are based are reasonable, undue reliance should not be placed on the forward-looking statements because the Company can give no assurance that they will prove to be correct. Some of the risks that
could affect the Company's future results and could cause results to differ materially from those expressed in the forward-looking information are described under the heading "Advisories: Business Risks" in this presentation and
are also set out in more detail in the Company's 2020 Annual Information Form dated March 25, 2021 which has been filed on SEDAR and can be accessed at www.sedar.com.
Corporate Presentation | September 2021 23Advisories
Forward-Looking Statements (Continued)
Investors should not place undue reliance on any such forward-looking statements or information. Further, any forward-looking statement or information speaks only as of the date on which such statement is made, and
Touchstone undertakes no obligation to update any forward-looking statements or information except as required by law, including securities laws. All forward-looking statements and information contained in this presentation
are qualified by such cautionary statements.
This presentation is for information purposes only and is not under any circumstances to be construed as a prospectus or an advertisement for a public offering of such securities. No securities commission or similar authority in
Canada or elsewhere or the Toronto Stock Exchange has in any way passed upon this presentation, or the merits of any securities of Touchstone Exploration Inc., and any representation to the contrary is an offence. An investment
in Touchstone Exploration Inc.’s securities should be considered highly speculative due to the nature of the proposed involvement in the exploration for and production of oil and natural gas.
This presentation and the information contained herein do not constitute an offer to sell or a solicitation of an offer to buy any securities in the United States. The securities of Touchstone Exploration Inc. have not been registered
under the United States Securities Act of 1933, as amended (the "U.S. Securities Act") or any state securities laws and may not be offered or sold within the United States or to U.S. Persons unless registered under the U.S.
Securities Act and applicable state securities laws or an exemption from such registration is available.
Business Risks
The Company is exposed to numerous operational, technical, financial and regulatory risks and uncertainties, many of which are beyond its control and may significantly affect anticipated future results. The Company is exposed to
risks associated with negotiating with foreign governments as well as country risk associated with conducting international activities. Operations may be unsuccessful or delayed as a result of competition for services, supplies and
equipment, mechanical and technical difficulties, ability to attract and retain qualified employees on a cost-effective basis, commodity and marketing risk. The Company is subject to significant drilling risks and uncertainties
including the ability to find oil and gas reserves on an economic basis and the potential for technical problems that could lead to well blow-outs and environmental damage. The Company is exposed to risks relating to the inability
to obtain timely regulatory approvals, surface access, access to third-party gathering and processing facilities, transportation and other third-party related operation risks. The Company is subject to industry conditions including
changes in laws and regulations, including the adoption of new environmental laws and regulations and changes in how they are interpreted and enforced. There are uncertainties in estimating the Company’s reserve and resource
base due to the complexities in estimated future production, costs and timing of expenses and future capital. The Company is subject to the risk that it will not be able to fulfill the contractual obligations required to retain its rights
to explore, develop and exploit any of its properties. The financial risks the Company is exposed to include, but are not limited to, the impact of general economic conditions in Canada, the United Kingdom and Trinidad, continued
volatility in market prices for oil and gas, the impact of significant declines in market prices for oil and gas, the ability to access sufficient capital from internal and external sources, changes in income tax laws, royalties and
incentive programs relating to the oil and gas industry, fluctuations in interest rates, the C$ to US$ exchange rate and the US$ to TT$ exchange rate. The Company is subject to local regulatory legislation, the compliance with which
may require significant expenditures and non-compliance with which may result in fines, penalties or production restrictions or the termination of licence, LOA or farm-in rights related to the Company’s oil and gas interests in
Trinidad. Certain of these risks are set out in more detail in the Company’s 2020 Annual Information Form dated March 25, 2021 which has been filed on SEDAR and can be accessed at www.sedar.com.
Corporate Presentation | September 2021 24Advisories
Business Risks (Continued)
On March 11, 2020, the World Health Organization declared the outbreak of a strain of novel coronavirus disease, COVID-19, a global pandemic. The COVID-19 pandemic resulted in emergency actions taken by governments
worldwide which has had an effect in all of the Company's operating jurisdictions. The actions taken in 2020 and 2021 by various governments have typically included but have not been limited to travel bans, mandatory and self-
imposed quarantines and isolations, physical distancing, and the closing of non-essential businesses which has had significant negative effects on economies, including a substantial decline in crude oil demand. Additionally, such
actions resulted in volatility and disruptions in regular business operations, supply chains and financial markets as well as declining trade and market sentiment. COVID-19 as well as other factors initially resulted in the deepest
drop in crude oil prices that global markets have seen since 1991. With the rapid spread and resurgence of COVID-19 and its variants, oil prices and the global equity markets deteriorated significantly in 2020. These events and
conditions caused a significant decrease in the valuation of oil and natural gas companies in 2020 and a decrease in confidence in the oil and natural gas industry.
While market conditions have recently improved, the full extent of the risks surrounding the COVID-19 pandemic is continually evolving in light of an effective global distribution of effective vaccines and also through subsequent
waves, or additional variants of COVID-19 continue to emerge which are more transmissible or cause more severe disease. The risks disclosed in the Company's Annual Information Form for the year ended December 31, 2020 may
be exacerbated as a result of the COVID-19 pandemic; market risks related to the volatility of oil and gas prices, volatility of foreign exchange rates and volatility of the market price of the Company's common shares; operational
risks related to increasing operating costs or declines in production levels, capital project delays, international shipping delays, delays in receiving government regulatory approvals, marketing arrangement counterparty
performance or payment delays, and government regulations; ability to obtain additional financing; and other risks related to cyber-security as the Company's workforce in Canada and Trinidad predominantly works from remote
connections, accounting adjustments, effectiveness of internal controls, and reliance on key personnel, management, and labour.
Oil and Gas Reserves
The reserves information for the Company’s December 31, 2020 independent reserve report have been prepared by Touchstone’s independent reserves evaluator, GLJ Ltd. ("GLJ"), dated March 4, 2021. The report was prepared in
accordance with definitions, standards and procedures contained in the Canadian Oil and Gas Evaluation Handbook ("COGEH") and National Instrument 51-101 - Standards of Disclosure for Oil and Gas Activities ("NI 51-101"). All
December 31, 2020 reserves presented are based on GLJ’s forecast pricing dated January 1, 2021 and estimated costs effective December 31, 2020. Additional 2020 reserves information, as required under NI 51-101, are included
in the Company’s 2020 Annual Information Form dated March 25, 2021. The reserves information for the Company’s December 31, 2019 independent reserve report have been prepared by Touchstone’s independent reserves
evaluator, GLJ, dated March 4, 2020. The report was prepared in accordance with definitions, standards and procedures contained in the COGEH and NI 51-101. All December 31, 2019 reserves presented are based on GLJ’s
forecast pricing dated January 1, 2020 and estimated costs effective December 31, 2019. Additional 2019 reserves information, as required under NI 51-101, are included in the Company’s 2019 Annual Information Form dated
March 25, 2020. The reserves information for the Company’s December 31, 2018 independent reserve report have been prepared by Touchstone’s independent reserves evaluator, GLJ, dated March 6, 2019. The report was
prepared in accordance with definitions, standards and procedures contained in the COGEH and NI 51-101. All December 31, 2018 reserves presented are based on GLJ’s forecast pricing dated January 1, 2019 and estimated costs
effective December 31, 2018. Additional reserves information as required under NI 51-101 are included in the Company’s 2018 Annual Information Form dated March 26, 2019. The reserves information for the Company’s
December 31, 2017 independent reserve report have been prepared by Touchstone’s independent reserves evaluator, GLJ, dated March 7, 2018. The report was prepared in accordance with definitions, standards and procedures
contained in the COGEH and NI 51-101. All December 31, 2017 reserves presented are based on GLJ’s forecast pricing dated January 1, 2018 and estimated costs effective December 31, 2017. Additional reserves information as
required under NI 51-101 are included in the Company’s Annual Information Form dated March 26, 2018. The reserves information for the Company’s December 31, 2016 independent reserve report have been prepared by
Touchstone’s independent reserves evaluator, GLJ, dated March 17, 2017. The report was prepared in accordance with definitions, standards and procedures contained in the COGEH and NI 51-101. All December 31, 2016
reserves presented are based on GLJ’s forecast pricing dated January 1, 2017 and estimated costs effective December 31, 2016 Additional reserves information as required under NI 51-101 are included in the Company’s Annual
Information Form dated March 21, 2017. The Company's Annual Information Forms for 2016, 2017, 2018, 2019 and 2020 have been filed on SEDAR and can be accessed at www.sedar.com.
Corporate Presentation | September 2021 25Advisories
Oil and Gas Measures
Where applicable, natural gas has been converted to barrels of oil equivalent based on six thousand cubic feet to one barrel of oil. The barrel of oil equivalent rate is based on an energy equivalent conversion method primarily
applicable at the burner tip, and given that the value ratio based on the current price of crude oil as compared to natural gas is significantly different than the energy equivalency of the 6:1 conversion ratio, utilizing the 6:1
conversion ratio may be misleading as an indication of value.
Oil and Gas Metrics
Net reserve additions are calculated as the change in reserves from the beginning to the end of the applicable period excluding period production. Management uses this measure to determine the relative change of its reserves
base over a period of time.
Oil and Gas Drilling and Test Results
References in this presentation to net feet of pay is based on the Company's interpretation of wireline logs, which is not necessarily indicative of the quantity and quality of prospective hydrocarbon accumulations.
References in this presentation to production test rates and initial flow rates are useful in confirming the presence of hydrocarbons; however, such rates are not determinative of the rates at which such wells will commence
production and decline thereafter and are not indicative of long-term performance or of ultimate recovery. Additionally, such rates may also include recovered "load oil" fluids used in well completion stimulation. While
encouraging, readers are cautioned not to place reliance on such rates in calculating the aggregate production for the Company.
Drilling Locations
This presentation discloses total drilling locations. Drilling locations are classified into three categories: (i) proved locations; (ii) probable locations; and (iii) unbooked locations. Proved locations and probable locations are derived
from the Company's reserves evaluation of GLJ Ltd. effective December 31, 2020 and account for locations that have associated proved and/or probable reserves, as applicable. Unbooked locations are internal estimates based on
the prospective acreage associated with the Company’s assets and an assumption as to the number of wells that can be drilled based on industry practice and internal review. Unbooked locations do not have attributed reserves.
Of the approximately 215 (net) drilling locations identified herein, 40 are proved locations; 21 are probable locations; and the remaining are unbooked locations. Unbooked locations have been identified by Management as an
estimation of potential multi-year drilling activities based on evaluation of applicable geologic, seismic, engineering, production and reserves information. There is no certainty that the Company will drill all unbooked drilling
locations, and if drilled there is no certainty that such locations will result in additional oil and gas reserves or production. The locations on which the Company will drill wells will ultimately depend upon the availability of capital,
regulatory approvals, crude oil and natural gas prices, costs, actual drilling results, additional reservoir information that can be obtained and other factors. While certain of the unbooked drilling locations have been de-risked by
drilling existing wells in relative close proximity to such unbooked drilling locations, other unbooked drilling locations are farther away from existing wells where Management has less information about the characteristics of the
reservoir, and therefore there is more uncertainty whether wells will be drilled in such locations; and if drilled there is more uncertainty that such wells will result in additional oil and gas reserves or production.
Corporate Presentation | September 2021 26Advisories
Non-GAAP Measures
This presentation may contain terms commonly used in the oil and natural gas industry, such as funds flow from operations and operating netback. These terms do not have a standardized meaning under Generally Accepted
Accounting Principles ("GAAP") and may not be comparable to similar measures presented by other companies. Shareholders and investors are cautioned that these measures should not be construed as alternatives to cash
provided by operating activities, net income, or other measures of financial performance as determined in accordance with GAAP. Management uses these non-GAAP measures for its own performance measurement and to
provide stakeholders with measures to compare the Company’s operations over time.
Funds flow from operations is an additional GAAP measure included in the Company's consolidated statements of cash flows. Funds flow from operations represents net earnings (loss) excluding non-cash items. Touchstone
considers funds flow from operations to be an important measure of the Company's ability to generate the funds necessary to finance capital expenditures and repay debt.
The Company uses operating netback as a key performance indicator of field results. Operating netback is presented on a total and per barrel basis and is calculated by deducting royalties and operating expenses from petroleum
sales. If applicable, the Company also discloses operating netback both prior to realized gains or losses on derivatives and after the impacts of derivatives are included. Realized gains or losses represent the portion of risk
management contracts that have settled in cash during the period, and disclosing this impact provides Management and investors with transparent measures that reflect how the Company's risk management program can affect
netback metrics. The Company considers operating netback to be a key measure as it demonstrates Touchstone's profitability relative to current commodity prices. This measurement assists Management and investors with
evaluating operating results on a historical basis. Please refer to endnote 4 for further information.
Corporate Presentation | September 2021 27You can also read