Correlation between optic disc deformation and retinal vasculature in non-pathological high myopia
←
→
Page content transcription
If your browser does not render page correctly, please read the page content below
Preprint: Please note that this article has not completed peer review.

Correlation between optic disc deformation and
retinal vasculature in non-pathological high myopia
CURRENT STATUS:                    POSTED

Jiao Sun
Capital Medical University Affiliated Beijing Friendship Hospital

Jialin Wang
Capital Medical University Affiliated Beijing Friendship Hospital

 wangjialin@bjmu.edu.cnCorresponding Author
ORCiD: https://orcid.org/0000-0001-7877-1620

Yanling Wang
Capital Medical University Affiliated Beijing Friendship Hospital

DOI:
  10.21203/rs.2.18090/v1
SUBJECT AREAS
 Ophthalmology
KEYWORDS
 tilt ratio, high myopia, OCT angiography, VFD

                                                   1
Abstract
Background: The aim of this study was to investigate the correlation between optic disc deformation
and retinal vasculature in high myopia.
Methods: One hundred and thirty eyes with non-pathological high myopia were included in this cross-
sectional study. The optic disc tilt ratio, and horizontal and vertical disc diameters were analyzed
using fundus color photography. A 3 × 3 mm2 grid and a 4.5 × 4.5 mm2 grid were used to scan
parafoveal and peripapillary regions, respectively, using optical coherence tomography angiography.
Vessel flow density (VFD) and fractal dimension of the retina and the foveal avascular zone (FAZ)
were analyzed and quantified using en face projection images. Optic disc parameters that were
associated with vascular changes were determined using multiple linear regression analysis.
Results: Results from the multivariate analysis revealed that the tilt ratio (β = -2.291, p = 0.025) was
negatively correlated with three sectors in the deep layer. Age was negatively correlated with the VFD
of the retina (β = -2.161; p < 0.034). Additionally, FAZ was not significantly correlated with any
factors in the current study. Further, there was a positive correlation between retinal nerve fiber layer
thickness and VFD of the optic nerve head (β = -2.146, p = 0.035).
Conclusions: Overall, our results demonstrated that optic disc deformation was negatively correlated
with the retinal microvasculature in non-pathological high myopia. Therefore, optic disc deformation
may be used to predict the retinal vasculature in high myopia.
Background
Myopia is one of the most commonly reported ocular disorders worldwide, and there has recently
been a significant increase in the myopic population in China. The costs of examinations and surgical
corrections of myopia are significant, and this disorder has been associated with other pathological
eye conditions.
In addition, studies have reported that myopia increases the risk of glaucoma, but the mechanisms
underlying this relationship are still unknown. However, studies have reported that the morphological
changes in the optic disc that are induced by axial elongation, such as β-zone parapapillary atrophy
(β-PPA), tilt, and rotation, in myopic eyes play an important role in the development of glaucoma [1
22]. Another study [3] reported that the quadrantal alterations in myopic eyes were not even, and the
biggest changes were noted in the inferior nasal sector. Tilting of the disc in myopic eyes can lead to
erroneous diagnoses of glaucoma in patients and can also be a risk factor for glaucoma. The optic
disc becomes smaller as myopia progresses [4]; therefore, we hypothesized that myopic deformation
of the optic disc may be associated with macular and disc perfusion.
Optical coherence tomography angiography (OCTA) is a novel, noninvasive technology that provides
depth-resolved visualization of the retinal and choroidal microvasculature. Previous studies that used
different imaging modalities demonstrated that there was reduced retinal and choroidal perfusion in
high myopia. Additionally, there is a growing body of evidence suggesting that vascular dysfunction
may also be a complication of myopia. Thus, it is crucial to study retinal perfusion in myopic eyes to
provide baseline information regarding the physiological variations among different stages of myopia.
This information will ultimately aid in the early diagnosis and monitoring of chorioretinal atrophy in
eyes with high myopia. Therefore, the purpose of the present study was to determine the correlation
between myopia vasculature and optic disc deformation using OCTA imaging.
Methods
Participants
This study was approved by the Beijing friendship hospital (Beijing, China) and conducted in
accordance with the ethical standards stated in the Declaration of Helsinki. Additionally, the study
was carried out in accordance with the Health Insurance Portability and Accountability Act, and
written informed consent was obtained from all examined patients and volunteer participants before
OCTA imaging.
Each subject underwent a complete ocular examination that included best-corrected visual acuity
testing, intraocular pressure (IOP) evaluations using an automatic tonometer, slit-lamp examinations,
funduscopy, and axial length (AL) measurements using optical biometry (IOL Master; Carl Zeiss
Meditec, Jena, Germany).
Subjects with high myopia and a refraction greater than 6 diopters (D) or axial lengths longer than
26.5 mm were included in this study. Any patient with a history of prior vitreous or retinal surgery, an
3IOP >21 mmHg, or evidence of retinal disease (other than myopic degeneration) that affected the retinal or choroidal vasculature by history or examination was excluded from the study. Eyes with diffuse retinal pigment epitheliopathy (RPE) atrophy due to high myopia or any structural changes, including myopic choroidal neovascularization, were also excluded from the analyses. Image acquisition and analysis OCTA imaging was performed using an RTVue XR Avanti with AngioVue (Optovue Inc., Fremont, California, USA) at a scanning speed of 70,000 A-scans per second. All imaging was performed by a single operator (JS). The scan protocol examined a 3.0×3.0 mm2 area that focused on the macula and a 4.5×4.5 mm2 area that focused on the optic disc. We obtained a horizontal-priority (X-scan) and a vertical-priority (Y-scan) in approximately 2.9 seconds for each of the two raster scans. The superficial retinal plexus (SRP) was segmented from the outer boundary of the inner limiting membrane (ILM) to the outer boundary of the inner plexiform layer (IPL),which extends from 3 μm below the ILM to 15 μm below the IPL. The deep retinal plexus (DRP) was segmented from the outer boundary of the IPL to the outer boundary of the outer plexiform layer, which extends from 15 to 70 μm below the IPL. Since the magnification is different in myopic eyes, the imaging sampling density used in myopic eyes must be lower than that used in normal eyes. Therefore, we corrected the magnification of images obtained from highly myopic eyes using Bennett’s formula [5]. The RTVue instrument was also used to measure the retinal nerve fiber layer (RNFL) thickness and cup-to-disc ratio from the OCT B-scans. Two independent examiners (JS, JLW) reviewed the images. Poor-quality images were excluded based on the following criteria: (1) evidence of poor fixation, including a double vessel pattern and motion artifacts; (2) the presence of motion artifacts that could not be corrected by motion correction technology; (3) media opacity, as marked by shadowing or obscuration of the vessel signal in the field of view or a signal strength index of
High-resolution digital color fundus photographs were taken using a digital retina camera (Kowa

Nonmyd WX; Kowa Company Ltd, Japan). Image processing of optic disc tilt ratio, and horizontal and

vertical optic disc diameter measurements were performed using the public domain software Image J,

version 1.50i (National Institutes of Health, Bethesda, MD, USA). Two examiners (JS, JLW) measured

each image three times to assess the reproducibility of the technique.

Statistical analysis
Statistical analysis was performed using a commercially available statistical software program (SPSS

for Microsoft, version 24.0; IBM Corp., Armonk, NY, USA). First, we calculated the means and standard

deviations of the main outcome parameters. Next, we performed a multivariate analysis using the

angiographic parameters as the dependent variables; the parameters that were significantly

associated with the angiographic parameters following the univariate analysis were used as

independent variables. For all analyses p < 0.05 was considered statistically significant. We also

calculated the standardized regression coefficient beta, the unstandardized regression coefficient

beta, and its 95% confidence interval (CI).

Results
Demographics
The demographic characteristics of the participants are presented in Table 1.

Correlation between optic disc deformation and
macular perfusion parameters
VFD was measured at the SRP and DRP in the macular region. Each layer was divided into four

sectors: 1) the nasal, 2) temporal, 3) superior, and 4) inferior sectors. Results from the multivariate

regression analysis revealed that the nasal sector was negatively correlated with age (R = –2.12; p =

0.038); however, the FAZ was not correlated with age or any optic disc parameters in the current

study (Table 2).

Table 3 presents the correlations between optic disc deformation and DRP parameters. There was

also a negative correlation between the optic disc tilt and the DRP perfusion parameters in the whole

and inferior regions (R = –2.910; p = 0.025 and R = –0.3.667; p = 0.000, respectively). The perfusion

                                                    5
parameter in the inferior region was positively correlated with the disc area, and the horizontal optic
disc diameter was negatively correlated with superior retinal vessel density.
Correlation between optic disc deformation and
perfusion parameters
The results of the correlation between optic disc deformation and optic disc perfusion parameters are
presented in Table 4. The perfusion of the optic disc was divided into three layers, including the optic
disc head (ONH), radial peripapillary capillary (RPC), and choroid. The subfoveal choroidal thickness
was negatively correlated with age and β-PPA (R = 4.234; p = 0.000 and R = –2.161; p = 0.034,
respectively). Finally, the horizontal optic disc diameter was negatively correlated with subfoveal
choroidal thickness.
Discussion
Results from the present study demonstrated that there were strong correlations between optic disc
deformation and vascular parameters, including the vessel density of SRP, DRP and RPC. To our
knowledge, this was the first study that investigated the correlation between optic disc deformation
and retinal vasculature in non-pathological myopia.
A previous study reported that the decrease in macular VFD was associated with anatomical
parameters of the optic disc [6]. Another study [4] demonstrated that the superficial vasculature was
correlated with RNFL thickness. Therefore, we included high myopia patients who were not diagnosed
with other retinopathies (besides optic disc deformation) in order to investigate the correlation
between optic disc structure parameters and vasculature parameters.
Here, we demonstrated that the optic disc tilt ratio was correlated with the vessel density of the DRP.
Further, since disc tilt and torsion were significantly more frequent in the inferior direction, it is
possible that changes in optic disc morphology may be related to changes in inferior scleral thinning
[7]. Optic disc tilting in myopic eyes can lead to erroneous diagnoses of glaucoma and can also be a
risk factor for glaucoma. Since it is difficult to precisely measure the true horizontal diameter of the
optic disc, previous studies have evaluated the amount of tilt by calculating the ratio between the
minimum and maximum diameters of the nerve, a value that was termed the index of tilt [8].
6In our study, the superior vessel density of the DRP became lower as the horizontal disc diameter
extended. However, Yi Dai and associates [9] reported that β-PPA and γ-PPA were associated with
vertical disc diameter, and the associations between β-PPA or γ-PPA and horizontal disc diameter
were unclear and not significant. Conversely, Yin Guo et al [10] demonstrated that the horizontal and
vertical disc diameters were positively related to the enlargement of the parapapillary gamma zone
area [10]. Since there is an oblique angle in the transpupillary view the optic disc, this observation
may be influenced by the vertical tilting of the ONH in myopia.
In the current study, there were no significant relationships between RNFL and any other parameters;
however, the RNFL receives nutrients from the superficial vasculature. It is possible that during the
early phases of myopia, this change is not very evident, and the patients who were selected to
participate in the current study did not exhibit severe myopia.
Hua Fan and associates [11] demonstrated that there were no differences in vascular density in the
optic disc region among three groups, and vascular density in the optic disc region was not associated
with AL, spherical equivalent, or RNFL thickness. However, our study revealed that vessel density in
the RPC was negatively correlated with PPA and age.
Our study also demonstrated that FAZ was not correlated with optic disc deformations. Wang and
associates [12] did not identify any differences in the area and diameter of the FAZ. This finding may
indicate that the FAZ is not suitable to study changes in the microvessel network density of myopic
eyes. Notably, the FAZ area did not significantly change in response to hyperoxia. However, most of
the oxygen that is supplied to the retina from the FAZ area is derived from the choroidal vessel,
rather than from the retinal circulation, and this may explain the lack of changes in the FAZ area in
response to hyperoxia.
Garg and associates [13] reported that choroidal thinning was associated with β-PPA. In our study,
subfoveal choroidal thickness was thinner in eyes with higher than that in eyes with lower β-PPA.
Additionally, Wang and associates [12] found that the density of the macular vascular networks in
both layers and the choroicapillaries decreased with age. However, these relationships were the same
as ours except for the SRP.
7β-PPA is associated with myopic eyeball axial elongation and temporal pulling of the optic nerve. The
adjacent retinal tissue extends externally, and this mechanical stretching results in morphological
changes in vessel and tissue thickness. During β-PPA, the shape of vessels becomes straighter and
thinner, which may affect vessel flow in the macular region [14]. Furthermore, the changes in vessel
thickness may damage endothelial cells and subsequently reduce the concentration of vascular
endothelial growth factor [15, 16]. Chui and associates [17] revealed that retinal stretching may not
mirror scleral growth and that there is a difference between the photoreceptor margin and RPE
margin in some eyes suggesting that slippage may occur during eye growth within the retina. This
may result in retinoschisis and subsequently reduce perfusion in the macula.
There were several limitations of this study. First, this study was limited by its cross-sectional design;
therefore, additional studies that include frequent follow-ups of these patients are warranted. Second,
the participants in our study did not present with pathological myopia. Thus, further studies are
needed.
Conclusions
Overall, we observed a correlation between optic disc deformation and retinal vasculature in non-
pathological highly myopic eyes using OCTA. This relationship may explain the reduced peripapillary
and macular vessel density in high myopia. According to the results of the present study, disc
deformation may occur earlier than changes in the macular region in myopia retinopathy. Therefore,
changes in the optic disc may be early signs of retinal changes in myopic eyes.
Declarations
Ethics approval and consent to participate
This study was approved by the Beijing friendship hospital ethics committee. Written informed
consent was obtained from all examined patients and volunteer participants.
Consent for publication
Not applicable
Availability of data and materials
The datasets during and/or analyzed during the current study available from the corresponding author
8on reasonable request.
Competing interests
None
Funding
This work was supported by “The Capital Health Research and Development of Special (2018–1–
2021)“.
Authors’ contributions
All authors read and approved the final manuscript. YLW was involved in the acquisition and analysis
of the data. JLW in designing the study and revising the manuscript. JS designed the study, analyzed
the data and drafted the manuscript.
Acknowledgements
Not applicable
Abbreviations
β-PPA: β-zone parapapillary atrophy
AL: axial length
DRP: deep retinal plexus
FAZ: foveal avascular zone
ILM: inner limiting membrane
IOP: intraocular pressure
IPL: inner plexiform layer
OCTA: optical coherence tomography angiography
ONH: optic disc head
RNFL: retinal nerve fiber layer
RPC: radial peripapillary capillary
RPE: retinal pigment epitheliopathy
SRP: superficial retinal plexus
VFD: vessel flow density
9References
1.Sung MS, Heo H, Ji YS, Park SW. Predicting the risk of parafoveal scotoma in myopic normal tension
glaucoma: role of optic disc tilt and rotation. Eye (Lond). 2017;31:1051–9.
2.Seo S, Lee CE, Jeong JH, Park KH, Kim DM, Jeoung JW. Ganglion cell-inner plexiform layer and retinal
nerve fiber layer thickness according to myopia and optic disc area: a quantitative and three-
dimensional analysis. BMC Ophthalmol. 2017;17:22.
3.Li M, Yang Y, Jiang H, Gregori G, Roisman L, Zheng F, et al. Retinal microvascular network and
microcirculation assessments in high myopia. Am J Ophthalmol. 2017;174:56–67.
4.Wang X, Kong X, Jiang C, Li M, Yu J, Sun X. Is the peripapillary retinal perfusion related to myopia in
healthy eyes? A prospective comparative study. BMJ Open. 2016; doi:10.1136/bmjopen–2015–010791.
5.Sampson DM, Gong P, An D, Menghini M, Hansen A, Mackey DA, et al. Axial length variation impacts
on superficial retinal vessel density and foveal avascular zone area measurements using optical
coherence tomography angiography. Invest Ophthalmol Vis Sci. 2017;58:3065–72.
6.Triolo G, Rabiolo A, Shemonski ND, Fard A, Di Matteo F, Sacconi R, et al. Optical coherence
tomography angiography macular and peripapillary vessel perfusion density in healthy subjects,
glaucoma subjects, and glaucoma patients. Invset Ophthalmol Vis Sci. 2017;58:5713–22.
7.Ohno-Matsui K, Lai TY, Lai CC, Cheung CM. Updates of pathologic myopia. Prog Retin Eye Res.
2016;52:156–87.
8.Tay E, Seah SK, Chan SP, Lim AT, Chew SJ, Foster PJ, et al. Optic disk ovality as an index of tilt and
its relationship to myopia and perimetry. Am J Ophthalmol. 2005;139:247–52.
9.Dai Y, Jonas JB, Huang H, Wang M, Sun X. Microstructure of parapapillary atrophy: beta zone and
gamma zone. Invest Ophthalmol Vis Sci. 2013;54:2013–8.
10.Guo Y, Liu LJ, Tang P, Feng Y, Lv YY, Wu M, et al. Parapapillary gamma zone and progression of
myopia in school children: The Beijing Children Eye Study. Invest Ophthalmol Vis Sci. 2018;59:1609–
16.
11.Fan H, Chen HY, Ma HJ, Chang Z, Yin HQ, Ng DS, et al. Reduced macular vascular density in myopic
eyes. Chin Med J (Engl). 2017;130:445–51.
1012.Wang Q, Chan S, Yang JY, You B, Wang YX, Jonas JB, et al. Vascular density in retina and
choriocapillaris as measured by optical coherence tomography angiography. Am J Ophthalmol.
2016;168:95–109.
13.Garg A, Blumberg DM, Al-Aswad LA, Oll M, Yzer S, Forbes M, et al. Associations between β-
peripapillary atrophy and reticular pseudodrusen in early age-related macular degeneration. Invest
Ophthalmol Vis Sci. 2017;58:2810–5.
14.Lee KM, Choung HK, Kim M, Oh S, Kim SH. Positional change of optic nerve head vasculature
during axial elongation as evidence of lamina cribrosa shifting: Boramae Myopia Cohort Study Report
2. Ophthalmology. 2018;125:1224–33.
15.Zhang M, Hwang TS, Campbell JP, Bailey ST, Wilson DJ, Huang D, et al. Projection-resolved optical
coherence tomographic angiography. Biomed opt Express. 2016;7:816–28.
16.Landa G, Rosen RB. New patterns of retinal collateral circulation are exposed by a retinal
functional imager (RFI). Br J Ophthalmol. 2010;94:54–8.
17.Chui TY, Zhong Z, Burns SA. The relationship between peripapillary crescent and axial length:
Implications for differential eye growth. Vision Res. 2011;51:2132–8.
Tables
11Table 1 Demographic and ocular characteristics of the participants
Mean ± SD (n=77) Median (n=77) Range (n=77)
Age, y 35.24 ± 8.45 34.5 20–55
Sex(male/female) 35/47
SE, D 10.03 ± 3.57 8.94 6.15–20.13
AL, mm 27.43 ± 1.68 27.28 26.10–34.46
SP, mmHg 119.95 ± 11.90 122 91–149
DP, mmHg 74.67 ± 8.75 75 56–103
HR 76.11 ± 8.33 76 59–93
IOP, mmHg 15.62 ± 3.25 15.15 9.90–20.80
Optic tilt ratio 1.29 ± 0.18 1.26 0.91–1.76
Horizontal optic disc 1.33 ± 0.17 1.33 1.01–2.04
diameter, mm
Vertical optic disc 1.05 ± 0.19 1.05 0.67–1.57
diameter, mm
RNFL, μm 95.69 ±9 .49 95 72–117
C/D 0.28 ± 0.18 0.28 0.03–0.65
β-PPA, mm2 1.09 ± 0.62 0.88 0.19–2.85
Disc area, mm2 2.01 ± 0.59 1.93 0.94–4.38
Abbreviations: SE, spherical equivalent; D, diopters; IOP, intraocular pressure; AL, axial length; SP, systolic
pressure; DP, diastolic pressure; HR, heart rate; RNFL, retinal nerve fiber layer; C/D, cup-to-disc area ratio; β-PPA
β-peripapillary atrophy
12Table 2 correlation between optic disc deformation, SRP perfusion parameters and FAZ
Average Temporal Superior Nasal Inferior
r p r p r p r p r p
Age, y -1.27 0.207 -1.06 0.291 -0.7 0.485 -2.12 0.038 -1.67 0.099
Optic -0.36 0.723 -0.38 0.707 -0.43 0.668 0.336 0.738 -0.75 0.456
tilt ratio
Horizon 0.134 0.894 0.162 0.871 0.559 0.578 0.724 0.472 0.245 0.807
tal optic
disc
diamet
er, mm
Vertical 0.318 0.751 0.425 0.672 0.609 0.544 0.272 0.786 0.642 0.523
optic
disc
diamet
er, mm
Disc 1.138 0.259 1.082 0.283 0.902 0.37 0.769 0.444 1.428 0.157
area,
mm2
RNFL, -0.31 0.757 -0.86 0.393 -0.99 0.326 -0.76 0.451 0.352 0.726
μm
C/D 0.236 0.814 -0.13 0.9 1.091 0.279 0.078 0.938 -0.43 0.671
Abbreviations: SRP, superficial retinal plexus, RNFL, retinal nerve fiber layer; C/D, cup-to-disc area ratio; FAZ, foveal avascua
Table 3 correlation between optic disc deformation and DRP perfusion parameters
Average Tempo Superior
r p r p r
Age, y -2.429 0.017 -1.63 0.107 -0.695
Optic tilt ratio -2.291 0.025 -1.512 0.135 -0.229
Horizontal optic -1.065 0.29 -1.344 0.183 -1.995
disc diameter,
mm
Vertical optic disc -1.00 0.32 0.296 0.768 0.198
diameter, mm
Disc area, mm2 1.069 0.289 1.006 0.317 0.414
RNFL, μm 0.046 0.964 0.001 0.999 -0.468
C/D -0.125 0.901 -1.177 0.243 0.853
Abbreviations: RNFL, retinal nerve fiber layer; C/D, cup-to-disc area ratio
13Table 4 correlation between optic disc deformation, perfusion parameters and subfoveal choroidal thickness
RPC Subfoveal choroidal thickness ( μm)
r p r p
Age, y -1.656 0.102 -4.234 0.000
Optic tilt ratio -1.870 0.065 -1.797 0.076
Horizontal optic disc 0.139 0.890 -2.281 0.025
diameter, mm
Vertical optic disc 1.497 0.138 1.424 0.159
diameter, mm
Disc area, mm2 0.562 0.576 0.711 0.479
RNFL, μm 1.532 0.130 -0.529 0.598
C/D 0.302 0.764 0.104 0.917
β-PPA, mm2 -3.936 0.000 -2.161 0.034
Abbreviations: β-PPAβ-peripapillary atrophy; RNFL, retinal nerve fiber layer; C/D, cup-to-disc area ratio; RPC, radial
peripapillary capillary
Figures
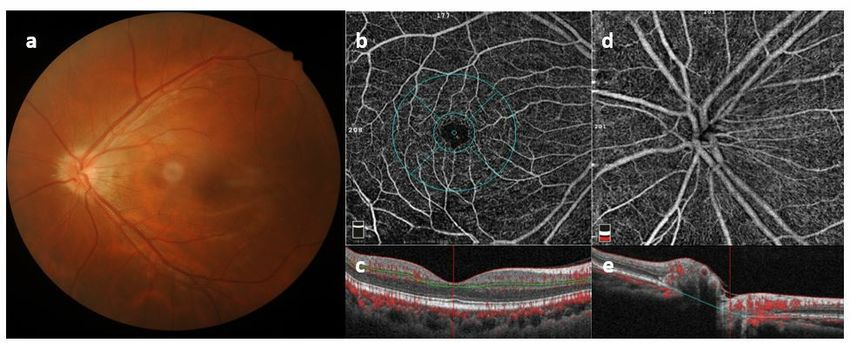
Figure 1
Images of high myopia in fundus color photographs (a) the foveal avascular zone and vessel
images of the retinal plexus; (b) images of the radial peripapillary capillaries, (d) cross-
sectional images of the fovea (c), and optic disc images (e) using optical coherence
tomography angiography.
14You can also read