COVID-19 Mortality Rate Trends in Countries and US States - Joel Elvery Mark Oleson
←
→
Page content transcription
If your browser does not render page correctly, please read the page content below
COVID-19 Mortality Rate Trends in
Countries and US States
Joel Elvery
Mark Oleson

Updated August 6, 2021
Introduction

•   The charts in this presentation use the same data sources as the charts in two April 2020 District
    Data Briefs. Please see these reports for additional details.
        •      Getting to Accuracy: Measuring COVID-19 by Mortality Rates and Percentage Changes
        •      A Speeding Rate Starts to Slow: COVID-19 Mortality Rates by State
•   Since those reports were completed, additional evidence shows that COVID-19 deaths have been
    underreported, both in other countries and in the United States. The following charts present the
    latest data from the Center for Systems Science and Engineering at Johns Hopkins University (CSSE)
    through July 31, with no attempt to further correct for underreporting.
         •   Some large revisions in COVID-19 data have been smoothed. See the appendix for details.
•   The designs of some charts have been modified from those in the reports to better convey the
    current status of the COVID-19 epidemic in the United States.
•   Hospitalization data come from the COVID Tracking Project at The Atlantic and the US Department of
    Health and Human Services (HHS). See the appendix for details.
•   Data by race come from the COVID Tracking Project at The Atlantic and the Centers for Disease
    Control and Prevention. See the appendix for details.

                                                                                                         2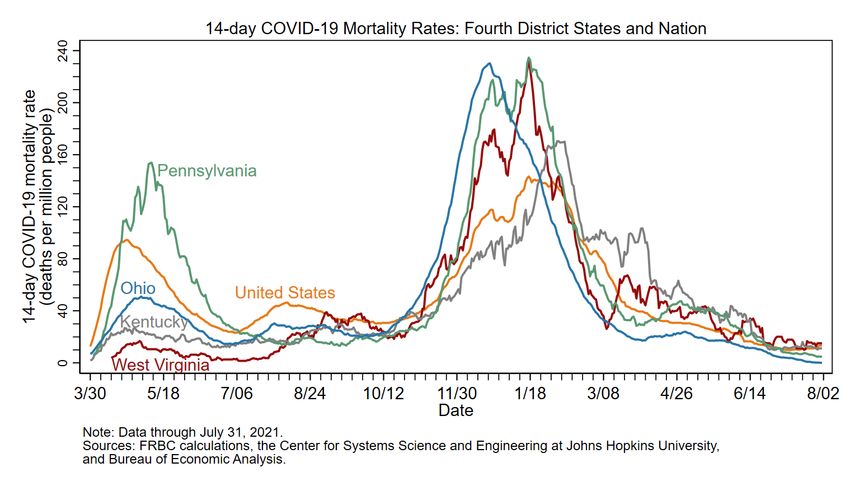
The nation’s COVID-19 mortality rate rose modestly in July.This mortality rate declined throughout July in
Ohio and Pennsylvania and was little changed over the month in Kentucky and West Virginia.

                                                         Note: On March 3, 2021, Ohio began reporting COVID-19 deaths from
                                                         death certificates only. While this makes the data less subject to revisions,
                                                         it also means that it may take longer to count a death.                     3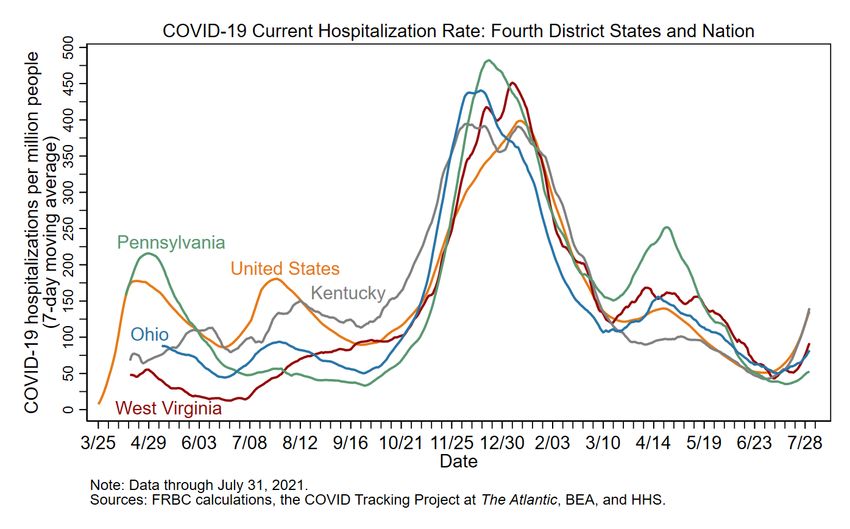
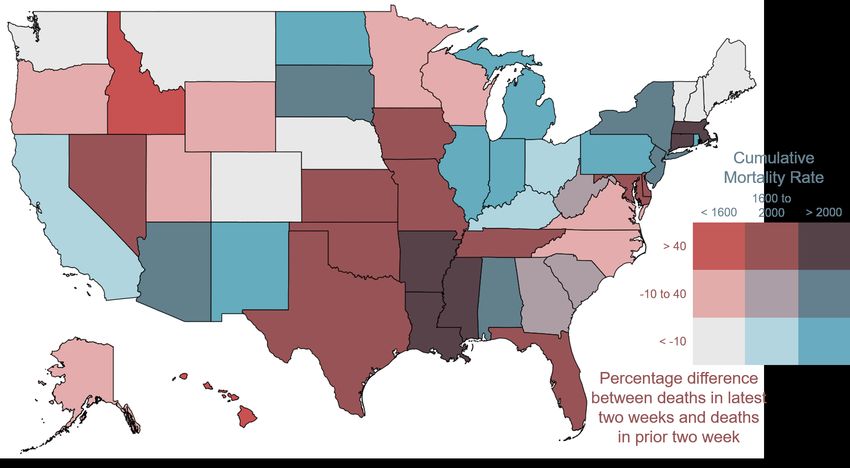
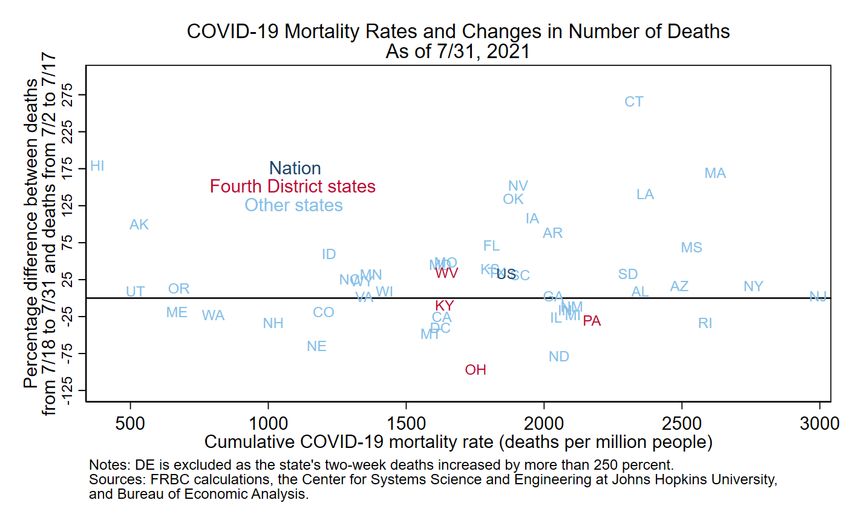
Between July 18 and July 31, the 14-day COVID-19 mortality rate rose in 32 states, including Florida,
Nevada, New York, and Texas.

                                                                                    Note: The District of Columbia is in the bin with the mortality rate from
Data for July 31, 2021, accessed on August 6, 2021.                                 1600 to 2000 and percentage difference < -10. The color bins on this map
“Latest two weeks” is 7/18/21 to 7/31/21; “prior two weeks” is 7/2/21 to 7/17/21.   are changed with each update to better represent the latest data.
Sources: FRBC calculations, CSSE, and BEA.                                                                                                                  4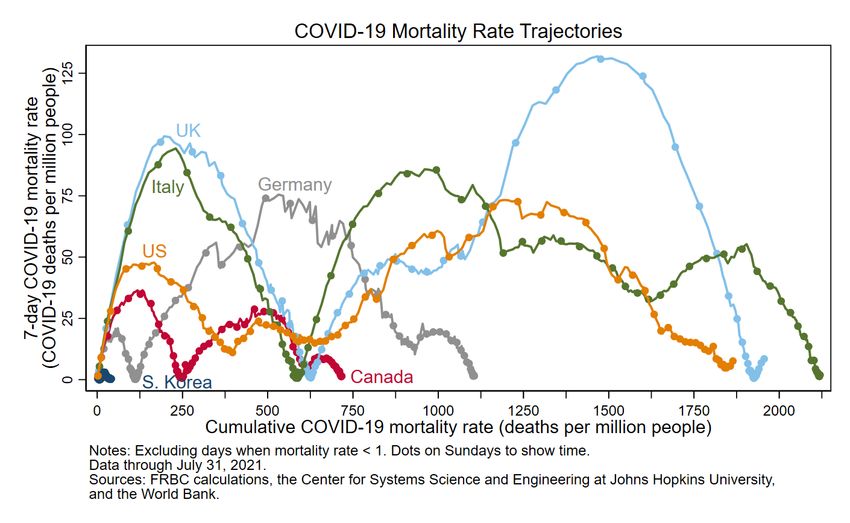
This chart gives similar information to the map, but it is more precise and includes the nation as a whole.

                                                                                                          5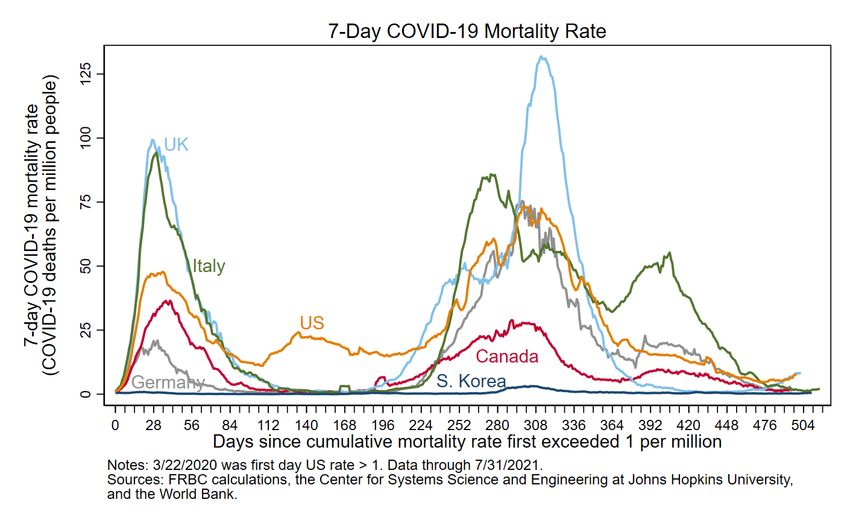
The cumulative COVID-19 mortality rates of Black residents and White residents are more similar in Kentucky, Ohio,
and Pennsylvania than in the nation as a whole. Hispanic mortality rates are lower in these states than in the nation.

                                                                                                                         6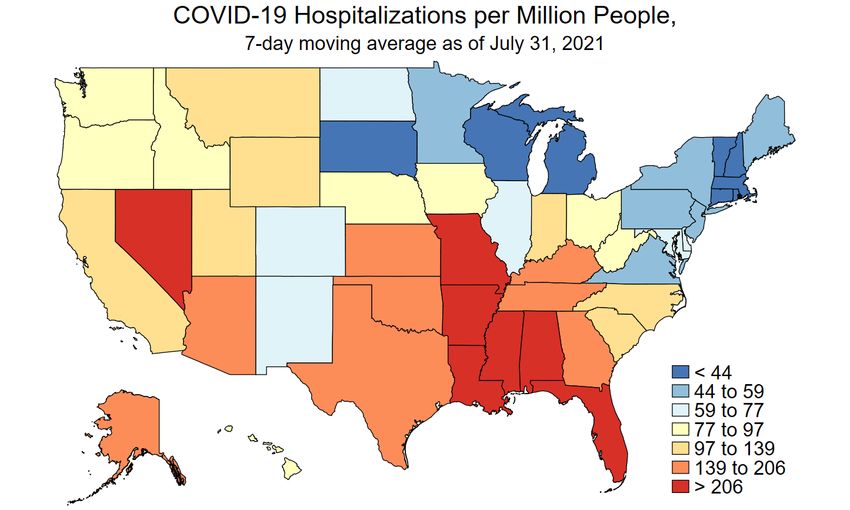
In Ohio, Pennsylvania, and the nation as a whole, the four-week mortality rates of Black residents declined
in July and have become more similar to those of White residents.

                                                                                                          7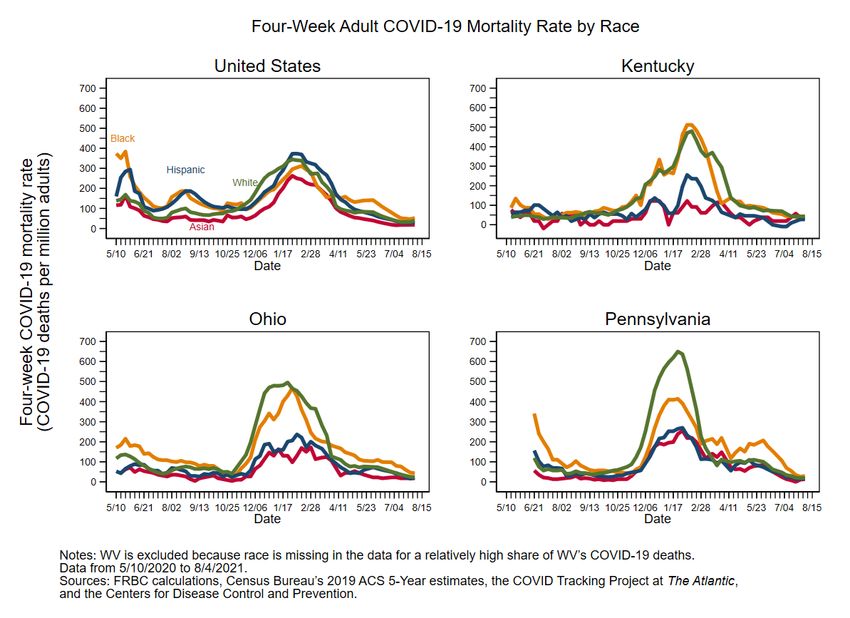
COVID-19 hospitalizations rose in the nation and all Fourth District states in July. Kentucky and the nation had
especially large increases, such that hospitalization rates have risen levels last seen in early March 2021.

                                                                                                                   8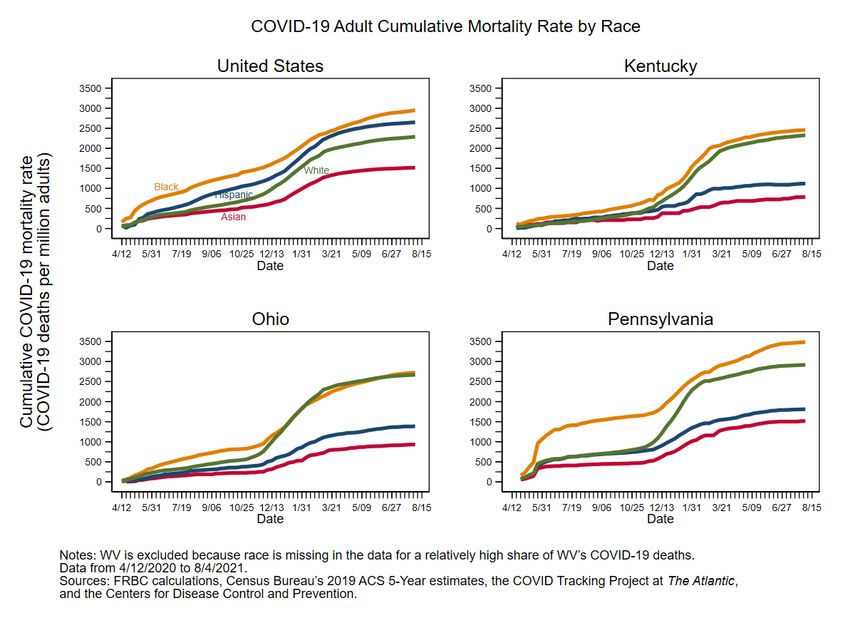
Between July 24 and July 31, the 7-day COVID-19 hospitalization rate rose in all but 2 states.
Hospitalization rates are especially high in Missouri, Nevada, and a number states in the South.

Data for July 31, 2021, accessed on August 6, 2021.                                Note: The District of Columbia is in the bin with a hospitalization rate < 44.
Sources: FRBC calculations, the COVID Tracking Project at The Atlantic, BEA, and   The color bins on this map are changed with each update to better represent
HHS.                                                                               the latest data.                                                               9
COVID-19 statistics for Fourth District states and the nation as of July 31, 2021.
                                                                                                                                            West             United
                        COVID-19 Statistic                                     Kentucky            Ohio           Pennsylvania             Virginia          States
Levels
     Average daily deaths in past 2 weeks                                                  4                0                       4              316               2
     Cumulative deaths                                                                 7,334           20,492                  27,850          612,975           2,946
     Average daily hospitalizations in the past week                                     627              959                     674           4,4611             164
Rates (per million residents)
     14-day mortality rate                                                                11                0                       5                13             15
     Cumulative mortality rate                                                         1,640            1,752                   2,174             1,863          1,648
     Average daily hospitalization rate in the past week                                 140               82                      53               136             92
Four-week adult mortality rate by race
     Asian                                                                                 38               18                      14                 --             19
      Black                                                                                36               43                      30                 0              53
      Hispanic                                                                             28               20                      17                 0              31
     White                                                                                 44               24                      19                34              39
Cumulative adult mortality rate by race
   Asian                                                                                 783              931                   1,516                 --         1,517
   Black                                                                               2,461            2,726                   3,483             1,969          2,947
   Hispanic                                                                            1,119            1,385                   1,811               521          2,649
   White                                                                               2,327            2,669                   2,916             2,148          2,289
Note: West Virginia’s data are missing race for a relatively high share of COVID-19 deaths, and the state does not report COVID-19 deaths for Asian residents.
Sources: FRBC calculations, CSSE at Johns Hopkins University, the COVID Tracking Project at The Atlantic, BEA, and the HHS.                                            10
After falling for 7 months in a row, the 7-day COVID mortality rate of the United States rose modestly in
July.The UK experienced a similar increase in July.
11As of July 31, the cumulative COVID-19 mortality rate of the United States is 1,863 deaths per million people.This
is more than double the mortality rate of Canada but below that of Italy and the UK.
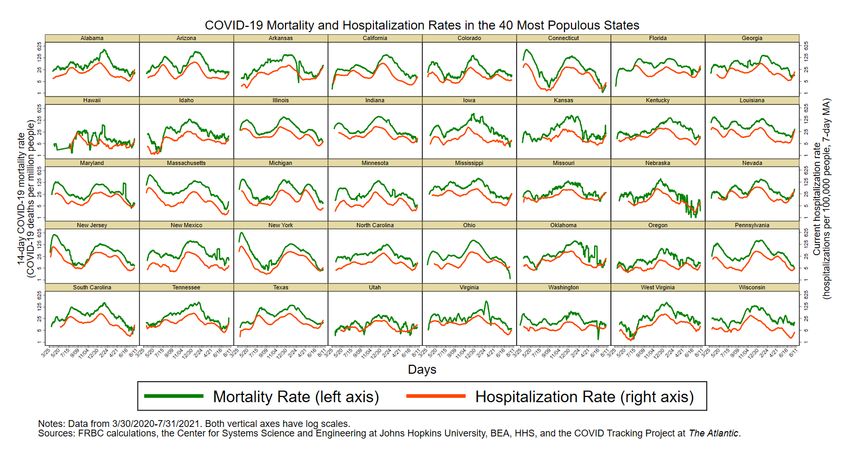
12This chart shows COVID-19 mortality and hospitalization rates for the 40 most populous US states.
13Appendix: Source details and adjustments for data revisions
• Series that use different sources at different times
Hospitalization data prior to February 1, 2021, are from the COVID Tracking Project at The
Atlantic. To smooth transition to a new source, the February 2021 data uses a weighted average of
the data from the COVID Tracking Project and data from HHS via HealthData.gov, with weight on
the COVID Tracking Project falling over time. From March 1, 2021, onward, we use the HHS data.
Data by racial groups are from the COVID Tracking Project through March 7, 2021, and from the
Centers for Disease Control and Prevention starting on March 8, 2021. The rates we report for
racial groups are per million adults, rather than population as a whole, because COVID mortality
is closely related to age and racial groups have different age distributions.
• Some significant revisions to the reported number of COVID-19 deaths cause
large single-day jumps.
• We smooth some of these jumps by multiplying daily changes for a period of time
by a scaling factor so that the adjusted series meets the post-revision series.
14Appendix: Source details and adjustments for data revisions (continued)
• We have used this approach for the following revisions and periods in 2020:
• Spain revised deaths downward on May 25; data are adjusted from 3/3 to 5/24.
• New Jersey revised deaths downward on June 25; data are adjusted from 3/10 to 6/24.
• Illinois revised deaths upward on July 7; Illinois and the United States are adjusted from 3/23 to 7/6.
• New Jersey revised deaths downward on August 26; data are adjusted from 3/18 to 8/25.
• US revised deaths up on October 21 for all race categories; data adjusted from 6/6 to 10/18.
• Other data cleaning in 2020
• Ohio’s reported cumulative deaths jumped up on August 29 and reversed on August 30. We set
Ohio’s cumulative deaths on August 29 to the midpoint of deaths on August 28 and 30 and
incorporated this change into the US total for August 29.
• Ohio’s reported cumulative deaths for Hispanic residents jumped up on August 5 and reversed on
August 9. We set Ohio’s cumulative deaths on August 5 to the average between August 2 and
August 9, given data are only available every Sunday and Wednesday.
15Appendix: Source details and adjustments for data revisions (continued)
• Data cleaning in 2021
• West Virginia’s reported cumulative deaths for Black residents fell on January 3 and January 6 and
reversed on January 10. We set West Virginia’s cumulative deaths on January 3 and January 6 to the
average between December 30 and January 10, excluding January 3 and January 6.
• On February 10, Ohio announced that it underreported COVID-19 deaths in November and
December and adjusted the data. The CSSE data is adjusted for this change, but the race-level data
from the COVID Tracking Project at The Atlantic is not. We smooth this jump in the race-level data
by multiplying daily changes from November to February 14 by a scaling factor so that the adjusted
series meets the post-revision series.
• Ohio continued to review and revise its COVID-19 deaths after February 14. We smoothed the
latest changes by assuming that deaths rose at a steady rate from February 17 to February 28.
• Virginia revised death counts in the week leading up to February 28, with the guidance that the
additional deaths occurred in 2021. Lacking information on when the deaths occurred, we revised
Virginia’s data so the state’s 14-day mortality rate has been constant since January 15.
• West Virginia revised death counts upward between February 7 and February 14 to account for
deaths between December 1, 2020 and January 30, 2021. We smoothed these changes using method
described on slide 14.
16Appendix: Source details and adjustments for data revisions (continued)
• Data cleaning in 2021 (continued)
• Death counts of Asian residents were revised on March 17 in Ohio, Pennsylvania, and the United
States. Also on March 17, the death counts of all racial groups in Kentucky were revised. We
adjusted these weekly series from November 11, 2020, through March 10, 2021, to account for
these revisions, using the rescaling methodology described on slide 14.
• Oklahoma revised death counts upward between April 6 and April 7 to account for deaths between
December 1, 2020, and March 31, 2021. We smoothed these changes using the rescaling
methodology described on slide 14.
• Texas pediatric hospitalizations published by HHS contained a 33,000 one-day jump on April 11. We
believe this is an error and replaced the one-day change with the average change over the prior 10
days. This jump was included in the national-level data by April 25, and we smoothed the jump
similarly.
• West Virginia revised death counts downward between April 26 and April 27 after an internal
review at the state’s health department. We smoothed these changes using the rescaling
methodology described on slide 14.
17You can also read