Teaching Statistics and Data Science Using Large Multivariate Data and Visualization Tools
←
→
Page content transcription
If your browser does not render page correctly, please read the page content below

Teaching Statistics and Data Science
 Using Large Multivariate Data and
        Visualization Tools
               Hollylynne S. Lee
              NC State University
                  January 26, 2018
    Teaching Contemporary Mathematics Conference
        NC School of Science and Mathematics
                                        Presentation partially supported by grants from
                                          Hewlett Foundation and NSF DUE 1625713..
                                        Opinions and findings are those of the presenter.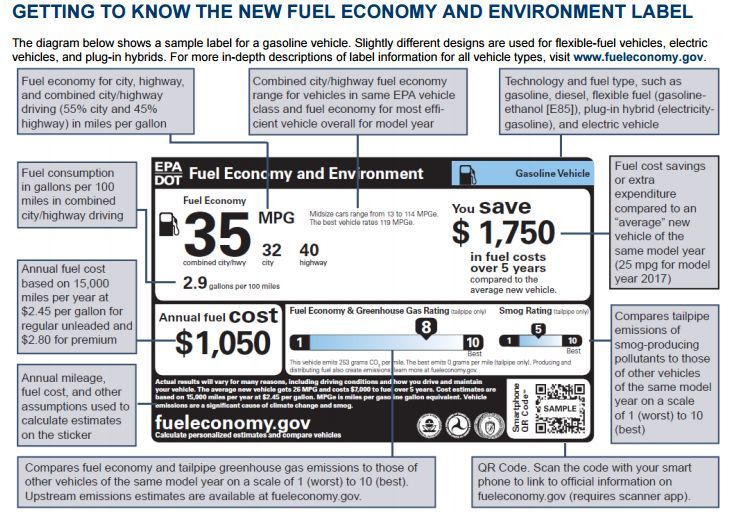
Statistics and Data Science Careers

Highly ranked careers in the past 5 years

Growth in demands expected to be over 30% through
2024

                                 http://thisisstatistics.org
t ion
                                  tr u c
                               ins
What is in our mathematics curriculum to
  prepare students for these careers?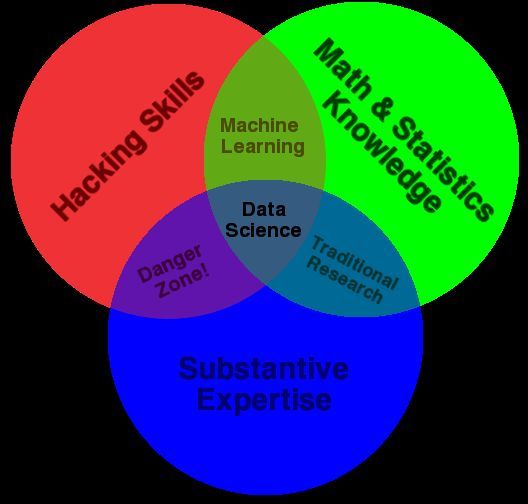
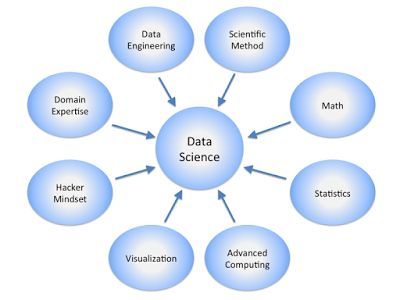
Data Science and Statistics
What is data science?

Drew Conway, 2013
http://drewconway.com/zia/2013/3/26/the-data-science-venn-diagram
David Taylor, 2016
http://www.prooffreader.com/2016/09/battle-of-data-science-venn-diagrams.html
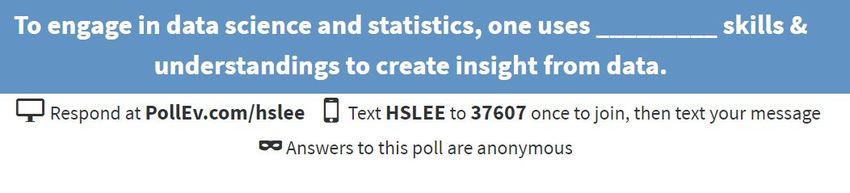
Statistical and Data Literacy should
             include knowing ...
• who collects data about us, why and how they collect it;
• how to analyze and interpret data from random and
  non-random samples;
• issues of data privacy and ownership;
• how to create representations of data to answer questions
  about real-life processes;
• the importance of the provenance of data and how it is stored;
• why data must sometimes be altered before analysis; and
• some aspects of predictive modeling.
                                                       Gould (2017)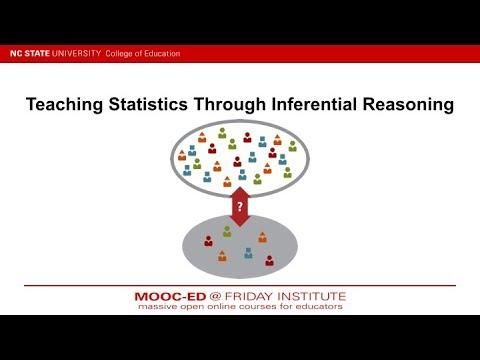
CODAP:
 Common Online Data Analysis Platform
https://codap.concord.org/
My Goal: Increase opportunities for
learning.....within existing curricula
              constraints
My Core Design Principles
for Data, Tools, and Tasks
• Data is real (collected by students or authenticated by teacher), multivariate
(categorical & quantitative), “large”, and sometimes messy
• Data contexts are engaging to students
• Tools facilitate data moves, in tabular and graphical form
• Tools support links among representations of data
• Tasks have multiple entry points for different levels of sophistication
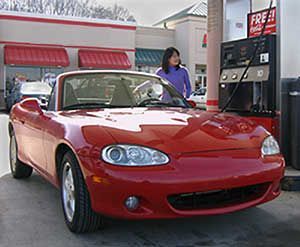
• Tasks provoke curiosity and promote different ways of engaging with dataSetting the context.... Ever worry about the cost of gas to support your commute to work and active lifestyle? Do you wonder how the automobile industry may have made vehicles more or less fuel efficient? Ever worry about how the automobile industry impacts our environment?
Investigating Fuel Economy of Vehicles
Look up a few cases!

http://www.fueleconomy.gov/feg/findacar.shtml
Going beyond a few cases....

If we looked at data for many vehicles, what could we learn
  about fuel economy in vehicles?
Let’s explore some data from 2015

What vehicle attributes may be of interest?
Attribute               Description
       Division        Company name
        Carline        Model name of the vehicle
     Vehicle_Type      Identifies the vehicle as car, SUV, van, minivan, or truck
  Eng_Displacement     A measure of volume (in liters) of the total volume of air in all the cylinders in an engine as air is swept through the
                       chambers in a complete cycle.

    No_Cylinders       Number of cylinders in an engine
     City_MPG          Estimated miles per gallon in city driving
     Hwy_MPG           Estimated miles per gallon in highway driving
     Comb_MPG          Estimated miles per gallon in a combination of city driving (55%) and highway driving (45%)
      Guzzler          Identifies whether the vehicle has exceptionally low fuel economy (Y, N)
    Transmission       Identifies vehicles as manual or automatic transmission
 Detail_Transmission   Detailed description of transmission type
      No_Gears         Number of transmission gears
     Drive_Desc        Drivetrain (2-wheel, 4-wheel, or all-wheel)
     Fuel_Usage        Type of fuel (premium, midgrade, regular, diesel)
  AnnualFuel_Cost      Estimated annual fuel cost assuming 15,000 miles per year (55% city and 45% highway) and average fuel price
       Hybrid          Identifies whether the vehicle has a hybrid engine (Y, N) such that it utilizes more than one form of onboard energy to
                       achieve propulsion. A hybrid will have a traditional engine and fuel tank, as well as one or more electric motors and
                       a battery pack
1226 vehicles from 2015 We could use all data Or We could use a random sample of the data Or We could use random samples from the data Or We could take random samples from the data
Different Data Formats
FIRST let’s look at a sample of 300 vehicles
             tinyurl.com/2015VehiclesSample
  _____________________________________________
   Option 1: Download CSV file and import into CODAP

     tinyurl.com/vehiclescsv       codap.concord.org
   Option 2: Data in CODAP with a Sampler designed
   .           tinyurl.com/sampler2015vehicles
Examining Relationships in Samples of Data and Building Inference Ideas
Discussion of Data Tools and Task

•   Data is real (collected by students or authenticated by teacher), multivariate
    (categorical & quantitative), “large”, and sometimes messy
•   Data contexts are engaging to students

•   Tools facilitate data moves, in tabular and graphical form
•   Tools support links among representations of data

•   Tasks have multiple entry points for different levels of sophistication
•   Tasks provoke curiosity and promote different ways of engaging with data
Ready to Learn More?
Join educators from around the world in two FREE online
professional development courses!
Teaching Statistics Through Data Investigations
Teaching Statistics Through Inferential Reasoning--starts
Feb 5th!
go.ncsu.edu/tsirContact Me! Hollylynne Lee Professor of Mathematics & Statistics Education Director of HI-RiSE hollylynne@ncsu.edu http://hirise.fi.ncsu.edu
You can also read