COVID-19 transmission across Washington State
←
→
Page content transcription
If your browser does not render page correctly, please read the page content below
COVID-19 transmission across
 Washington State

 Washington State Department of Health
 August 18, 2021

To request this document in another format, call 1-800-525-0127. Deaf or hard of hearing
customers, please call 711 (Washington Relay) or email civil.rights@doh.wa.gov.

Publication Number 820-114

For inquiries about this report from media, contact the Public Information Desk:
doh‐pio@doh. wa.gov

 0
SitRep 38: COVID-19 transmission across Washington State
Gitanjali Singh1, Ian Painter1, Juan M. Lavista Ferres2, Ruth Etzioni3, Barbra A. Richardson3,4, Cathy Wasserman1
1
 Washington State Department of Health; 2Microsoft AI For Health; 3Fred Hutch Cancer Center; 4University of Washington
Results as of August 17, 2021.
 The current Situation Report is based on complete data through August 6. The most recent 10 days are
 considered incomplete as it takes several days for the Washington State Department of Health to
 receive 90% of reported cases, hospitalizations and deaths. We continue to work on decreasing these
 time frames. Note that both statewide and county-specific trends since August 6 may have changed.
 To assess changes, you can review the most up to date picture of case, hospital admission, and death
 trends including incomplete data on the Epidemiology Curves tab of the WADoH COVID-19 data
 dashboard. Incomplete data will continue to populate in the coming days, so flattening or decreasing
 trends may or may not persist. Increasing trends in the incomplete data, though, will likely only grow.

Summary of current situation
Overview: Current model results based on data through August 6 indicate that COVID-19 transmission in
Washington state is increasing, with R-effective close to 1.5 as of July 30. Prevalence of COVID-19 has
increased sharply over this time period and has reached levels similar to those of the peak late
November to January.
Cases: Case counts are increasing sharply through early August statewide, and are increasing in the
majority of counties. Case rates are increasing in all age groups.
Hospital admissions: Hospital admissions have increased sharply through August 6, with further
increases evident in the incomplete data. These increases are among all adult age groups,. Overall
COVID-related hospital occupancy is increasing sharply through August 15, exceeding peak occupancy
last winter.
Variants: The B.1.617.2/delta variant maintains predominance.
Public health message: We are likely to see continued increasing cases and hospital admissions in the
coming month due to the delta variant. It is essential to continue vaccination to reduce transmission in
the long-term. Wear a mask in public indoor settings and crowded outdoor settings, regardless of
vaccination status, to prevent current transmission and reduce burdens on the health-care system.

 1
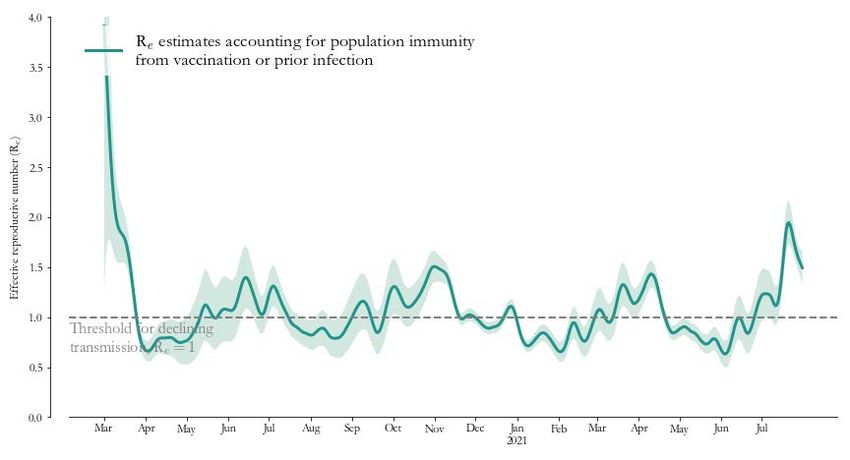
Statewide estimates of the effective reproductive number
Using data from the Washington Disease Reporting System (WDRS) through August 6, we are reporting
the effective reproductive number (Re) as of July 31. The green line and green-shaded region shows
estimates of total Re which includes contributions from behavior, variants, and population immunity,
either from prior infection or due to vaccination. On July 31, Rewas likely between 1.32 and 1.67, with a
best estimate of 1.49. Re increased sharply in early July, reflecting rapidly increasing transmission across
the state due to the delta variant. The drop in Re towards the end of July reflects a slight reduction in
the steepness of the rate of increase in hospital admissions, however, transmission is still increasing
exponentially. To reduce levels of cases and hospitalizations, total Re needs to maintain a value
substantially below 1 for a sustained period of time. Achieving this will require a combination of a high
level of vaccination and widespread adoption of behaviors that reduce transmission including wearing
masks in public indoor settings and crowded outdoor settings, regardless of vaccination status.

Figure 1: estimates for Washington state. The green line and green-shaded region depict the “total”
 , which accounts for behavior, variants, and population immunity.

 2

Model-based statewide prevalence
On August 6 , overall prevalence (the percentage of Washington state residents with active COVID-19
infection) in Washington state was likely between 0.38% and 0.98%, with a best estimate of 0.64%
(Figure 2). This translates to 1 in 156 WA residents currently estimated to have an active COVID-19
infection (symptomatic and asymptomatic). Prevalence has been increasing steadily since the beginning
of July, with particularly steep increases in mid-July through early August. As of August 6, prevalence
levels were on par with those seen in the peak of the third wave of infection in the winter of 2020.

Figure 2: Model-based prevalence estimates (bottom, 95% CI shaded) and model fit to cases (top left),
hospitalizations (top middle) and deaths (top right) for Washington state. Prevalence is the percentage of
Washington state residents with active COVID-19 infection.

 3

Model-based statewide immunity
On August 6, we estimate that overall population immunity to SARS-CoV-2 in Washington state was
between 53.9% and 55.5%, with a best estimate of 54.7%. (Figure 3). Immunity derived from vaccination
was around 39.2% (95% uncertainty interval: 38.1% to 40.3%), and immunity derived from prior infection
was around 15.5% (95% uncertainty interval: 13.8% to 17.1%). The increase in vaccine-derived immunity
and parallel increase in total immunity that began in February has slowed considerably starting in June.

Figure 3: Model-based estimates of population-level immunity to SARS-CoV-2 infection as of August 6.
Overall population immunity is indicated in the blue line and shaded area. The percent of the population
deriving immunity from vaccination at least 14 days prior is shown in purple, and the percent deriving
immunity from prior infection, is shown in orange. Note that these estimates assume that either prior
infection or vaccination give individuals long-term immunity against all SARS-CoV-2 variants, so waning
of immunity after infection is not accounted for.

 4

Trends in cases, hospital admissions, and deaths
Case counts have increased sharply since early July. The seven-day rolling average case count declined
from a peak of 2941 on January 8 to 744 cases per day as of February 15, remained at that level for a
month, increased to 1519 cases per day as of April 23, declined to 375 as of July 3 and increased to 2262
as of August 6 (a six-fold increase in cases between July 3 and August 6) .

Hospital admissions also started increasing in early July. The seven-day rolling average of hospital
admissions declined from a peak of 116 on January 6 to 31 as of March 6, flattened near that level until
late March, increased to a peak of 84 as of April 27, declined to a low of 29 as of June 16, and flattened
at around 30 through July 8, and increased to 96 as of Aug 6. Increases in hospitalizations continue in the
incomplete data subsequent to August 6.

Deaths have remained fairly flat, with some variability, since late March. The seven-day rolling average of
deaths declined from a peak of 32 on January 10 to 5 as of March 23, and has varied at between 5 and
10 deaths per day since then, and is currently at 6 as of July 30 (note that there is an earlier cut-off date
for deaths because of the additional time it takes for deaths to be verified and entered in the state vital
records database).

Figure 4: Seven-day rolling case counts (left panel), hospital admissions (middle panel) and deaths (right
panel) for Washington from July 2020 through August 8 (cases and hospitalizations) and July 30 (deaths)
2021. Because of how confirmed deaths are being reported, we are using an earlier cutoff for data on
daily mortality.

County-level trends
Case rates: Across Washington state as of August 6 (Figure 5a):
 ● 12 counties had 14-day rates of new cases between 100 and 200 per 100,000 people
 ● 16 counties had rates between 200 and 300 per 100,000 people.
 ● 5 counties (Pierce, Spokane, Pacific, Asotin, Lewis) had rates between 300-500 per 100,000.
 ● 4 counties (Walla Walla, Cowlitz, Benton, Franklin) had cases over 500 per 100,000.
 ● Case rates have increased sharply in most counties over the month of July (Figure 5b).
Case counts: County-level case counts indicate that the majority of counties (33/39) were experiencing
increasing counts as of August 6 (Figure 5a) :
 ● All of the five largest counties (Clark, King, Pierce, Snohomish, Spokane) show increasing counts
 as of August 6.
 ● All middle-sized counties (Benton, Franklin, Cowlitz, Grant, Kitsap, Skagit, Thurston, Whatcom
 and Yakima) are seeing increasing case counts through August 6.
 ● Among small counties, counts are increasing in Chelan, Clallam, Douglas, Island, Lewis, Stevens,
 Walla Walla. All other small counties have fewer than 10 cases per day, but increases are evident
 in Kittitas, Mason, Whitman, Adams, Asotin, Jefferson, Klickitat, Lincoln, Pacific, Pend Oreille,
 Columbia, and San Juan counties.

 5
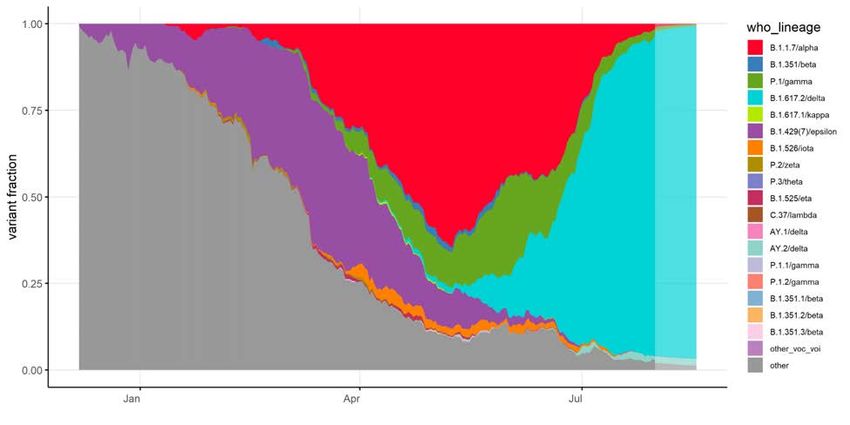
Figure 5a: Daily COVID-19 positives (shaded areas) and 7-day moving averages (curves) arranged geographically and colored by COVID-19
activity level (total cases from July 24 to August 6 per 100,000 people). Case trends across counties highlight geographic correlations and help us
better understand region-level estimates of the transmission rate (see Figure 1).

 6
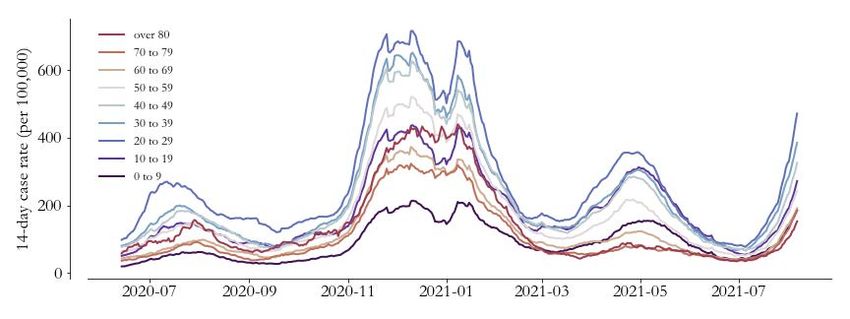
Figure 5b: 14-day COVID-19 case rates (cases per 100,000 people) by county over two time periods, the two-week period ending on July 8 (left),
and the two-week period ending on August 6 (right).

 7

Trends in case rates by age group
Across Washington state, 14-day case rates (cases per 14-day period per 100,000 people) have increased
sharply in all age groups from early July through August 6 (figure 6). The 0-9 and 10-19 age groups are
shown in a separate plot for improved visibility.

Figure 6. 14-day case rates by 10-year age group across Washington state, as of July 8, 2021. The upper
panel shows rates by 10-year age group for all ages 0-80+. The bottom panel shows the rates separately
for the 0-19 population.

 8
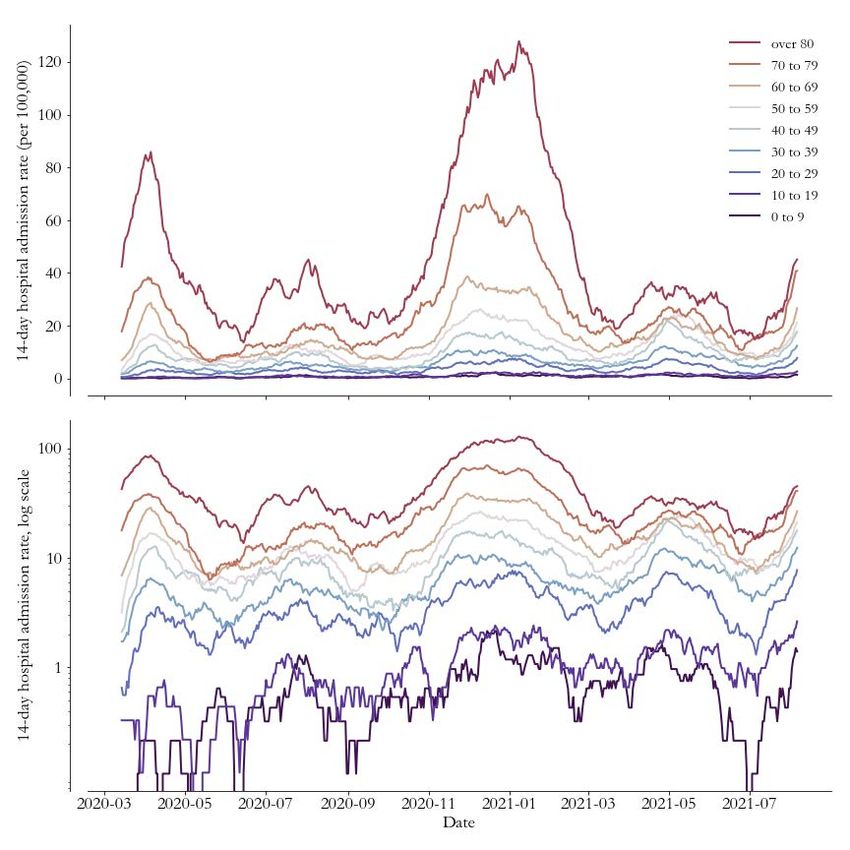
Proportion of cases and tests by age group
The top panel of Figure 7 indicates that a smaller proportion of adults aged 60 and older have tested
positive since mid-December, with further decrease after mid-February, in comparison to the proportion
of the population belonging to this age group. The 20-29 and 30-39 year old age groups now account for
a disproportionately large fraction of cases in comparison to the population fraction for this age group.
The bottom panel shows that overall testing by age has remained fairly proportional to the population
age distribution, though there have been increases in the proportion of 20-39 year olds getting tested in
August.

Figure 7. The top panel of this graph shows the weekly age distribution of COVID-19 cases and the
bottom panel shows the weekly age distribution of COVID-19 tests. The colors represent 10-year age
groups. Early in the pandemic, populations over age 60 represented a greater fraction of total COVID-19
cases relative to their fraction of the population as a whole. Over time, the age distribution of cases has
shifted towards younger individuals (shown in darker colors). In comparison, the bottom panel indicates
that this trend is generally not present in the distribution of tests, which indicates that the
age-distribution of the infected population is changing over time.

 9
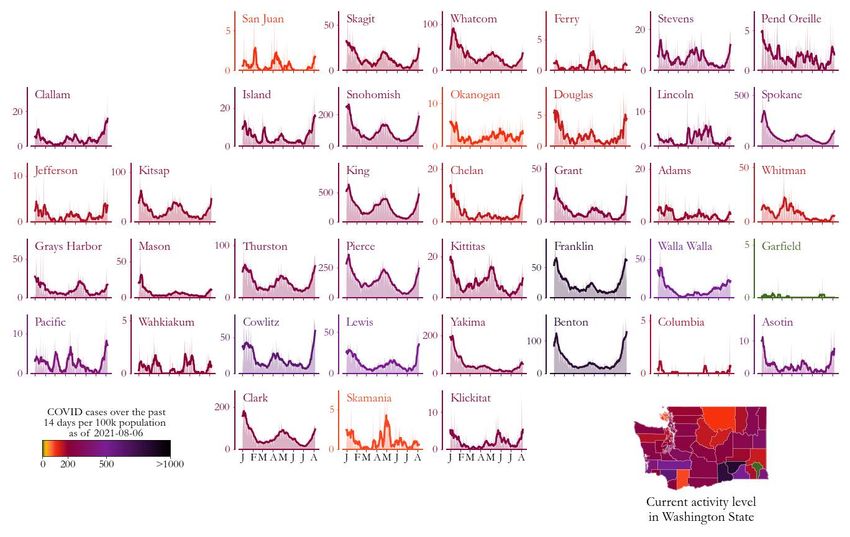
Trends in hospital admission rates by age group
Hospital admission rates (first hospital admissions per 14-day period per 100,000 population) across
Washington state began increasing in early July. As of August 6, increases in hospital admission rates are
evident in all age groups 20 and above (Figure 8). Admission rates for ages 0-19 remain low with large
variability, making trends difficult to interpret in this population.

The hospital admission data shown here are from WDRS and incorporate information from both case
investigation/contact tracing, as well as syndromic surveillance, and represent the most reliable source
of data on first hospital admissions for COVID-19, although data are less timely than the WA Health
system. More current data (not shown) from the WA Health system, which rely on daily reports by
hospital facilities around the state, show continued increases in hospital admissions in several adult age
groups, with some signs of flattening at high rates for ages 30-49, and 60+ as of August 15 .

Figure 8. Statewide 14-day hospital admission rate per 100,000 population by 10-year age group as of
August 6. The top panel shows the rates on a standard numeric scale, and the bottom panel shows the
rates on a log scale to be able to better compare the rate of decline between age groups that have large
differences in rates.

 10
Trends in hospital admission rates by age group and vaccination status
In order to assess the impact of vaccination on COVID-19 hospital admission rates among adults aged 45
and over, we compared two-week rates of first-time hospital admission between unvaccinated and
fully-vaccinated adults in three age groups, ages 16-44, 45-64 and 65+ (Figure 9). For the two week
period ending on July 31, the 14-day hospital admission rate in unvaccinated individuals aged 16-44 is
about 10 times higher than rates in those in this age group who are fully protected by vaccination (i.e.
those who are 14 days after 2nd dose of Pfizer or Moderna vaccines, or 14 days after a Johnson &
Johnson dose). The hospital admission rate in unvaccinated individuals 45-64 is also approximately 10
times that in fully protected individuals in this age group, and the hospital admission rate is
approximately six times higher in the unvaccinated 65+ population. Hospital admission rates overall, and
among the unvaccinated, have increased in all age groups, with particularly sharp increases among the
unvaccinated.

Figure 9. Comparison of 14-day hospital admission rates between unvaccinated and fully-vaccinated
adults age 16-44 (top panel), 45-64 (middle panel), and 65 and older (bottom panel). Colors represent
vaccination status, red = unvaccinated, green = those who are fully protected (14 days after 2nd dose or
30 days after J&J dose), dark blue = overall admission rate in this age group. Vaccination status of
individuals hospitalized for COVID-19 is determined by linking case data reported to WDRS with
vaccination data reporting the Washington State Information Immunization System. Estimates are
adjusted for vaccinations that get reported directly to CDC, missed linkages and population growth.

 11
Hospital occupancy
Across the state, the number of total hospital beds (Figure 10, top panel) and ICU beds (Figure 10,
bottom panel) occupied by confirmed or suspected COVID-19 patients increased sharply starting in mid-
July, with levels now exceeding those observed during the peak of the third wave of infection in winter
2020. COVID-19 occupancy levels from 8/5/2021 - 8/11/2021 have surpassed state goals (no more than
10% of staffed acute care beds and no more than 20% of staffed ICU beds occupied by COVID-19
patients) for adequate hospital readiness.

Figure 10. Total hospital beds and ICU beds occupied by confirmed or suspected COVID-19 patients
reported through the WA Health system. Data collection for ICU beds occupied by COVID-19 patients
started September 17. Hospital occupancy data has minimal reporting lag, and is shown here using data
up to August 15. Both confirmed and suspected cases are included, rather than just confirmed cases,
since this best reflects total resources being used. Note that bed occupancy will increase faster than
admissions since patients being treated for COVID-19 generally stay in the hospital for several days.

 12
Fraction of cases attributable to variants of concern
Using genetic sequence data from DOH as well as collaborating institutions on the GISAID platform, we
have estimated the fraction of cases in WA that are attributable to SARS-CoV-2 variants of concern and
variants of interest. Extrapolating from data available through July 31, and using a multinomial
generalized additive model, we estimate that as of August 16, less than 1% are due to P.1/gamma and
B.1.1.7/alpha, and about 98% are due to B.1.617.2/delta (Figure 11). Applying these estimates to the
total number of cases, including those not sequenced, reveals that the number of cases of
B.1.617.2/delta continues to increase exponentially. There is considerable uncertainty in these projected
estimates due to the use of a method that only approximates a representative sample. Despite
uncertainty in these estimates, they provide an informative picture of the evolution of SARS-CoV-2
variant strains in Washington state. A full report of whole genome sequencing of SARS-CoV-2 lineages
circulating in Washington state is produced weekly by DOH.

Figure 11. Estimated fraction of cases attributable to variants of concern in Washington State. Data used
in this analysis exclude sequences obtained by targeting B.1.1.7/alpha. This figure shows a seven-day
running average through July 31 (darker colors) and then a multinomial growth model nowcast through
August 16 (lighter colors). For the figure, variants of interest B.1.427 and B.1.429/epsilon have been
combined as they are closely related. To assist with public discussions of variants, WHO proposed using
labels consisting of the Greek alphabet, i.e. alpha, beta, gamma, as a practical way to discuss variants by
non-scientific audiences.

 13
Implications for public health practice
Across Washington state, SARS-CoV-2 transmission has increased exponentially over July and into early
August. This has resulted in sharp increases in prevalence over this time period, with current levels
exceeding peak prevalence in the winter of 2020. Hospital admissions have increased sharply through
July and into August, and increases are evident in the incomplete data subsequent to August 6. Increases
in beds occupied by confirmed or suspected covid patients have also increased sharply over the same
time period, exceeding peak levels in the winter of 2020.

The B.1.617.2/delta variant has become the predominant Variant of Concern (VOC) in Washington state,
with over 90% of cases attributable to this variant since mid-July. Current levels of population immunity
are not sufficiently high to overcome this increased transmissibility of B.1.617.2/delta, resulting in sharp
increases in cases and hospital admissions across the state, primarily among the unvaccinated.
Our analysis of hospital admission rates by vaccination status indicates that as of July 31, hospital
admission rates among the unvaccinated population 16-44 and 45-64 are 10 times as high as those in the
fully vaccinated population in those age groups, and in the 65+ population, hospital admission rates are
6 times as high in unvaccinated persons as in vaccinated persons. Hospital admission rates in the
unvaccinated far exceed peak hospital admission rates last December, and hospitalizations are increasing
in younger people. These data highlight the very strong protection against severe disease afforded by
vaccination, which in turn reduces burden on health systems--if the entire population were to
experience the rates of hospitalizations currently seen in the unvaccinated, the hospital system would be
completely overwhelmed.

High current Re estimates due to predominance of the delta variant are very concerning, reflecting sharp
increases in prevalence and hospital admissions through early August. Hospitals across the state are
functioning at very high occupancy due to sharp increases in COVID-19 cases, increased acuity of
admissions, and staffing shortages. Increased population vaccine uptake is critical to reducing
transmission in the mid and long-term. To reduce transmission and burdens on the health care system in
the short term it is critical to resume use of NPIs, particularly masking in public indoor settings and
crowded outdoor settings, regardless of vaccination status.

 14
Key inputs, assumptions, and limitations of the IDM modeling approach
We use a COVID-specific transmission model fit to testing and mortality data to estimate the effective
reproductive number over time. The key modeling assumption is that individuals can be grouped into
one of four disease states: susceptible, exposed (latent) but non-infectious, infectious, and recovered.

 ● For an in-depth description of our approach to estimating and its assumptions and
 limitations, see the most recent technical report on the modeling methods. The estimates this
 week and going forward use the updated method in that report, which results in some
 statistically-insignificant retrospective changes to relative to our previous report.
 ● In this situation report, we use data provided by Washington State Department of Health
 through the Washington Disease Reporting System (WDRS). We use the WDRS test, hospital
 admission, and death data compiled on August 16, and to hedge against delays in reporting,
 we analyze data as recent as August 6 across the state for cases and hospital admissions, and
 as recent as July 30 for deaths. This relatively conservative hedge against lags is in response to
 reports of increasing test delays.
 ● Estimates of describe average transmission rates across large regions, and our current work
 does not separate case clusters associated with known super-spreading events from diffuse
 community transmission.
 ● Results in this report come from data on testing, confirmed COVID-19 cases, and deaths (see
 previous WA State report for more details). Also as described previously, estimates of are
 based on an adjusted epi curve that accounts for changing test availability, test-positivity rates,
 and weekend effects, but all biases may not be accounted for.
 ● This report describes patterns of COVID transmission across Washington state, but it does not
 examine factors that may cause differences to occur. The relationships between specific causal
 factors and policies are topics of ongoing research and are not addressed herein.
 ● Our modelling framework has been updated to take vaccination data into account. Detailed
 methodological documentation is currently being prepared by the Institute for Disease
 Modeling. At a high level, based on observational data, our approach assumes that on average
 58.0% (95% CI: 52% to 64%) of those vaccinated after the first dose and an additional 24.4%
 after the second dose (for a total of 82.4% [95% CI: 77% to 87%) are protected from SARS-CoV-2
 infection 14 days after each dose. Among vaccinated people not protected from SARS-CoV-2
 infection, our modelling framework assumes roughly 20% to be protected from experiencing
 severe COVID-19 symptoms (i.e. hospitalization or death) while still able to transmit the virus.
 One critical limitation to note is the use of the same assumptions for all vaccines. Therefore, for
 this report, the single-shot Johnson & Johnson vaccine was considered equivalent to first-doses
 of the Pfizer or Moderna vaccines. This limitation is not expected to have a large influence on
 results since the Johnson and Johnson vaccines currently constitute a small proportion (less than
 4%) of the total vaccine doses administered to-date in Washington state.

 15
Collaboration notes
The Institute for Disease Modeling (IDM), Microsoft AI For Health, the University of Washington, and the
Fred Hutchinson Cancer Research Center are working with WA DoH to provide support for regional
modeling of case, testing, and mortality data across Washington State to infer effective reproduction
numbers, prevalence, and incidence from data in the Washington Disease Reporting System. Modeling
and analysis for the report are led by WA DoH and are based on models developed by IDM and advanced
by Microsoft to better represent the state. The WA DoH wishes to thank IDM for their support in model
development and implementation for this report, in particular, Dr. Niket Thakkar, PhD, and Dr. Mike
Famulare, PhD, of IDM, who developed and shared software and programming scripts and provided
technical and scientific advice to the WA DoH. This collaboration has evolved alongside the science, data
systems, and analysis behind the models, and it reflects the ongoing commitment of all parties involved
to improve our understanding of COVID-19 transmission and to support WA DoH in its public health
mission. This collaboration and its outputs will continue to evolve as scientific frontiers and policy needs
change over time.
These reports were previously published on the IDM InfoHub. Going forward, as of December, 9, 2020,
new reports will be published on the DOH website. IDM will continue to provide technical assistance for
the reports, as part of this collaboration.

 16
You can also read