CREDIT SUISSE 24TH ANNUAL FINANCIAL SERVICES FORUM - STEVE MCGARRY, EVP AND CFO FEBRUARY 14, 2023
←
→
Page content transcription
If your browser does not render page correctly, please read the page content below

Credit Suisse 24th Annual Financial Services
Forum
Steve McGarry, EVP and CFO

             February 14, 2023
Forward-Looking Statements and Disclaimer
Cautionary Note Regarding Forward-Looking Statements

The following information is current as of February 1, 2023 (unless otherwise noted) and should be read in connection with the press release of SLM Corporation (the “Company”) announcing its financial results for the
quarter and full year ended December 31, 2022, filed with the Securities and Exchange Commission (“SEC”) on February 1, 2023, and subsequent reports filed with the SEC.

This Presentation contains “forward-looking” statements and information based on management’s current expectations as of the date of this Presentation. Statements that are not historical facts, including statements
about the Company’s beliefs, opinions, or expectations and statements that assume or are dependent upon future events, are forward-looking statements. This includes, but is not limited to: statements regarding future
developments surrounding COVID-19 or any other pandemic, including, without limitation, statements regarding the potential impact of COVID-19 or any other pandemic on the Company’s business, results of
operations, financial condition, and/or cash flows; the Company’s expectation and ability to pay a quarterly cash dividend on its common stock in the future, subject to the determination by the Company’s Board of
Directors, and based on an evaluation of the Company’s earnings, financial condition and requirements, business conditions, capital allocation determinations, and other factors, risks, and uncertainties; the Company’s
2023 guidance; the Company’s three-year horizon outlook; the Company’s expectation and ability to execute loan sales and share repurchases; the Company’s projections regarding originations, net charge-offs, non-
interest expenses, earnings, balance sheet position, and other metrics; any estimates related to accounting standard changes; and any estimates related to the impact of credit administration practices changes, including
the results of simulations or other behavioral observations. Forward-looking statements are subject to risks, uncertainties, assumptions, and other factors that may cause actual results to be materially different from
those reflected in such forward-looking statements. These factors include, among others, the risks and uncertainties set forth in Item 1A. “Risk Factors” and elsewhere in the Company’s Annual Report on Form 10-K for
the year ended Dec. 31, 2021 (filed with the SEC on Feb. 24, 2022) and subsequent filings with the SEC; the societal, business, and legislative/regulatory impact of pandemics and other public heath crises; increases in
financing costs; limits on liquidity; increases in costs associated with compliance with laws and regulations; failure to comply with consumer protection, banking, and other laws; changes in accounting standards and the
impact of related changes in significant accounting estimates, including any regarding the measurement of the Company’s allowance for credit losses and the related provision expense; any adverse outcomes in any
significant litigation to which the Company or any subsidiary is a party; credit risk associated with the Company’s (or any subsidiary's) exposure to third parties, including counterparties to the Company’s (or any
subsidiary's) derivative transactions; and changes in the terms of education loans and the educational credit marketplace (including changes resulting from new laws and the implementation of existing laws). The
Company could also be affected by, among other things: changes in its funding costs and availability; reductions to its credit ratings; cybersecurity incidents, cyberattacks, and other failures or breaches of its operating
systems or infrastructure, including those of third-party vendors; damage to its reputation; risks associated with restructuring initiatives, including failures to successfully implement cost-cutting programs and the adverse
effects of such initiatives on the Company’s business; changes in the demand for educational financing or in financing preferences of lenders, educational institutions, students, and their families; changes in law and
regulations with respect to the student lending business and financial institutions generally; changes in banking rules and regulations, including increased capital requirements; increased competition from banks and
other consumer lenders; the creditworthiness of customers; changes in the general interest rate environment, including the rate relationships among relevant money-market instruments and those of earning assets
versus funding arrangements; rates of prepayments on the loans owned by the Company and its subsidiaries; changes in general economic conditions and the Company’s ability to successfully effectuate any acquisitions;
and other strategic initiatives. The preparation of the Company’s consolidated financial statements also requires management to make certain estimates and assumptions, including estimates and assumptions about
future events. These estimates or assumptions may prove to be incorrect. All forward-looking statements contained in this Presentation are qualified by these cautionary statements and are made only as of the date of
this Presentation. The Company does not undertake any obligation to update or revise these forward-looking statements to conform such statements to actual results or changes in its expectations.

The Company reports financial results on a GAAP basis and also provides certain non-GAAP “Core Earnings” performance measures. The difference between the Company’s non-GAAP “Core Earnings” and GAAP results
for the periods presented were the unrealized, mark-to-fair value gains/losses on derivative contracts (excluding current period accruals on the derivative instruments), net of tax. These are recognized in GAAP, but not
in non-GAAP “Core Earnings” results. The Company provides non-GAAP “Core Earnings” because it is one of several measures management uses when making management decisions regarding the Company’s
performance and the allocation of corporate resources. The Company’s non-GAAP “Core Earnings” is not a defined term within GAAP and may not be comparable to similarly titled measures reported by other
companies.

For additional information, see the “Non-GAAP ’Core Earnings’ to GAAP Reconciliation” table in this Presentation for a complete reconciliation between GAAP net income and non-GAAP “Core Earnings”.

                                                                                                                                                                                                                                   2
Sallie Mae is an Outstanding Franchise
Sallie Mae is the market-leading brand for private education loans driven by brand
recognition, rigorous underwriting methodology and industry-leading customer
service.

     Top ranked and highly recognized brand                        2,100+
                                                                   actively managed university relationships
                                                                   across the U.S.
     Industry leading and award-winning
     technologies
                                                                   Largest salesforce in the industry

     Well funded with sufficient liquidity, capital,
     and loan loss reserves                                        Appears on   96% of preferred lender lists

 57%                25%              5-6%                  86%                  747                        2.55%
 Market share of    Return on        Annual Private        Annual Cosigner      Average                    Annual Net Charge-
 private            Common           Education Loan        Rate                                            offs
                                                                                FICO at
 education loan     Equity           Originations Growth                        Approval
 originations1                       projected in 20233

                                                                                  * Full year 2022 Metrics, unless otherwise noted.

                                                                                                                                      3
Revenue
Q4 and Full   •   GAAP Net Loss attributable to common stock of $81 million in Q4 2022 driven by reserve build and
Year 2022         mark-down of non-marketable equity security, compared to Net Income attributable to common
Highlights        stock of $305 million in Q4 2021.
              •   Full-year 2022 GAAP Net Income attributable to common stock of $460 million vs. $1.16 billion in
                  2021.
              •   Q4 2022 GAAP loss per common share of ($0.33) vs. diluted earnings of $1.04 in Q4 2021. Full-year
                  2022 GAAP diluted earnings per common share was $1.76, which is a 51% decrease from the $3.61 in
                  2021.
              •   Net Interest Margin for full-year 2022 increased 50 basis points, from 4.81% in 2021 to 5.31% in 2022.

              Total Operating Expenses
              •   Total operating expenses of $138 million in Q4 2022, which is 10% higher than the year ago quarter.
              •   Total operating expenses for full-year 2022 were $551 million, which is 6% higher than full-year 2021.

              Credit Performance
              •   Full-year 2022 net charge-offs for Private Education loans totaled $386 million.
              •   While we have seen improving performance in many of the transient factors discussed previously, we
                  expect some of these impacts to persist into 2023 and 2024.

                                                                                                                           4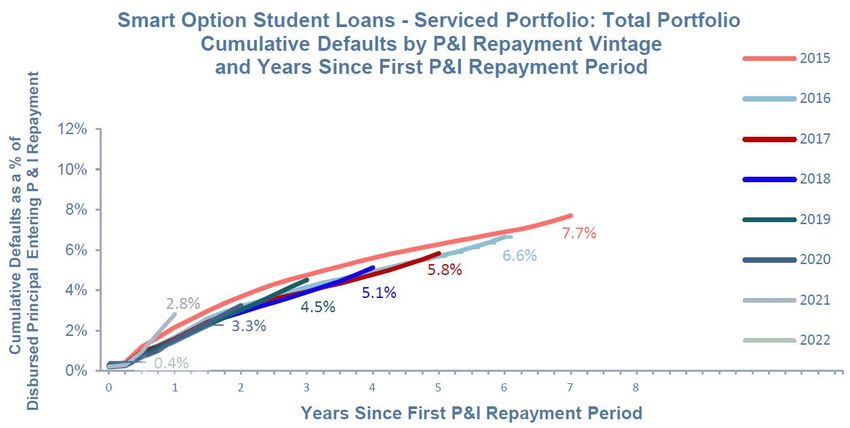
Strong                                                Private Education Loan Originations13
Origination
Season

Full-year 2022 originations                                                                                                          $5,975
at approximately $6 billion,                                     $6,000                 $5,625                                 10%
                                                                                   6%            (5%)                 $5,423
10% higher than the year-                                                 $5,315                        $5,321   2%                               Actual
ago period and the highest                                       $5,000
over the previous 5-year
period.
                                                                 $4,000

                                                 $ in millions
Underclassmen originations,
typically with a higher                                          $3,000
lifetime value to the
company, experienced a                                           $2,000
15% increase from 2021.

                                                                 $1,000

                                                                     $0

                                                                          2018           2019            2020          2021           2022    Q4 2022   Q4 2021
                               % Cosigned                                 87%            87%             86%           86%            86%      82%       83%
                               % In School Payment                        57%            58%             60%           59%            57%      58%       59%
                               Average FICO at Approval1 06                746            746             749           750            747     747       749

                                                                                                                                                                  5
Capital
Allocation
Capital Return
& Return
• Paid common stock dividend of $0.11 per share in Q4 2022.
• Sallie Mae Bank remains well capitalized with 14.2% Total risk-based capital ratio and CET1
ratio of 12.9%.
• In the fourth quarter of 2022, we continued our capital return strategy by repurchasing 10
million shares at an average price of $16.25 per share.
• During full-year 2022, 40 million shares were repurchased, which is a 14% decrease in shares
outstanding since the beginning of 2022.
• $581 million of capacity remaining under our 2022 Share Repurchase Program authorization
at Jan. 31, 2023 (which expires in Jan. 2024).
Over the Last 2 Years, Sallie Mae Has
Pursued a Simple Yet Powerful Strategy
6Higher Education Value Proposition Remains Attractive4
Expanding Addressable Market
• Private Education Loans represent 2-3% of the overall spend in higher
education annually.
Private
Federal Loans • Total spend on higher education grows ~2% annually, while Sallie Mae
Education Loans
Other $79B Private Education Loans growth expanded from 4% - 10% from 2021 to
$11B
$12B 2022, increasing private education loan market share by 200bps.
Strong Strategic Execution
• Over the past 8 years, the 25–29-year-old population with a Bachelors
Grants Total Degree or higher has increased an average of 0.6% per year.15
$140B
$483B Family • 55% of students graduated with student loans in AY 2020-202114
Contribution
• Of the 55% of bachelor's degree recipients that graduated with student
$241B
loans, the average debt amount was $29,400. 14
Higher Education is Valuable
Higher Education Spend • The median income of recent college graduates was $52,000 in 2021, 73%
(Academic Year 2021-2022) higher than the median income of people with high school diploma only.16
7Customer FICO at Original Approval6 Smart Option Payment Type
Conservative Funding Optimizes Net
Interest Margin

                                  Secured
                                   Debt                  Retail
                                   20%                 MMDA & CD
                                                           23%

                       Brokered
                                        Deposits $21.4B
                       Variable
                                      Secured Debt $4.2B     Retail
                         15%                                 H.S.A.
                                                             & 529
                                                             17%

                                         Brokered
                                           Fixed
                                            25%

As of 12/31/22
                                                                      9
We Underwrite to a Strong ROE
Origination Cohort * Default Assumptions and Expected ROE
20 18 20 19 20 20 20 21 20 22
At Origination Projected Cumulative Defaults 9 .4% 9 .7% 10 .2% 10 .5% 10 .5%
At Origination Expected ROE Low 20 % High Teens Low 20 % Mid 20 % Low 20 %
Life to Date Default Rate** 3.4 % 2.4 % 1.4% 0 .5% 0 .0%
*Origination Cohorts enter P&I at different times.
**As of 12/31/2022
• Default rate spike in 2022 was driven by credit administration practices changes, the pandemic
withdraw population and collection staffing issues. Staffing issues are being addressed, and we
believe withdraw population has largely run its course
• At origination cumulative default expectations are expected to be met despite recent credit
performance
• January 2023 collections performance sharply improved from December 2022. Entry to
delinquency rate in January 2023 was the lowest in nine months, and the roll to default rate the
lowest in a year
• Trust Reports reflecting January 2023 activity show periodic default rate declines from December
2022 in 19 out of 25 trusts
10P&I Cohorts Exhibit Similar Trends
Cumulative Gross Defaults
• Based on regularly published P&I Cohort data, we believe the portfolio is tracking to expected Cumulative Defaults
*Data as of 12/31/2022. Please see page 21 for a description of the data and calculations underlying this chart.
Confidential and proprietary information. © 2022 Sallie Mae Bank. All rights reserved. 11Simple But Powerful Investment Thesis
• Consistent earnings expansion is driven by top line growth and efficiency
Attractive
Earnings Profile • Sallie Mae is the leader in the private education loan market
• Well-proven and disciplined underwriting model leveraging data and experience through
Manageable Risk the last recession
• Despite headlines on student lending and federal student loan performance, we are well
equipped to manage the perceived political risk to our business
Disciplined Capital • Core loan product generates very attractive ROEs
Allocation • Utilizing a hybrid hold/sell model to create capital that can be used to buy back
undervalued stock
12Clear Strategy to Prove this Investment Thesis
Strategic Imperatives:
1. 2. 3. 4.
Maximize the Maximize the Better inform the Maintain a
profitability and value of our external narrative rigorous and
growth of our brand and about private predictable capital
core business attractive student lending allocation and
customer base and Sallie Mae return program to
create shareholder
value
13Maximize the Profitability and Growth
of the Core Business
Maximize Revenue Manage Unit Costs
Drive penetration at all schools Strong fixed cost discipline
Increase market share by fully meeting Drive towards reducing both the unit cost of
student funding needs servicing and the unit cost of acquisitions
Enhanced risk-adjusted pricing and Improved third-party vendor
underwriting cost management
Improved marketing, digital, and data
capabilities
14Optimize the Value of the Brand and Attractive Client
Base
2M 91% We know our customers’ finances, payment
Borrowers and Customers complete their patterns and indebtedness
cosigners program5
We have the relationships and knowledge to
assist our customers with their next step:
Graduates who benefit from the investment5
post-graduation plans, jobs, future financial
$52,600 31% ~698 needs
Average annual Own a Self-reported We are there for our customers during and
compensation home FICO score
after their important transition to adulthood
What We Do
Build products and Ensure products and Prioritize partnerships Look for opportunities
services that leverage services are consistent and other capital to optimize ROI
our customer affiliation with our core mission efficient avenues of
and drive customer value growth
15Maintain Rigorous Capital Allocation and
Return Program
Invest in High ROE Growth Share Repurchase
• Continue to focus on high-quality Private • Since January 1, 2020, we have repurchased 44% of
Education Loan originations, including common shares outstanding at that time.
deeper penetration of graduate school
market • During 2022, 40 million common shares were
repurchased, which is a 14% decrease in shares
• Build other sources of revenue and capital outstanding since the beginning of 2022.
in expense-efficient ways
• $581 million of capacity remaining under our 2022 Share
Embracing a Hybrid Repurchase Program authorization at Jan. 31, 2023
(which expires in Jan. 2024).
Hold / Sell Loan Model3
• Expect to sell assets to optimize growth in Quarterly Common Stock Dividend
required capital
• Paid $0.11 quarterly common stock dividend in Q4 2022
• The expected result is a balance sheet
that will remain relatively flat despite loan • Expect to continue to pay dividend, subject to Board
sales approval3,18
• $3B in Private Education Loan sales
completed in 2022, which enabled
additional return of excess capital to
shareholders
16Sallie Mae is an ESG Company
Providing Financial Education
Serving our Customers & Assistance
• Helped more than 1.8 million students and families finance higher education • Free Scholarship Search tool listing 6 million scholarships worth more than
since 2014 $30 billion
• Policies help to ensure that 9 in 10 of our loans in repayment are being paid • Committing $4.5 million over 3 years to promote diversity in higher education
back on time and less than 3% defaulted in 2022 and advance social justice
• In 2022, provided $1.8 million in scholarships and charitable giving
• Developed and promoted relief options – including postponing payments –
for those customers impacted by COVID-19
Building Strong Communities
Committed to an Ethical &
Diverse Workplace
• Since 2014, The Sallie Mae Fund has contributed more than $6.6 million to
address barriers to higher education and support our communities
• Board of Directors composition is 1/3 women, has been recognized by 50/50
Women On Boards as a company with a 3+ Board rating • In 2022, our team members more than doubled their volunteer time in 2021,
delivering more than 1,900 hours of service and donated more than $69,000
• Appointed the first woman to serve as chair of Board of Directors in 2020 through the company’s Mae-A-Difference 365 volunteer and matching gift
• Committed to best-in-class governance practices program
• Employee population: 57% female; 45% self-identify as a minority • Sallie Mae Bank made nearly $71 million in new investments to support low-
and -moderate income housing and affordable housing projects in Utah in
• A+ rating from the Better Business Bureau each year since 2015 2022
• The Sallie Mae Fund, in partnership with Thurgood Marshall College Fund,
awarded 600 scholarships since the beginning of 2021 – collectively totaling
$1.9 million – to help minority and other marginalized students access and
complete their post-secondary education, and help pay for graduate school
17Quarterly Financial Highlights
Q4 Q3 Q4 Q4 Q3 Q4
2022 2022 2021 2022 2022 2021
Income Statement ($ Millions) Key Performance Metrics
Total interest income $584 $520 $458 Net Interest Margin 5.37% 5.27% 5.13%
Total interest expense 202 150 91
Yield—Total Interest-earning assets 8.21% 7.42% 6.40%
Net Interest Income 381 370 367
Less: provisions for credit losses 297 208 (15) Private Education Loans 10.12% 9.43% 8.31%
Total non-interest income (loss) (41) 95 153
Credit Cards 7.54% 4.77% 4.12%
Total non-interest expenses 140 152 125
Cost of Funds 3.00% 2.27% 1.36%
Income tax expense (benefit) (19) 30 104
Net Income (Loss) (77) 75 306 Return on Assets (“ROA”)(8) (1.1%) 1.0% 4.2%
Preferred stock dividends 3 2 1
Non-GAAP “Core Earnings” ROA(9) (1.1%) 1.0% 4.2%
Net income (loss) attributable to common stock (81) 73 305
Non-GAAP “Core Earnings” adjustments to Return on Common Equity (“ROCE”)(10) (18.8%) 16.7% 62.3%
- - 1
GAAP(7)
Non-GAAP “Core Earnings” ROCE(11) (18.8%) 16.7% 62.6%
Non-GAAP “Core Earnings” net income (loss)
(81) 73 306
attributable to common stock(7) Per Common Share
Ending Balances ($ Millions)
GAAP diluted earnings (loss) per common share ($0.33) $0.29 $1.04
Private Education Loans held for investment, net $19,020 $18,981 $19,625
Non-GAAP “Core Earnings” diluted earnings (loss)
($0.33) $0.29 $1.05
FFELP Loans held for investment, net 607 641 693 per common share(7)
Credit Cards held for investment, net - - 23 Average common and common equivalent shares
245 254 293
outstanding (millions)
Deposits $21,448 $21,277 $20,828
Brokered 9,877 10,232 10,123
Retail and other 11,571 11,045 10,705
18Annual Financial Highlights
2022 2021 2022 2021
Income Statement ($ Millions) Key Performance Metrics
Total interest income $2,032 $1,777 Net Interest Margin 5.31% 4.81%
Total interest expense 543 382
Yield—Total Interest-earning assets 7.24% 6.13%
Net Interest Income 1,489 1,395
Less: provisions for credit losses 633 (33) Private Education Loans 9.14% 8.25%
Total non-interest income 335 632
Credit Cards 5.10% 4.67%
Total non-interest expenses 559 520
Income tax expense 162 380 Cost of Funds 2.05% 1.42%
Net Income 469 1,161
Return on Assets (“ROA”)(8) 1.6% 3.9%
Preferred stock dividends 9 5
Net income attributable to common stock 460 1,156 Non-GAAP “Core Earnings” ROA(9) 1.6% 4.0%
Non-GAAP “Core Earnings” adjustments to GAAP(7) - 18
Return on Common Equity (“ROCE”)(10) 25.4% 53.9%
Non-GAAP “Core Earnings” net income attributable to
460 1,173
common stock(7) Non-GAAP “Core Earnings” ROCE(11) 25.4% 54.7%
Ending Balances ($ Millions)
Per Common Share
Private Education Loans held for investment, net $19,020 $19,625
GAAP diluted earnings per common share $1.76 $3.61
FFELP Loans held for investment, net 607 693
Non-GAAP “Core Earnings” diluted earnings per common
Credit Cards held for investment, net - 23 $1.76 $3.67
share(7)
Deposits $21,448 $20,828
Average common and common equivalent shares
262 320
Brokered 9,877 10,123 outstanding (millions)
Retail and other 11,571 10,705
19Non-GAAP “Core Earnings” to GAAP Reconciliation
(7)
(12)
20Smart Option Loan Program Cohort Default Triangles
Terms and calculations used in the cohort default triangles are defined below:
First P&I Repayment Period – The first month during which a borrower is required to make a full principal and interest payment on a loan. This date is static. Once a loan enters P&I repayment,
the date is locked in and does not change. This refinement to the methodology was made in 2021 Q2.
P&I Repayment Vintage – The calendar year of a loan’s First P&I Repayment Period.
Disbursed Principal Entering P&I Repayment – The total amount of disbursed loan principal in a P&I Repayment Vintage, excluding any interest capitalization.
Reported Default Data –
o For loans that default after their First P&I Repayment Period: Loans enter a particular annual P&I Repayment Vintage at different times during the P&I Repayment Vintage year. Default
data is not reported for loans in a particular annual P&I Repayment Vintage until the First P&I Repayment Period has occurred for all loans in that annual P&I Repayment Vintage. Once
reporting starts, data reflects defaults that occurred in a particular period through the number of months since December 31 of that annual P&I Repayment Vintage year. For example, in
the relevant charts and tables included in this presentation as of December 31, 2022: (i) default data reported for loans in the 2021 P&I Repayment Vintage represents defaults occurring
during the first 12 months after a loan’s First P&I Repayment Period regardless of the month in 2021 during which the first full principal and interest payment for that loan became due; and
(ii) default data for loans in the 2020 P&I Repayment Vintage represents defaults occurring during the first 24 months after a loan’s First P&I Repayment Period regardless of the month in
2020 during which the first full principal and interest payment for that loan became due.
o For loans that default prior to their First P&I Repayment Period: Loans defaulting prior to their First P&I Repayment Period are included in the P&I Repayment Vintage corresponding to
the calendar year in which the default occurs, and are aggregated and reported in Year 0 of that P&I Repayment Vintage in the relevant charts and tables. For example: (a) if a loan’s First
P&I Repayment Period was scheduled for 2021, but the loan defaulted in 2020, the default amount is reflected in Year 0 of the 2020 P&I Repayment Vintage; and (b) if a loan’s First P&I
Repayment Period occurred in 2022, but the loan defaulted in 2021 before that First P&I Repayment Period, the default amount is reflected in Year 0 of the 2021 P&I Repayment Vintage.
o For loans that pay off prior to their First P&I Repayment Period: Loans paid off prior to their First P&I Repayment Period are included in the Disbursed Principal Entering P&I Repayment
of the P&I Repayment Vintage corresponding to the calendar year in which the payoff occurs.
Periodic Defaults – For any loan in a particular P&I Repayment Vintage, the defaulted principal and interest is reflected in the year corresponding to the number of years since the First P&I
Repayment Period for that loan.
Cumulative Defaults – At any time for a particular P&I Repayment Vintage, the cumulative sum of Periodic Defaults for that vintage.
o Defaulted principal includes any interest capitalization that occurred prior to default
o Defaulted principal is not reduced by any amounts recovered after the loan defaulted
o Because the numerator includes capitalized interest while the denominator (i.e., Disbursed Principal Entering P&I Repayment) does not, default rates are higher than they would be if the
numerator and denominator both included capitalized interest
Note: Historical trends suggested by the cohort default triangles may not be indicative of future performance.
Confidential and proprietary information. © 2023 Sallie Mae Bank. All rights reserved. 21Footnotes
1. Source: Enterval CBA Report as of September 2022.
2. N/A
3. The information on this page constitutes forward-looking statements. See page 2 of this Presentation for a cautionary note regarding forward-looking statements.
4. Source: Total post-secondary education spending is estimated by Sallie Mae determining the full-time equivalents for both graduates and undergraduates and multiplying by the estimated total per person cost of attendance for each school type. In doing so, we utilize information from the U.S. Department of
Education, National Center for Education Statistics, Projections of Education Statistics to 2027 (NCES 2020, October 2020), The Integrated Postsecondary Education Data System (IPEDS), College Board -Trends in Student Aid 2022. © 2022 The College Board, www.collegeboard.org, College Board -Trends in
Student Pricing 2022. © 2022 The College Board, www.collegeboard.org, National Student Clearinghouse - Term Enrollment Estimates, and Company analysis. 2021 Private Education Loan market assumptions use The College Board-Trends in Student Aid 2021 © 2021 trends and College Board-Trends in
Student Aid 2021 © 2021 data. Other sources for these data points also exist publicly and may vary from our computed estimates. NCES, IPEDS, and College Board restate their data annually, which may cause previous reports to vary. We have also recalculated figures in our Company analysis to standardize
all costs of attendance to dollars not adjusted for inflation. This has a minimal impact on historically-stated numbers.
5. Source: Sallie Mae sponsored research among repayment borrowers under age 35; December 2018 and March 2019; all data, except the % who completed their program, is based on borrowers who have earned at least a Bachelor's degree.; % who completed their program is the number of borrowers in
repayment who self reported completion of their program.
6. Represents the higher credit score of the cosigner or the borrower.
7. Derivative Accounting: we provide non-GAAP “Core Earnings” because it is one of several measures management uses to evaluate management performance and allocate corporate resources. Non-GAAP “Core Earnings” exclude periodic unrealized gains and losses caused by the mark-to-fair value valuations
on derivatives that do not qualify for hedge accounting treatment under GAAP, but include current period accruals on the derivative instruments. Under GAAP, for our derivatives held to maturity, the cumulative net unrealized gain or loss over the life of the contract will equal $0. Management believes the
Company’s derivatives are effective economic hedges, and, as such, they are a critical element of the Company’s interest rate risk management strategy. Our “Core Earnings” are not defined terms within GAAP and may not be comparable to similarly tilted measures reported by other companies. See page 28
for a reconciliation of GAAP and “Core Earnings.”
8. We calculate and report our Return on Assets (“ROA”) as the ratio of (a) GAAP net income numerator (annualized) to (b) the GAAP total average assets denominator.
9. We calculate and report our non-GAAP “Core Earnings” Return on Assets (“Core Earnings ROA”) as the ratio of (a) non-GAAP “Core Earnings” net income (loss) numerator (annualized) to (b) the GAAP total average assets denominator.
10. We calculate and report our Return on Common Equity (“ROCE”) as the ratio of (a) GAAP net income (loss) attributable to SLM Corporation common stock numerator (annualized) to (b) the net denominator, which consists of GAAP total average equity less total average preferred stock.
11. We calculate and report our non-GAAP “Core Earnings” Return on Common Equity (“Core Earnings ROCE”) as the ratio of (a) non-GAAP “Core Earnings” net income (loss) attributable to SLM Corporation common stock numerator (annualized) to (b) the net denominator, which consists of GAAP total average
equity less total average preferred stock.
12. Non-GAAP “Core Earnings” tax rate is based on the effective tax rate at Sallie Mae Bank where the derivative instruments are held.
13. Originations represent loans that were funded or acquired during the period presented.
14. Source: https://research.collegeboard.org/trends/student-aid
15. Source: National Center for Education Statistics: https://nces.ed.gov/programs/digest/d22/tables/dt22_104.20.asp
16. Source: Federal Reserve Bank: https://www.newyorkfed.org/research/college-labor-market/college-labor-market_wages.html
17. N/A
18. The Company’s expectation and ability to pay a quarterly cash dividend on its common stock in the future will be subject to the determination by, and discretion of, the Company’s Board of Directors, and any determination by the Board will be based on an evaluation of the Company’s earnings, financial
condition and requirements, business conditions, capital allocation determinations, and other factors, risks and uncertainties.
22You can also read