CompuGroup Medical SE - Leeway
←
→
Page content transcription
If your browser does not render page correctly, please read the page content below

CompuGroup Medical SE
Germany | Technology | MCap EUR 3,501m
10 May 2021                                                                                 UPDATE

Reaction to Q1 results                                                                       BUY (HOLD)

overdone – PT up;                                                                            Target price
                                                                                             Current price
                                                                                             Up/downside
                                                                                                                       EUR 72.00 (70.00)
                                                                                                                       EUR 65.15
                                                                                                                       10.5%

Upgrade to BUY
What’s it all about?
CompuGroup reported a mixed start to 2021, with Q1 revenues supported by organic
and inorganic growth. In the conference call, all eyes were on margins as well as capital
expenditure, which is assumed to be in the range of EUR 70m – EUR 80m in FY 2021.
Current market expectations of declining margins are not reasonable from our
perspective. To the contrary: expected synergies from recent acquisitions plus the
company’s additional investments to tap digitization opportunities in the healthcare
sector should drive organic growth and attractive EBITDA margins going forward.
Group targets are completely in line with our initial expectations (see start coverage on
research-hub.de). We maintain our view on CGM and updated our CAPEX assumptions              MAIN AUTHOR
after a discussion with the company (eAR: EUR 73m in 2021). As a result of lower             Thomas Wissler
CAPEX assumptions, we slightly increased our DCF-based price target to EUR 72.00             t.wissler@alsterresearch.com
(EUR 70.00) and changed our recommendation from HOLD to BUY. Upside potential                +49 40 309 293-58
stands at 11%. BUY on unjustified share price weakness.

IMPORTANT. Please refer to the last page of this report for “Important disclosures”          alsterresearch.com
and analyst(s) certifications.                                                               This research is the product of AlsterResearch, which is authorized
                                                                                             and regulated by the BaFin in Germany.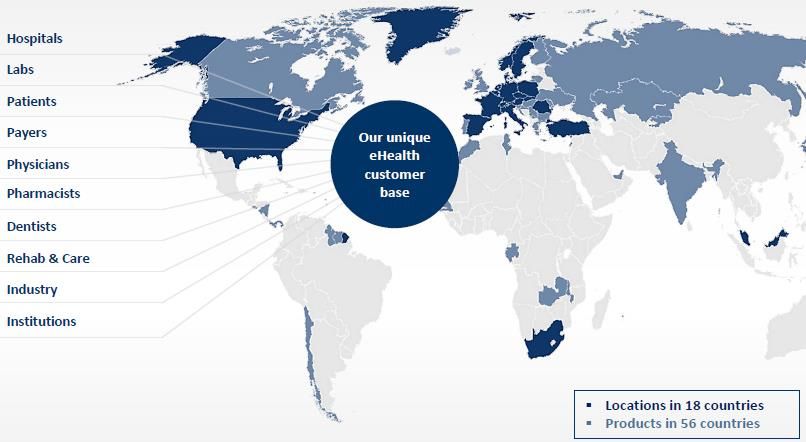
AlsterResearch
Page 2 of 16

CompuGroup Medical SE
Germany | Technology | MCap EUR 3,501m | EV EUR 4,022m
                                        Target price    EUR 72.00 (70.00)                MAIN AUTHOR
BUY (HOLD)                                                                               Thomas Wissler
                                        Current price   EUR 65.15
                                        Up/downside     10.5%                            t.wissler@alsterresearch.com
                                                                                         +49 40 309 293-58

Reaction overdone – PT up; HOLD to BUY

Won a large order for clinical suite solutions
CompuGroup reported healthy Q1 2021 results, helped by the rising digital demand in
healthcare. In addition to two acquisitions in the US in late 2020, management plans
to enhance its market position in France through the acquisition of Atalanta Group, a
leader in the field of physicians information systems, which is expected to be
complete by Q2 2021. Moreover, the company is scheduled to initiate a four-year
project in cooperation with Universitätsklinikum Hamburg-Eppendorf (UKE), a leading
university clinic in Europe, in May 2021.                                                Source: Company data, AlsterResearch

Steady organic improvement along with strong inorganic growth                            High/low 52 weeks                       85.40 / 59.40
Q1 revenues rose a solid 25% yoy to EUR 228.9m, with recurring revenue share rising      Price/Book Ratio                                 5.3x
to 69% (vs 59% in Q4 2020 and 67% in Q1 2020), but were below analysts’ consensus
expectations. The yoy growth in revenues was largely driven by contributions from        Ticker / Symbols
recent acquisitions, in addition to an organic (organic) growth of 4.9% yoy (Q4: +4.9%   ISIN                                   DE000A288904
yoy), driven by one-off revenues from the Telematics Infrastructure (TI) rollout to      WKN                                          A28890
pharmacies. Excluding TI, organic revenues grew a muted 1.5% yoy.                        Bloomberg                                    COP:GR

HIS and CHS were the major organic growth drivers                                        Changes in estimates
By segment, Hospital Information System (HIS) witnessed strong growth in revenues                                       Sales     EBIT     EPS
(+64% yoy to EUR 55.1m), mainly aided by Cerner’s healthcare portfolio acquisition,       2021         old               00.0     00.0     00.0
                                                                                                       ∆                    –        –        –
and an 8% yoy organic growth led by healthy German clinic business development.
                                                                                          2022         old               00.0     00.0     00.0
Consumer & Health Management Information System (CHS) revenues also increased                          ∆                    –        –        –
33% yoy to EUR 33.7m, boosted by organic strength (+34% yoy), largely driven by the       2023         old               00.0     00.0     00.0
roll-out of TI, excluding which organic growth came in at 9% yoy. Moreover,                            ∆                    –        –        –
Ambulatory Information System (AIS) revenues grew 18% yoy to EUR 112.2m (yet -1%
yoy organic), primarily supported by contributions from recently acquired eMDs in the    Key share data
US. In contrast, Pharmacy Information System (PIS) revenues declined 3% yoy to EUR       Number of shares: (in m pcs)                        54
27.9m as the base quarter benefited from the launch of Windows 10.                       Book value per share: (in €)                     12.20
                                                                                         Ø trading volume: (12 months)                   85,000
                                                                 - continued -
 CompuGroup                                                                              Major shareholders
                           2018       2019     2020      2021E        2022E      2023E
 Medical SE                                                                              Frank Gotthardt - Management                     6.8%
 Sales                      717        746       837     1,015        1,084      1,122   GT1 Vermögensverwaltung                         26.5%
 Growth yoy               23.1%       4.0%     12.3%     21.2%         6.8%       3.5%   Prof. Dr. Daniel Gotthardt                       6.7%
 EBITDA                     188        178       197       222          238        253
                                                                                         Free Float                                      50.0%
 EBIT                       143        115       122       154          165        179
 Net profit                   96         66       73        97          104        112   Company description
 Net debt (net cash)        308        464       477       385          300        193   CompuGroup is a software developer,
 Net debt/EBITDA            1.6x       2.6x     2.4x      1.7x         1.3x       0.8x
                                                                                         focusing on software solutions to the
 EPS recurring              1.94       1.35     1.40      1.80         1.93       2.09
                                                                                         healthcare       industry,    including
 DPS                        0.50       0.50     0.50      0.60         0.60       0.60
 Dividend yield            0.8%       0.8%      0.8%      0.9%         0.9%       0.9%
                                                                                         physicians,      pharmacies,      health
 Gross profit margin      81.5%      84.7%     85.2%     83.9%        83.9%      83.9%   insurances, laboratories, hospitals and
 EBITDA margin            26.2%      23.9%     23.6%     21.9%        22.0%      22.6%   rehabilitation and care facilities. Its
 EBIT margin              20.0%      15.5%     14.5%     15.2%        15.2%      16.0%   activities are divided into Ambulatory
 ROCE                     21.3%      13.0%      9.1%     11.0%        11.1%      11.8%   Information Systems (AIS), Pharmacy
 EV/EBITDA                20.4x      22.4x     20.4x     17.7x        16.2x      14.8x   Information Systems (PCS), Hospital
 EV/EBIT                  26.8x      34.7x     33.0x     25.5x        23.3x      20.9x   Information    Systems     (HIS)    and
 PER                      33.4x      48.2x     46.6x     36.2x        33.7x      31.2x   Consumer and Health Management
 FCF yield                 3.9%       2.6%      3.5%      4.8%         4.1%       4.8%   Information Systems (CHS).
 Source: Company data, Alster Research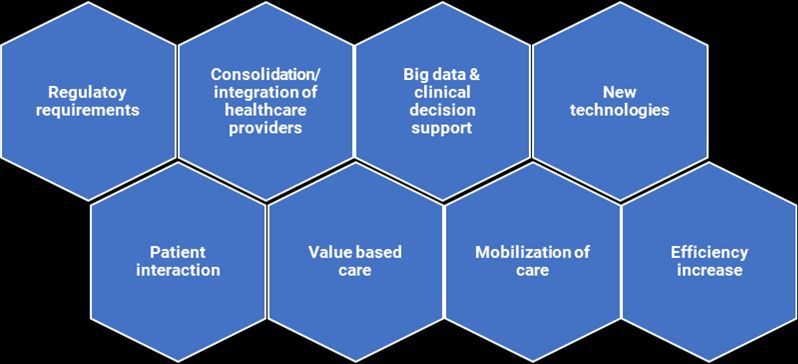
AlsterResearch
Page 3 of 16

Ongoing growth investments pressured margins
Consolidated adjusted EBITDA rose 7% yoy to EUR 46.5m (below analysts’
consensus estimate); however, the margin contracted 4ppt yoy to 20% owing to
announced future growth investments. By segment, adjusted EBITDA margins
deteriorated in AIS (-3ppt yoy to 26%), CHS (-4ppt yoy to 15%) and PIS (-2ppt yoy to
29%), while improved a marginal 1ppt yoy in HIS to 14%. Despite higher EBITDA line,
adjusted EPS fell 3% yoy to EUR 0.33 on higher depreciation.

Completed share buyback plan amid strong cash flow
Healthy cash generation from operations (on better working capital management)
resulted in a 38% yoy increase in FCF to EUR 70.4m. Moreover, the company
completed its recently increased (doubled) share repurchase programme of 1m (ca
1.9% of total share capital) for EUR 71.3m over 25 February to 29 April 2021 (EUR
43.3m in Q1). Given the strong FCF, net leverage remained stable at 2.0x (vs end-
2020), despite share buybacks.

Conclusion
CompuGroup reported a mixed start to 2021, with Q1 revenues supported by organic
and inorganic growth. For 2021, the group confirmed its target on sales of EUR 1bn
– EUR 1.04bn (organic growth: 4% – 8% yoy), with all its segments guided to report
higher revenue growth (at the midpoint). It expects an adjusted EBITDA of EUR 210m
– EUR 230m (margin: 21% – 22%), an adjusted EPS of EUR 1.70 – EUR 1.95, capital
expenditure of EUR 70m – EUR 80m and FCF of over EUR 80m. These targets are
completely in line with our initial expectations (see Initiation note from February 2
on research-hub.de), and therefore, we clearly confirm our view on CompuGroup. In
addition to expected synergies from its recent acquisitions, the company’s
additional investments to tap digitization opportunities in the healthcare sector
should drive organic growth and attractive EBITDA margins going forward.

Current market expectations of declining margins are not reasonable from our
perspective. To the contrary: expected synergies from recent acquisitions plus the
company’s additional investments to tap digitization opportunities in the healthcare
sector should drive organic growth and attractive EBITDA margins going forward.
We maintain our view on CGM and updated our CAPEX assumptions after a
discussion with the company (eAR: EUR 73m in 2021). As a result of lower CAPEX
assumptions, we slightly increased our DCF-based price target to EUR 72.00 (EUR
70.00) and changed our recommendation from HOLD to BUY. Upside potential
stands at 11%. BUY on unjustified share price weakness.

Quarterly table

 P&L data                Q2 2019       Q3 2019     Q4 2019       Q1 2020       Q2 2020    Q3 2020   Q4 2020   Q1 2021

 Sales                      186.6        177.9        206.1         183.0        179.9      231.3     242.9     228.9
 yoy growth in %            -2.1%         7.3%         6.0%         4.4%         -3.6%      30.0%     17.9%     25.1%
 Gross profit               148.0        150.0        163.0         151.0        150.0      191.0     189.0     187.5
 Gross margin in %          79.3%        84.3%        79.1%        82.5%         83.4%      82.6%     77.8%     81.9%
 EBITDA                      37.0         43.0         52.0          40.0         43.0       66.0      48.0      44.4
 EBITDA margin in %         19.8%        24.2%        25.2%        21.9%         23.9%      28.5%     19.8%     19.4%
 EBIT                        22.6         28.5         33.4          23.3         26.0       48.1      25.0      17.5
 EBIT margin in %           12.1%        16.0%        16.2%        12.7%         14.5%      20.8%     10.3%      7.7%
 EBT                         20.3         27.2         31.0          18.8         23.2       49.3      19.0      16.1
 taxes paid                   6.1          9.1         17.6           6.0           7.0      14.5       9.6       5.1
 tax rate in %              30.1%        33.5%        56.7%        31.8%         30.0%      29.3%     50.5%     31.6%
 net profit                  14.0         18.1         13.4          12.7         16.3       34.8       9.4      11.0
 yoy growth in %           -44.6%         6.4%       -60.8%        -37.8%        16.8%      92.5%    -29.8%    -13.5%
 EPS                          0.29        0.37         0.29          0.26         0.34       0.69      0.15      0.20
Source: Company data; AlsterResearch
AlsterResearch
Page 4 of 16

Investment case in six charts
Operating segments                                                Sales by segments

                                                                     Ambulatory
                                                                     Information
                                                                       Systems                      Pharmacy
                                                                         45%                       Information
                                                                                                     Systems
                                                                                                       14%

                                                                      Consumer &
                                                                         Health               Hospital
                                                                      Management            Information
                                                                      Information             Systems
                                                                        Systems                 22%
                                                                          19%

Recurring revenues increase visibility                            Market trends

Shareholder structure                                             Customers and locations

                                  Dr Reinhard Koop
                    Dr Brigitte
                                         4%
                    Gotthardt
                        6%

      Prof Dr Daniel
        Gotthardt
            7%

  Frank Gotthardt
        7%

                                                     Free Float
                                                        50%

    GT1 Vermögens-
    verwaltung GmbH
          26%

Source: Company data; AlsterResearch
AlsterResearch
Page 5 of 16
SWOT - Analysis
Strengths
● Around 90% of the business is protected by high barriers to entry
● High share of recurring revenues (60%), indicating defensive strengths
● Great track record on acquisitions
● Founding family continues to control the business
Weaknesses
● Low, albeit fairly secure, underlying growth
● Wage inflation at the level of underlying growth
● Dependence on increasing regulation for attractive growth rates
● Higher level of goodwill after recent acquisitions
Opportunities
● Consumerisation of healthcare
● Increasing digitalisation of healthcare
● Market share gains based on Telematics Infrastructure (TI) roll-out
● Ongoing industry consolidation based on growing regulatory
requirements
Threats
● Loss of political support for healthcare digitalisation
● Consolidation of pharmacies and hospitals
● Regulation allowing open-source, interoperable software
● Overpaying for, or mishandling, M&A dealsAlsterResearch Page 6 of 16 Company background CompuGroup Medical is a listed software company and an international provider of software for the healthcare sector. It produces application software to support medical and organisational activities in medical practices, pharmacies, medical laboratories and hospitals. The company’s vision is to simplify the recording of data and treatment paths, electronic billing and better the organization of practice. CompuGroup Medical provides vital software to improve health and quality of life. The company builds bridges between doctors, pharmacists, payers, laboratories, rehabilitation and care facilities as well as hospitals, helping them to provide people with optimal care. CompuGroup Medical operates in four segments: Ambulatory Information Systems, Pharmacy Information Systems, Hospital Information Systems and Consumer & Health Management Information Systems. The Group has several locations in 18 countries providing its products and services in nearly 60 countries worldwide. CompuGroup Medical Source: Company data, AlsterResearch AG
AlsterResearch
  Page 7 of 16

  Valuation
  The DCF model results in a price target of EUR 72.00 per share. Key model
  assumptions:

          •          Top-line growth: We expect CompuGroup to continue benefitting from
                     structural growth and digitalization in the Health Care sector. Hence our
                     growth estimates for 2021-28E is in the range of 4% p.a.

          •          The long-term growth rate is set at 2.0%.

          •          EBIT margins. The scalable business model should allow for EBIT margins
                     of above 16% by 2023E, which look defendable given high competitive
                     quality. Accordingly, we model approx. 18% EBIT margins in the long-term.

          •          WACC. We model a weighted average cost of capital of 5.0% to reflect the
                     mature stage of the business model as well as a high share of recurring
                     revenues. A 5.0% risk premium, a beta of 0.7x and a 2.0% risk free rate are
                     modelled.

DCF (EUR m)                                                                                                                                        Terminal
                                              2021E     2022E        2023E         2024E      2025E      2026E       2027E           2028E
(except per share data and beta)                                                                                                                      value
NOPAT                                           129       137           146          169        182         188           192              198
Depreciation                                      32        36            35           31         28          27            26               25
Change in working capital                         19       -20             -0           -8         -0          3             -5               -2
Chg. in long-term provisions                       8        10              6          13           5          2              7                7
Capex                                            -73       -51           -53          -51        -53         -55           -57              -59
Cash flow                                       115       113           134          154        162         165           163              170       5,001
Present value                                   111       103           117          126        126         122           114              113       3,328
WACC                                           5.5%      5.5%          5.5%         5.5%       5.5%        5.5%          5.5%             5.5%        5.5%

DCF per share derived from                                        DCF avg. growth and earnings assumptions
                                                                  Planning horizon avg. revenue growth (2021E - 2028E)                                4.0%
Total present value                            4,260              Terminal value growth (2028E - infinity)                                            2.0%
Mid-year adj. total present value              4,376              Terminal year ROCE                                                                 11.8%
Net debt / cash at start of year                 477              Terminal year WACC                                                                  5.5%
Financial assets                                  33
Provisions and off b/s debt                       44              Terminal WACC derived from
Equity value                                   3,888              Cost of borrowing (before taxes)                                                    5.0%
No. of shares outstanding                       53.7              Long-term tax rate                                                                  30%
                                                                  Equity beta                                                                         0.61
Discounted cash flow per share                72.36               Unlevered beta (industry or company)                                                0.69
upside/(downside)                             11.1%               Target debt / equity                                                                  0.1
                                                                  Relevered beta                                                                      0.69
                                                                  Risk-free rate                                                                      2.0%
                                                                  Equity risk premium                                                                 5.0%
Share price                                   65.15               Cost of equity                                                                      5.5%

Sensitivity analysis DCF

                                                               Long term growth                                    Share of present value
                              73,1           1.0%      1.5%         2.0%          2.5%       3.0%
    Change in WACC

                                      2.0%    37.1      39.8         42.9          46.6       51.2                       2021E - 2024E               10.7%
       (%-points)

                                      1.0%    45.5      49.5         54.3          60.4       68.2                       2025E - 2028E               11.1%
                                      0.0%    57.7      64.1         72.4          83.4       99.0                       terminal value              78.1%
                                     -1.0%    76.8      88.5        105.0         129.8      171.5
                                     -2.0%   111.5     137.8        182.0         271.6      550.7

Source: AlsterResearch
AlsterResearch
Page 8 of 16
Due to the fact that companies rarely bear sufficient resemblance to peers in terms
of geographical exposure, size or competitive strength and in order to adjust for the
pitfalls of weak long-term visibility, an Adjusted Free Cash Flow analysis (Adjusted
FCF) has been conducted.
The adjusted Free Cash Flow Yield results in a fair value between EUR 41.00 per
share based on 2021E and EUR 67.00 per share on 2025E estimates.
The main driver of this model is the level of return available to a controlling investor,
influenced by the cost of that investors’ capital (opportunity costs) and the purchase
price – in this case the enterprise value of the company. Here, the adjusted FCF yield
is used as a proxy for the required return and is defined as EBITDA less minority
interest, taxes and investments required to maintain existing assets (maintenance
capex).
FCF yield in EURm 2021E 2022E 2023E 2024E 2025E
EBITDA 222 238 253 272 288
- Maintenance capex 22 25 25 22 20
- Minorities -0 -1 -0 -1 -1
- tax expenses 46 49 55 58 63
= Adjusted Free Cash Flow 154 164 173 193 205
Actual Market Cap 3,460 3,460 3,460 3,460 3,460
+ Net debt (cash) 385 300 193 67 -58
+ Pension provisions 43 46 48 52 54
+ Off b/s financing 0 0 0 0 0
- Financial assets 33 33 33 33 33
- Acc. dividend payments 26 58 91 123 163
EV Reconciliations 369 255 117 -37 -200
= Actual EV' 3,829 3,715 3,577 3,423 3,260
Adjusted FCF yield 4.0% 4.4% 4.8% 5.6% 6.3%
base hurdle rate 6.0% 6.0% 6.0% 6.0% 6.0%
ESG adjustment 0.0% 0.0% 0.0% 0.0% 0.0%
adjusted hurdle rate 6.0% 6.0% 6.0% 6.0% 6.0%
Fair EV 2,568 2,737 2,888 3,222 3,422
- EV Reconciliations 369 255 117 -37 -200
Fair Market Cap 2,200 2,483 2,771 3,259 3,622
No. of shares (million) 54 54 54 54 54
Fair value / share in EUR 40.94 46.20 51.58 60.65 67.41
Premium (-) / discount (+) -36.4% -28.3% -19.9% -5.8% 4.7%
Sensitivity analysis fair value
4.0% 65 72 78 91 99
5.0% 50 56 62 73 80
Adjusted
6.0% 41 46 52 61 67
hurdle rate
7.0% 34 39 44 52 58
8.0% 29 33 38 46 51
Source: AlsterResearch
Simply put, the model assumes that investors require companies to generate a
minimum return on the investor’s purchase price. The required after-tax return
equals the model’s hurdle rate of 6%. Anything less suggests the stock is expensive;
anything more suggests the stock is cheap. ESG adjustments might be applicable,
based on the overall Leeway ESG Score. A high score indicates high awareness for
environmental, social or governance issues and thus might lower the overall risk
an investment in the company might carry. A low score on the contrary might
increase the risk of an investment and might therefore trigger a higher required
hurdle rate.AlsterResearch
Page 9 of 16
Financials in six charts
Sales vs. EBITDA margin development EPS, DPS in EUR & yoy EPS growth
1.200 27% 2,50 250%
26%
1.000 200%
2,00
25%
800 150%
24%
1,50
600 23% 100%
22% 1,00
400 50%
21%
200 0,50
20% 0%
0 19% 0,00 -50%
17 18 19 20 21E 22E 23E 17 18 19 20 21E 22E 23E
Sales (€m) EBITDA margin (%) EPS DPS EPS growth
ROCE vs. WACC (pre tax) Net debt and net debt/EBITDA
25% 600 3,00x
20% 500 2,50x
400 2,00x
15%
300 1,50x
10%
200 1,00x
5%
100 0,50x
0% 0 0,00x
17 18 19 20 21E 22E 23E 17 18 19 20 21E 22E 23E
ROCE WACC pre tax Net debt (€m) Net debt / EBITDA (x)
Capex & chgn in w/c requirements in EURm Free Cash Flow in EURm
90 120
80
100
70
60
80
50
40 60
30
40
20
10
20
0
17 18 19 20 21E 22E 23E
0
Capex Change in w/c
17 18 19 20 21E 22E 23E
Source: Company data; AlsterResearchAlsterResearch Page 10 of 16 Financials Profit and loss (EUR m) 2018 2019 2020 2021E 2022E 2023E Net sales 717 746 837 1,015 1,084 1,122 Sales growth 23.1% 4.0% 12.3% 21.2% 6.8% 3.5% Change in finished goods and work-in-process 19 25 32 24 26 26 Total sales 736 770 869 1,039 1,109 1,148 Material expenses 151 139 156 188 200 208 Gross profit 584 631 713 851 909 941 Other operating income 8 13 11 10 11 11 Personnel expenses 281 339 377 446 477 494 Other operating expenses 123 127 149 193 205 205 EBITDA 188 178 197 222 238 253 Depreciation 11 29 31 32 36 35 EBITA 176 150 167 190 202 218 Amortisation of goodwill and intangible assets 33 34 45 35 37 38 EBIT 143 115 122 154 165 179 Financial result -9 -8 -11 -11 -11 -11 Recurring pretax income from continuing operations 134 108 110 143 154 168 Extraordinary income/loss 0 0 0 0 0 0 Earnings before taxes 134 108 110 143 154 168 Taxes 38 42 37 46 49 55 Net income from continuing operations 96 66 73 97 104 113 Result from discontinued operations (net of tax) 0 0 0 0 0 0 Net income 96 66 73 97 104 113 Minority interest -0 -0 -0 -0 -1 -0 Net profit (reported) 96 66 73 97 104 112 Average number of shares 49.21 48.70 52.37 53.73 53.73 53.73 EPS reported 1.94 1.35 1.40 1.80 1.93 2.09 Profit and loss (common size) 2018 2019 2020 2021E 2022E 2023E Net sales 100% 100% 100% 100% 100% 100% Change in finished goods and work-in-process 3% 3% 4% 2% 2% 2% Total sales 103% 103% 104% 102% 102% 102% Material expenses 21% 19% 19% 19% 19% 18% Gross profit 81% 85% 85% 84% 84% 84% Other operating income 1% 2% 1% 1% 1% 1% Personnel expenses 39% 46% 45% 44% 44% 44% Other operating expenses 17% 17% 18% 19% 19% 18% EBITDA 26% 24% 24% 22% 22% 23% Depreciation 2% 4% 4% 3% 3% 3% EBITA 25% 20% 20% 19% 19% 19% Amortisation of goodwill and intangible assets 5% 5% 5% 3% 3% 3% EBIT 20% 15% 15% 15% 15% 16% Financial result -1% -1% -1% -1% -1% -1% Recurring pretax income from continuing operations 19% 14% 13% 14% 14% 15% Extraordinary income/loss 0% 0% 0% 0% 0% 0% Earnings before taxes 19% 14% 13% 14% 14% 15% Taxes 5% 6% 4% 5% 5% 5% Net income from continuing operations 13% 9% 9% 10% 10% 10% Result from discontinued operations (net of tax) 0% 0% 0% 0% 0% 0% Net income 13% 9% 9% 10% 10% 10% Minority interest -0% -0% -0% -0% -0% -0% Net profit (reported) 13% 9% 9% 10% 10% 10% Source: Company data; AlsterResearch
AlsterResearch
Page 11 of 16

 Balance sheet (EUR m)                                       2018   2019    2020    2021E   2022E   2023E
 Intangible assets (exl. Goodwill)                            274    337      546     554     547     540
 Goodwill                                                     262    331      542     542     542     542
 Property, plant and equipment                                 84    131      136     134     118     104
 Financial assets                                              35     33       33      33      33      33
 FIXED ASSETS                                                 655    833    1,258   1,263   1,241   1,220
 Inventories                                                   20     27       18      21      25      27
 Accounts receivable                                          114    112      161     161     186     187
 Other current assets                                          21     30       28      28      28      28
 Liquid assets                                                 22     47       77     164     248     306
 Deferred taxes                                                 0      0        0       0       0       0
 Deferred charges and prepaid expenses                         16     17       24      15      19      24
 CURRENT ASSETS                                               193    233     308      388     506     571
 TOTAL ASSETS                                                 848   1,066   1,566   1,651   1,747   1,791
 SHAREHOLDERS EQUITY                                          262    259     639      710     782     862
 MINORITY INTEREST                                              2      1       0        0       0       0
 Long-term debt                                               319    453     498      498     498     453
 Provisions for pensions and similar obligations               25     31      44       43      46      48
 Other provisions                                              57     86      94      103     110     114
 Non-current liabilities                                      400    570     636      644     654     615
 short-term liabilities to banks                               11     58      56       50      50      45
 Accounts payable                                              39     47      65       65      71      71
 Advance payments received on orders                           34     42      64       52      58      64
 Other liabilities (incl. from lease and rental contracts)     34      7       6       21      22      24
 Deferred taxes                                                44     71      83       83      83      83
 Deferred income                                               22     11      17       27      27      26
 Current liabilities                                          184    236     291      297     310     313
 TOTAL LIABILITIES AND SHAREHOLDERS EQUITY                    848   1,066   1,566   1,651   1,747   1,791

 Balance sheet (common size)                                 2018   2019    2020    2021E   2022E   2023E
 Intangible assets (excl. Goodwill)                          32%     32%     35%     34%     31%     30%
 Goodwill                                                    31%     31%     35%     33%     31%     30%
 Property, plant and equipment                               10%     12%      9%      8%      7%      6%
 Financial assets                                             4%      3%      2%      2%      2%      2%
 FIXED ASSETS                                                77%     78%     80%     76%     71%     68%
 Inventories                                                  2%      3%      1%      1%      1%      2%
 Accounts receivable                                         13%     11%     10%     10%     11%     10%
 Other current assets                                         3%      3%      2%      2%      2%      2%
 Liquid assets                                                3%      4%      5%     10%     14%     17%
 Deferred taxes                                               0%      0%      0%      0%      0%      0%
 Deferred charges and prepaid expenses                        2%      2%      2%      1%      1%      1%
 CURRENT ASSETS                                              23%     22%     20%     24%     29%     32%
 TOTAL ASSETS                                                100%   100%    100%    100%    100%    100%
 SHAREHOLDERS EQUITY                                         31%     24%     41%     43%     45%     48%
 MINORITY INTEREST                                            0%      0%      0%      0%      0%      0%
 Long-term debt                                              38%     42%     32%     30%     29%     25%
 Provisions for pensions and similar obligations              3%      3%      3%      3%      3%      3%
 Other provisions                                             7%      8%      6%      6%      6%      6%
 Non-current liabilities                                     47%     53%     41%     39%     37%     34%
 short-term liabilities to banks                              1%      5%      4%      3%      3%      3%
 Accounts payable                                             5%      4%      4%      4%      4%      4%
 Advance payments received on orders                          4%      4%      4%      3%      3%      4%
 Other liabilities (incl. from lease and rental contracts)    4%      1%      0%      1%      1%      1%
 Deferred taxes                                               5%      7%      5%      5%      5%      5%
 Deferred income                                              3%      1%      1%      2%      2%      1%
 Current liabilities                                         22%     22%     19%     18%     18%     17%
 TOTAL LIABILITIES AND SHAREHOLDERS EQUITY                   100%   100%    100%    100%    100%    100%
 Source: Company data; AlsterResearch
AlsterResearch
Page 12 of 16

 Cash flow statement (EUR m)                       2018    2019     2020     2021E     2022E     2023E
 Net profit/loss                                     93       66       73        97      104       113
 Depreciation of fixed assets (incl. leases)         45       63       76        32        36        35
 Amortisation of goodwill                              0        0        0         0         0         0
 Amortisation of intangible assets                     0        0        0       35        37        38
 Others                                              14         6      13          8       10          6
 Cash flow from operations before changes in w/c   152      135      162       173       187       193
  Increase/decrease in inventory                      -7       -6        9        -3        -4        -3
  Increase/decrease in accounts receivable          -13      -11      -34         -1      -25         -0
  Increase/decrease in accounts payable               -5        4      11          0         6         0
  Increase/decrease in other w/c positions           10      -11         1       22          3         2
 Increase/decrease in working capital               -15      -24      -12        19       -20         -0
 Cash flow from operating activities               136      110      150       192       168       192
 CAPEX                                              -40      -44      -56       -73       -51       -53
 Payments for acquisitions                            -8     -97    -400           0         0         0
 Financial investments                                 0        0       -2         0         0         0
 Income from asset disposals                           1        0        1         0         0         0
 Cash flow from investing activities               -48     -140     -457       -73       -51       -53
 Cash flow before financing                          89      -29    -307       119       117       140
 Increase/decrease in debt position                 -51     118        25         -6         0      -50
 Purchase of own shares                             -25      -41         0         0         0         0
 Capital measures                                      0        0    338           0         0         0
 Dividends paid                                     -17      -24      -24       -26       -32       -32
 Others                                               -0       -3       -1         0         0         0
 Effects of exchange rate changes on cash             -1        0       -1         0         0         0
 Cash flow from financing activities               -94        50     337       -33       -32       -82
 Increase/decrease in liquid assets                   -5      21       29        86        85        57
 Liquid assets at end of period                      25       46       76      162       247       304
 Source: Company data; AlsterResearch
AlsterResearch
Page 13 of 16

 Ratios                                  2018     2019    2020    2021E    2022E    2023E
 Per share data
 Earnings per share reported              1.95     1.35    1.40    1.80     1.93     2.09
 Cash flow per share                      2.54     1.68    2.27    3.15     2.65     3.12
 Book value per share                     5.32     5.32   12.20   13.21    14.55    16.05
 Dividend per share                       0.50     0.50    0.50    0.60     0.60     0.60
 Valuation
 P/E                                     33.4x    48.2x   46.6x   36.2x    33.7x    31.2x
 P/CF                                    25.7x    38.7x   28.7x   20.7x    24.6x    20.9x
 P/BV                                    12.2x    12.2x    5.3x    4.9x     4.5x     4.1x
 Dividend yield (%)                       0.8%     0.8%    0.8%    0.9%     0.9%     0.9%
 FCF yield (%)                            3.9%     2.6%    3.5%    4.8%     4.1%     4.8%
 EV/Sales                                 5.3x     5.4x    4.8x    3.9x     3.5x     3.3x
 EV/EBITDA                               20.4x    22.4x   20.4x   17.7x    16.2x    14.8x
 EV/EBIT                                 26.8x    34.7x   33.0x   25.5x    23.3x    20.9x
 Income statement (EURm)
 Sales                                     717      746     837   1,015    1,084    1,122
 yoy chg in %                            23.1%     4.0%   12.3%   21.2%     6.8%     3.5%
 Gross profit                              584      631     713     851      909      941
 Gross margin in %                       81.5%    84.7%   85.2%   83.9%    83.9%    83.9%
 EBITDA                                    188      178     197     222      238      253
 EBITDA margin in %                      26.2%    23.9%   23.6%   21.9%    22.0%    22.6%
 EBIT                                      143      115     122     154      165      179
 EBIT margin in %                        20.0%    15.5%   14.5%   15.2%    15.2%    16.0%
 Net profit                                 96       66      73      97      104      112
 Cash flow statement (EURm)
 CF from operations                       136      110     150      192      168      192
 Capex                                     -40      -44     -56      -73      -51      -53
 Maintenance Capex                          11       29      31       22       25       25
 Free cash flow                             96       67      94     119      117      140
 Balance sheet (EURm)
 Intangible assets                        537      668    1,088   1,096    1,089    1,082
 Tangible assets                           84      131      136     134      118      104
 Shareholders' equity                     262      259      639     710      782      862
 Pension provisions                        25       31       44      43       46       48
 Liabilities and provisions               411      628      693     694      704      660
 Net financial debt                       308      464      477     385      300      193
 w/c requirements                          60       50       50      66       82       79
 Ratios
 ROE                                     36.8%    25.5%   11.5%   13.7%    13.4%    13.1%
 ROCE                                    21.3%    13.0%    9.1%   11.0%    11.1%    11.8%
 Net gearing                            117.5%   179.0%   74.7%   54.2%    38.4%    22.4%
 Net debt / EBITDA                        1.6x     2.6x    2.4x    1.7x     1.3x     0.8x
 Source: Company data; AlsterResearch
AlsterResearch
Page 14 of 16

Conflict of interests
Disclosures regarding research publications of SRH AlsterResearch AG pursuant to section 85 of the German Securities Trading
Act (WpHG) and distributed in the UK under an EEA branch passport, subject to the FCA requirements on research
recommendation disclosures It is essential that any research recommendation is fairly presented and discloses interests of
indicates relevant conflicts of interest. Pursuant to section 85 of the German Securities Trading Act (WpHG) a research report has
to point out possible conflicts of interest in connection with the analyzed company. Further to this, under the FCA’s rules on
research recommendations, any conflicts of interest in connection with the recommendation must be disclosed. A conflict of
interest is presumed to exist in particular if SRH AlsterResearch AG

(1)       or its affiliate(s) (either in its own right or as part of a consortium) within the past twelve months, acquired the financial
          instruments of the analyzed company,

(2)       has entered into an agreement on the production of the research report with the analyzed company,

(3)       or its affiliate(s) has, within the past twelve months, been party to an agreement on the provision of investment banking
          services with the analyzed company or have received services or a promise of services under the term of such an
          agreement,

(4)       or its affiliate(s) holds a) 5% or more of the share capital of the analyzed company, or b) the analyzed company holds 5%
          or more of the share capital of SRH AlsterResearch AG or its affiliate(s),

(5)       or its affiliate(s) holds a net long (a) or a net short (b) position of 0.5% of the outstanding share capital of the analyzed
          company or derivatives thereof,

(6)       or its affiliate(s) is a market maker or liquidity provider in the financial instruments of the issuer,

(7)       or the analyst has any other significant financial interests relating to the analyzed company such as, for example,
          exercising mandates in the interest of the analyzed company or a significant conflict of interest with respect to the issuer,

(8)       The research report has been made available to the company prior to its publication. Thereafter, only factual changes
          have been made to the report.

Conflicts of interest that existed at the time when this research report was published:

Company                                                               Disclosure
CompuGroup Medical SE
AlsterResearch
Page 15 of 16
Important disclosures
1. General Information/Liabilities This research report has been produced for the The decision on the choice of the financial instruments analyzed in this document
information purposes of institutional investors only, and is not in any way a was solely made by SRH AlsterResearch AG. The opinions and estimates in this
personal recommendation, offer or solicitation to buy or sell the financial research report are subject to change without notice. It is within the discretion of
instruments mentioned herein. The document is confidential and is made SRH AlsterResearch AG whether and when it publishes an update to this research
available by SRH AlsterResearch AG, exclusively to selected recipients [in DE, GB, report, but in general updates are created on a regular basis, after 6 months at
FR, CH, US, UK, Scandinavia, and Benelux or, in individual cases, also in other the latest. A sensitivity analysis is included and published in company’s initial
countries]. A distribution to private investors in the sense of the German studies.
Securities Trading Act (WpHG) is excluded. It is not allowed to pass the research
report on to persons other than the intended recipient without the permission of 5. Date and time of first publication of the financial analysis
SRH AlsterResearch AG. Reproduction of this document, in whole or in part, is not 08.02.2020
permitted without prior permission SRH AlsterResearch AG. All rights reserved.
Under no circumstances shall SRH AlsterResearch AG, any of its employees 6. Risk information
involved in the preparation, have any liability for possible errors or • Stock exchange investments and investments in companies (shares) are
incompleteness of the information included in this research report – neither in always speculative and involve the risk of total loss.
relation to indirect or direct nor consequential damages. Liability for damages • This is particularly true in respect of investments in companies which are
arising either directly or as a consequence of the use of information, opinions and not established and/or small and have no established business or
estimates is also excluded. Past performance of a financial instrument is not corporate assets.
necessarily indicative of future performance. • Share prices may fluctuate significantly. This is particularly true for shares
with low liquidity (market breadth). Even small orders can have a significant
2. Responsibilities This research report was prepared by the research analyst impact on the share price.
named on the front page (the ʺProducerʺ). The Producer is solely responsible for • In the case of shares in narrow markets, it may also happen that there is no
the views and estimates expressed in this report. The report has been prepared or very little actual trading there and that published prices are not based on
independently. The content of the research report was not influenced by the actual trading but have only been provided by a stockbroker.
issuer of the analyzed financial instrument at any time. It may be possible that • In such markets a shareholder cannot expect to find a buyer for his shares
parts of the research report were handed out to the issuer for information at all and/or at reasonable prices. In such narrow markets there is a very
purposes prior to the publication without any major amendments high possibility of manipulating prices and in such markets there are often
being made thereafter. considerable price fluctuations.
• An investment in shares with low liquidity and low market capitalization is
3. Organizational Requirements SRH AlsterResearch AG took internal therefore highly speculative and represents a very high risk.
organizational and regulative precautions to avoid or accordingly disclose • There is no regulated market for unlisted shares and securities and a sale
possible conflicts of interest in connection with the preparation and distribution is not possible or only possible on an individual basis.
of the research report. All members of AlsterResearch AG involved in the
preparation of the research report are subject to internal compliance regulations. 7. Major Sources of Information Part of the information required for this research
No part of the Producer’s compensation is directly or indirectly related to the report was made available by the issuer of the financial instrument. Furthermore,
preparation of this financial analysis. In case a research analyst or a closely this report is based on publicly available sources (such as, for example,
related person is confronted with a conflict of interest, the research analyst is Bloomberg, Reuters, VWD-Trader and the relevant daily press) believed to be
restricted from covering this company. reliable. SRH AlsterResearch AG has checked the information for plausibility but
not for accuracy or completeness.
4. Information Concerning the Methods of Valuation/Update The determination
of the fair value per share, i.e. the price target, and the resultant rating is done on 8. Competent Supervisory Authority SRH AlsterResearch AG are under
the basis of the adjusted free cash flow (adj. FCF) method and on the basis of supervision of the BaFin – German Federal Financial Supervisory Authority
the discounted cash flow – DCF model. Furthermore, a peer group comparison is (Bundesanstalt für Finanzdienstleistungsaufsicht), Graurheindorfer Straße 108,
made. The adj. FCF method is based on the assumption that investors purchase 53117 Bonn and Marie-Curie-Straße 24 – 28, 60439 Frankfurt a.M. This
assets only at a price (enterprise value) at which the operating cash flow return document is distributed in the UK under a MiFID EEA branch passport and in
after taxes on this investment exceeds their opportunity costs in the form of a compliance with the applicable FCA requirements.
hurdle rate of 7.5%. The operating cash flow is calculated as EBITDA less
maintenance capex and taxes. Within the framework of the DCF approach, the 9. Specific Comments for Recipients Outside of Germany This research report
future free cash flows are calculated initially on the basis of a fictitious capital is subject to the law of the Federal Republic of Germany. The distribution of this
structure of 100% equity, i.e. interest and repayments on debt capital are not information to other states in particular to the USA, Canada, Australia and Japan
factored in initially. The adjustment towards the actual capital structure is done may be restricted or prohibited by the laws applicable within this state.
by discounting the calculated free cash flows with the weighted average cost of
capital (WACC), which takes into account both the cost of equity capital and the 10. Miscellaneous According to Article 4(1) No. i of the delegated regulation
cost of debt. After discounting, the calculated total enterprise value is reduced by 2016/958 supplementing regulation 596/2014 of the European Parliament,
the interest-bearing debt capital in order to arrive at the equity value. Detailed further information regarding investment recommendations of the last 12
information on the valuation principles and methods used and the underlying months are published free of charge under https://www.alsterresearch.com.
assumptions can be found at https://www.alsterresearch.com.
SRH AlsterResearch AG uses the following three-step rating system for the
analyzed companies:
• Buy: Sustainable upside potential of more than 10% within 12 months
• Sell: Sustainable downside potential of more than 10% within 12 months.
• Hold: Upside/downside potential is limited. No immediate catalyst visible.
NB: The ratings of SRH AlsterResearch AG are not based on a performance that
is expected to be “relative“ to the market.AlsterResearch
Page 16 of 16
Contacts
SRH AlsterResearch AG Research
Himmelstr. 9
22299 Hamburg OLIVER DREBING
Senior Analyst
Tel: +49 40 309 293-57
Tel: +49 40 309 293-52 E-Mail: o.drebing@alsterresearch.com
Fax: +49 40 556 330-54 KARSTEN RAHLF, CFA
E-Mail: info@alsterresearch.com Senior Analyst
Tel: +49 40 309 293-54
E-Mail: k.rahlf@alsterresearch.com
KATHARINA SCHLÖTER
Analyst
Tel: +49 40 309 293-52
E-Mail: k.schloeter@alsterresearch.com
THOMAS WISSLER
Senior Analyst
Tel: +49 40 309 293-58
E-Mail: t.wissler@alsterresearch.com
DR. OLIVER WOJAHN, CFA
Senior Analyst
Tel: +49 40 309 293-58
E-Mail: o.wojahn@alsterresearch.com
ALEXANDER ZIENKOWICZ
Senior Analyst
Tel: +49 40 309 293-56
E-Mail: a.zienkowicz@alsterresearch.com
Sales
MARKUS KÖNIG-WEISS
Head of Sales
Tel: +49 40 309 293-52
E-Mail: mkw@alsterresearch.com
mwb fairtrade Wertpapierhandelsbank AG Equity Capital Markets / Trading
Rottenbucher Straße 28 KAI JORDAN
82166 Gräfelfing Member of the Board
Tel: +49 40 36 0995-22
E-Mail: kjordan@mwbfairtrade.com
Tel: +49 89 85852-0 ALEXANDER DEUSS
Fax: +49 89 85852-505 Head of Institutional Sales
Tel: +49 40 36 0995- 22
E-Mail: info@mwbfairtrade.com E-Mail: adeuss@mwbfairtrade.com
SASCHA GUENON
Head of Designated Sponsoring
Tel: +49 40 360 995 - 23
E-Mail: sguenon@mwbfairtrade.com
Our research can be found under RESEARCH HUB www.research-hub.de
BLOOMBERG www.bloomberg.com
FACTSET www.factset.com
THOMSON REUTERS / REFINITIV www.refinitiv.com
CAPITALIQ www.capitaliq.comYou can also read