Earnings Presentation - BW LPG

Page created by Jeffrey Lawrence
 
CONTINUE READING
Earnings Presentation - BW LPG
Earnings Presentation
Q1 2021
Earnings Presentation - BW LPG
Disclaimer and Forward-Looking Statements

This presentation has been produced by BW LPG Limited (“BW LPG”) exclusively for information purposes. This presentation may not be reproduced or redistributed, in whole or in part, to any other person.

Matters discussed in this presentation and any materials distributed in connection with this presentation may constitute or include forward–looking statements. Forward–looking statements are statements that are not historical
facts and may be identified by words such as “anticipates”, “believes”, “continues”, “estimates”, “expects”, “intends”, “may”, “should”, “will” and similar expressions, such as “going forward”. These forward–looking statements reflect
BW LPG’s reasonable beliefs, intentions and current expectations concerning, among other things, BW LPG’s results of operations, financial condition, liquidity, prospects, growth and strategies. Forward–looking statements
include statements regarding: objectives, goals, strategies, outlook and growth prospects; future plans, events or performance and potential for future growth; liquidity, capital resources and capital expenditures; economic outlook
and industry trends; developments of BW LPG’s markets; the impact of regulatory initiatives; and the strength of BW LPG’s competitors. Forward–looking statements involve risks and uncertainties because they relate to events
and depend on circumstances that may or may not occur in the future. The forward–looking statements in this presentation are based upon various assumptions, many of which are based, in turn, upon further assumptions,
including without limitation, management’s examination of historical operating trends, data contained in BW LPG’s records and other data available from Fourth parties. Although BW LPG believes that these assumptions were
reasonable when made, these assumptions are inherently subject to significant known and unknown risks, uncertainties, contingencies and other important factors which are difficult or impossible to predict and are beyond its
control. Forward–looking statements are not guarantees of future performance and such risks, uncertainties, contingencies and other important factors could cause the actual results of operations, financial condition and liquidity of
BW LPG or the industry to differ materially from those results expressed or implied in this presentation by such forward–looking statements. No representation is made that any of these forward–looking statements or forecasts will
come to pass or that any forecast result will be achieved and you are cautioned not to place any undue influence on any forward–looking statement.

No representation, warranty or undertaking, express or implied, is made by BW LPG, its affiliates or representatives as to, and no reliance should be placed on, the fairness, accuracy, completeness or correctness of the
information or the opinions contained herein, for any purpose whatsoever. Neither BW LPG nor any of its affiliates or representatives shall have any responsibility or liability whatsoever (for negligence or otherwise) for any loss
whatsoever and howsoever arising from any use of this presentation or its contents or otherwise arising in connection with this presentation. All information in this presentation is subject to updating, revision, verification,
correction, completion, amendment and may change materially and without notice. In giving this presentation, none of BW LPG, its affiliates or representatives undertakes any obligation to provide the recipient with access to any
additional information or to update this presentation or any information or to correct any inaccuracies in any such information. The information contained in this presentation should be considered in the context of the
circumstances prevailing at the time and has not been, and will not be, updated to reflect material developments which may occur after the date of the presentation.

The contents of this presentation are not to be construed as legal, business, investment or tax advice. Each recipient should consult its own legal, business, investment or tax adviser as to legal, business, investment or tax
advice. By attending this presentation you acknowledge that you will be solely responsible for your own assessment of the market and the market position of BW LPG and that you will conduct your own analysis and be solely
responsible for forming your own view on the potential future performance of the business of BW LPG. This presentation must be read in conjunction with the recent financial information and the disclosures therein.

This presentation and the information contained herein are not an offer of securities for sale in the United States and are not for publication or distribution to persons in the United States (within the meaning of Regulation S under
the U.S. Securities Act of 1933, as amended (the “Securities Act”)). The securities referred to herein have not been and will not be registered under the Securities Act and may not be offered or sold in the United States except
pursuant to an exemption from the registration requirements of the Securities Act. Any failure to comply with this restriction may constitute a violation of United States securities laws. BW LPG has not registered and does not
intend to register its securities in the United States or to conduct a public offering of shares in the United States. Copies of this presentation are not being made and may not be distributed or sent, directly or indirectly, in or into the
United States, Canada, Australia or Japan, or any other jurisdiction in which such distribution would be unlawful or would require registration or other measures.

In any EEA Member State other than Norway that has implemented Directive 2003/71/EC (as amended, together with any applicable implementing measures in any Member State, the “Prospectus Directive”), this presentation is
only addressed to and is only directed at qualified investors in that Member State within the meaning of the Prospectus Directive.

For the UK based investors–This presentation is only being distributed to and is only directed at persons in the United Kingdom that are (i) investment professionals falling within Article 19(5) of the Financial Services and Markets
Act 2000 (Financial Promotion) Order 2005, as amended (the “Order”) or (ii) high net worth entities, and other persons to whom this presentation may lawfully be communicated, falling within Article 49(2)(a) to (d) of the Order (all
such persons together being referred to as “relevant persons”). This presentation must not be acted on or relied on by persons who are not relevant persons. Any investment or investment activity to which this presentation relates
is available only to relevant persons and will be engaged in only with relevant persons.

                                                                                                                                                                        2      18 May 2021       Q1 2021 Results    Aspire Towards a Better World
Earnings Presentation - BW LPG
Agenda

                                                                    1. Highlights

                                                                    2. Market

                                                                    3. Performance

                                                                    4. Summary & Outlook

                                                                    5. Q & A

3   18 May 2021   Q1 2021 Results   Aspire Towards a Better World
Earnings Presentation - BW LPG
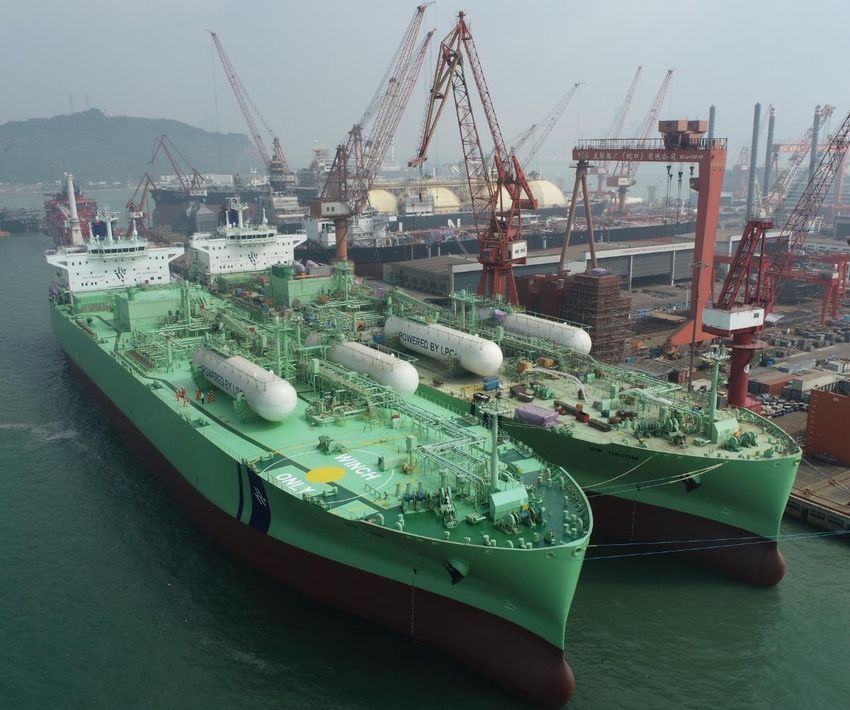
Our 15 LPG retrofits – 1 million tons of CO2 saved!

            First-mover                           Decarbonise                       Investment Potential
    ▪ BW LPG with four VLGCs on            ▪ Newbuilds produce 35x more             ▪ Over half of VLGCs and 7,500 ships
      water, three at the yard, total 15     carbon emissions than retrofits with     can be retrofitted with LPG dual fuel
      committed for retrofitting             the same technology                      propulsion engine

    ▪ The sector’s largest investment to   ▪ Our retrofit program saves 1 million   ▪ We have the expertise to serve and
      decarbonise at USD 130M                tons in CO2 emissions                    facilitate LPG as global marine fuel

Current industry’s VLGC orderbook will add 4.4 million tons in CO2 emissions
                                                                         4
Earnings Presentation - BW LPG
Highlights and Outlook
       Commercial Performance                                         Financial Performance                                               Dividends
     $44,400                     97%                               $71M                    $0.51                              $0.18                             $25M
  TCE per available day    Commercial utilisation              Net profit after tax    Earnings per share                 Dividend per share                        Total

     $43,300                                                      $330M                     42%
  TCE per calendar day                                          Available liquidity     Net leverage ratio

                Highlights and Subsequent Events                                                                          Outlook

▪ Strong operations and further strengthening of the balance sheet                    ▪ We remain positive on the 2021 VLGC freight market. This is
▪ Concluded the sale and delivery of BW Empress in April – generating                   supported by:
  USD 40 million in liquidity and a net gain of USD 10 million                          ▪ The recovery of US LPG production and exports after the cold winter. A
                                                                                          gradual recovery in the Middle East LPG exports
▪ Expanded our presence in India with five vessels now trading on time
                                                                                        ▪ Inefficiencies mainly related to dry docking and Panama Canal transit delays
  charter contracts in India, increasing our ownership in the Indian joint
                                                                                          will continue to offset fleet supply growth
  venture from 50% to 85%.
                                                                                      ▪ Demand for LPG continues to remain very strong, supported by
  ▪ Subsequently, this Indian subsidiary has secured a five-year term loan for up
    to USD 198 million from a syndication of seven banks at an all-in cost of
                                                                                        stable retail demand and growing petrochemical demand
    LIBOR plus 1.98%                                                                  ▪ We remain optimistic for 2022 and 2023, but further newbuild orders
                                                                                        would put downward pressure on freight rates, especially in 2023

                                                                                                                      5     18 May 2021   Q1 2021 Results   Aspire Towards a Better World
Earnings Presentation - BW LPG
Key Financials
Continuing our track record of delivering best in class returns with 22% return on equity

                                                                                                            Q1 2021              Q1 2020
VLGC Daily TCE1                                                                                              $43,300              $42,300
VLGC Daily OPEX2                                                                                              $7,800                $7,900
TCE income (in USD million)                                                                                      $150                  $162
EBITDA (in USD million)                                                                                          $113                  $126
Profit after tax (in USD million)                                                                                  $71                  $81

EPS3                                                                                                            $0.51                 $0.58
Operating cash flow (in USD million)                                                                             $156                  $150
Free cash flow4 (in USD million)                                                                                   $96                 $135

Earnings Yield5 (Annualised)                                                                                      30%                  77%

ROE6 (Annualised)                                                                                                 22%                  28%

ROCE6 (Annualised)                                                                                                14%                  15%

EBITDA Margin7                                                                                                    75%                  78%

Net leverage ratio8                                                                                               42%                  49%

1.TCE rates per day presented above are inclusive of both commercial waiting and technical offhire days (i.e. 100% of calendar days)
2.Prior period includes LGC in the fleet.
3.EPS (earnings per share) is computed based on the weighted average number of shares outstanding less treasury shares during the period
4.Free cash flow is computed as operating cash flow less capital expenditures during the period
5.Earnings yield is computed as EPS divided by the share price at the end of the period in USD terms
6.ROE (return on equity) and ROCE (return on capital employed) is computed based on the average equity and capital employed at the end and beginning of the period
7.EBITDA Margin is computed as EBITDA over TCE Income                                                                                                                6   18 May 2021   Q1 2021 Results   Aspire Towards a Better World
8.Net leverage ratio is computed as total debt less cash over total debt less cash plus equity
Earnings Presentation - BW LPG
Market

7   18 May 2021   Q1 2021 Results   Aspire Towards a Better World
Earnings Presentation - BW LPG
VLGC Market Outlook
Continue to hold a positive view for the medium term VLGC market, driven by shipping inefficiencies

                                                 LPG Supply                           LPG Demand                                        Fleet Capacity                                       Freight Rates

                                          US: Production and exports have       Retail: Recent lock-down in India                Inefficiencies continue to reduce                     We have fixed approximately 80%
          Short term
                        (ROY 2021)

                                          recovered from the extreme cold       may trigger increase in import                   fleet supply:                                         of our Q2 available fleet days at an
                                          weather disruption                                                                                                                           average rate of ~USD 28,000 per
                                                                                Petrochemical: LPG price                         ▪ Delays in Panama Canal
                                                                                                                                                                                       day (discharge to discharge basis1)
                                          Middle East: OPEC+ will gradually     competitiveness versus Naphtha
                                                                                                                                 ▪ Heavy drydock schedule
                                          increase oil production from May      has improved                                                                                           We expect rates to remain healthy
                                          onwards. Saudi Arabia will                                                                                                                   for H2 2021, but volatility remains
                                                                                PDH: Margin has recovered
                                          progressively remove its additional
                                                                                towards the end of January and
                                          production cuts
                                                                                has since remained high
                        (2022 and 2023)
          Medium term

                                          US: In 2022, we expect LPG            Retail: Continued strong and stable              Newbuild orderbook at 20%, and                        Despite the current orderbook, we
                                          inventory to be above the 5-year      end user demand                                  heavy delivery schedule in 2023                       continue to be optimistic for 2022
                                          average and LPG exports to fully                                                                                                             and 2023
                                                                                Petrochemical: Remains a swing                   Potentially offset by:
                                          recover to pre-COVID levels with a
                                                                                factor, but additional demand is                                                                       Current orderbook can be absorbed
                                          normalised growth rate thereafter                                                      ▪ Reduction in vessel speed and
                                                                                expected to be added as                                                                                by recovery from US and Middle
                                                                                                                                   potential scrapping driven by
                                          Middle East: OPEC+ production         new/expansion projects complete                                                                        East, and shipping inefficiencies
                                                                                                                                   tightening emission controls
                                          cuts continue to ease as oil demand
                                                                                PDH: New PDH developments                                                                              But more newbuild orders would
                                          recovers. Further growth is                                                            ▪ Continued Panama Canal
                                                                                especially in China through 2025                                                                       certainly put downward pressure on
                                          expected when expansion projects                                                         inefficiencies
                                                                                                                                                                                       freight rates, especially in 2023
                                          come onstream

                                                                                                                                                                     8   18 May 2021        Q1 2021 Results   Aspire Towards a Better World
1. For   financial reporting purposes, voyages are accounted for on a load to discharge basis in accordance with International Financial Reporting Standards
Q1 2021 Seaborne LPG Trade Overview
Chinese imports have recovered, while Indian imports continue to grow

    Q1 2021 seaborne LPG exports by country/region                                    Q1 2021 seaborne LPG imports by country/region

    14                                                                                 6
                  12.4
    12     10.9                                                                                  4.8
                                                                                       5                     4.5
                          9.2                                                              4.1
    10                                                                                                 3.9
                                8.5                                                    4                                                                             3.7
     8                                                                                                              2.9 2.9                                                2.9
                                                                                       3
     6                                                                                                                                  2.3          2.2
                                                                                                                                  2.0
                                                                                       2                                                                   1.7
     4
                                            2.4
                                                  1.8       1.7
     2                                                            1.3    1.0           1
                                                                               0.8
     0                                                                                 0
         North America   Middle East        Europe      Mediterranean   West Africa         China       India       Japan       Southeast         South Korea        Europe
                                                                                                                                  Asia
                                      Q1 2020     Q1 2021                                                          Q1 2020      Q1 2021

    ▪ Exports from all major exporters fell in Q1 2021 except for                     ▪ China LPG imports have recovered and increased by 18%
      North America                                                                     year over year to 4.8 MT
    ▪ North America LPG exports increased by 14% y-o-y to 12.4                        ▪ Retail demand into India continues to grow, India LPG imports
      MT. At the end of January, US LPG production was disrupted                        have increased by 15% y-o-y to 4.5 MT, the highest quarterly
      due to the extreme cold freeze, and this will have a lagged                       imports in history
      impact on Q2 exports
                                                                                      ▪ Europe LPG imports decreased by 21% y-o-y to 2.9 MT
    ▪ Middle East LPG exports declined by 7% y-o-y due to
      OPEC+ cuts. Exports from Saudi Arabia fell by 41% due to
      additional production cuts                                                                                    9     18 May 2021         Q1 2021 Results    Aspire Towards a Better World
US LPG Net Exports
EIA estimates US LPG exports to remain at high levels in 2021 and 2022

                                                                                                             US LPG snapshot
                                100                                                          US Production            US Domestic Consumption                 Net Exports

                                 80
            Million tons (MT)

                                                                                                                                                               37                         46                 47                        47
                                                                                                                                      30
                                 60
                                                               18                    23                       27
                                                12
                                                                                                                                                                                   90                   90                     93
                                                                                                                                                       87
                                 40                                                                                           78
                                                       66                    68                      70
                                        60
                                                44             46                    45                                               47                       48                         44                 44                        44
                                 20                                                                           43

                                  0
                                         2014           2015                      2016                  2017                       2018                     2019                   2020            2021 Forecast        2022 Forecast

                                                     Item / Year                      2019                                          2020                                       2021E                                2022E
                                      US LPG Production Growth                      10.8%                                          3.3%                                            0.5%                              3.0%
                                      US LPG Domestic Demand                         0.7%                                          -8.2%                                           0.7%                             -0.6%
                                      US LPG Net Export Growth                      21.6%                                          25.1%                                           0.6%                              1.8%

Source: EIA Short-term Energy Outlook May Release                                                                                                                                       10     18 May 2021   Q1 2021 Results        Aspire Towards a Better World
1. Net exports includes land and waterborne. Land means LPG transported via pipeline, train, rail, trucks etc., waterborne refers to LPG transported by all vessel types on sea.
VLGC Fleet Profile
Orderbook at 20%

                    Global VLGC fleet profile — average age of 10 years                                                  BW LPG VLGC market share3 of 15%
                        Delivered VLGCs                 Recycled VLGCs                   VLGCs on orderbook                          Other VLGC NB
                        Recycling candidates            VLGC count at year end
 50                                                                                                    362        400
                                                                                           320   336                                                   62
                                                                                    303
                                                                       265    282
                                                        241   260                                                 300
 40                                                                                                                       BW LPG
                                                  199                                                                     VLGC Fleet
                                  156     164                                                                     200
                   141     143
 30
  Number of VLGC

                                                                                                                  100                     45
                                                        44
 20
                                                  35
                                                                                                        30        0
                                                               21                   21      14
 10                                                                                               18
                                                                              17                                  -100                              263
                                  13                                    10
                                           8                                                                             Third party VLGC
                    3        2
                                                                                            5
  0                                                                                                               -200
                                                                                                                             fleet on water

-10                                                                                                               -300
                   2011 2012 2013 2014 2015 2016 2017 2018 2019 2020 2021 2022 2023

             36 9 45
Source: BW LPG analysis, Clarksons
                                        Owned1
                                        vessels
                                                                    TC-in
                                                                    vessels
                                                                                                       Vessels
                                                                                                       in fleet                   15 Vessels to be retrofitted with dual-fuel propulsion technology

1. Owned VLGCs includes 5 vessels owned via a Joint Venture
2. Data as of 30 April 2021
3. Market share based on ships on water                                                                                                  11     18 May 2021       Q1 2021 Results    Aspire Towards a Better World
Performance

12   18 May 2021   Q1 2021 Results   Aspire Towards a Better World
Commercial – Q1 2021 Performance
Achieved 97% commercial utilisation in Q1; generated TCE revenue of USD 44,400 per available day

                        TCE by calendar days                                                                                                    TCE by available days
                           $43,300/ day1                                                                                                           $44,400/ day2

                                                                                                                                                   64%                                         Spot
                                                                                                                                                                                               $51,5003
                                                                                                                                                                                               (excl. waiting time)

                                                                                                                                                                                               $48,9002
                                                                                                                                                                                               (incl. waiting time)

                                                      97%
                                            Available days
                                                                                                                                                                                               Time Charter
                                                                                                                                                                                               $35,200
                                                                                                                                                                   33%

                                                                                                                                                                            Waiting
                                                                                                                                                                            Waiting
Technical Offhire                                      3%
                                                                                                                                                                            3%
                                                                                                                                                                   Commercial Utilisation4
1. TCE   rates per day are inclusive of both commercial waiting and technical offhire days (i.e. 100% of calendar days)                                            97%
2. TCE   rates per day are inclusive of commercial waiting days and exclusive of technical offhire days (i.e. 100% of available days)
3. TCE rates per day are exclusive of both commercial waiting and technical offhire days
4. Commercial Utilisation is calculated with available days. Using calendar days (i.e. including technical offhire days), utilisation was 94%            13   18 May 2021        Q1 2021 Results     Aspire Towards a Better World
5. All calculations and ratios exclude finance lease vessels
Commercial – Time Charter Portfolio Overview
Time charter-out coverage for 2021 at 34% with an average rate of USD 33,700 per day

                                                    Time charter-out                                                                                             Time charter-in
                                            Quarterly                                                     Yearly                                         Quarterly                                                          Yearly
                          40%                                                                          34%                                                                                                           14%
                                   35%
               33%
                                             29%

                                                                                                                              16%     14%     14%
                                                       15%                                                                                               12%       12%          12%       12%       12%                             12%

                                                                  8%                                                 8%
                                                                            5%        4%
                $39       $47      $42       $34       $18       $10        $6        $5               $162          $39       $14    $14     $14        $12       $12          $12       $12       $12              $55             $49
               Q1 21     Q2 21    Q3 21     Q4 21     Q1 22     Q2 22     Q3 22     Q4 22              2021          2022     Q1 21   Q2 21   Q3 21      Q4 21     Q1 22    Q2 22        Q3 22      Q4 22            2021           2022

                      Revenue in USD millions                % of total available days of the whole fleet                         Cost in USD millions                % of total available days of the whole fleet

                          Time charter rate (USD thousands / day)                                                                                      Net time charter position
                                             Quarterly                                                  Yearly
                                                                                                      Yearly                                                       2021                                               2022

              $35.2                                                                                                                                   % of total            Revenue/                  % of total              Revenue/
                         $33.7              $33.2
                                                      $33.9                                                                                            fleet1                (Cost)                    fleet1                  (Cost)
                                  $32.6                         $32.2               $32.4               $33.7
                                                                          $31.9                                      $32.9
                                                                                                                             TC out                      34%                    $162m                       8%                   $39m

              $26.1      $26.1    $26.1
                                            $27.0     $27.0     $27.0     $27.0     $27.0                                    TC in                       14%                    ($55m)                      12%                 ($49m)
                                                                                                        $26.3        $27.0
                                                                                                                             Net position                                       $107m                                           ($10m)
               Q1 21     Q2 21    Q3 21     Q4 21     Q1 22     Q2 22     Q3 22     Q4 22                2021        2022

                      Avg. TC out rate                      Avg. TC in rate

1. Data  as of 31 Mar 2021
2. 2%   of fleet ratio is basis: TC out is based on total available days and TC in is based on total calendar days                                                         14         18 May 2021         Q1 2021 Results      Aspire Towards a Better World
Technical – Q1 2021 Performance

        Pioneering LPG propulsion engine retrofitting                                                                Limited impact from COVID-19                                               Safe and reliable operations
  ▪ First four LPG retrofits successfully completed; 11 retrofits                                                  ▪ Emotional and financial support provided to                            ▪ Flawless cargo operations - 311 port calls
    remain in 2021 and 2022                                                                                          crew onboard and at home                                                 and canal transits in Q1 2021
  ▪ Three vessels are currently at Yu Lian Shipyard undergoing                                                     ▪ Crew changes are still delayed, but                                    ▪ 5,000 cbm Epic St. Martin chartered to
    LPG retrofits                                                                                                    situation improved in Q1 with 600 crew                                   provide collection, storage and re-supply of
  ▪ BW Gemini has now been running six months without                                                                movements                                                                coolant and LPG fuel for dockings and
    bunkering fuel oil, saving considerable voyage time                                                                                                                                       conversions of vessels undergoing retrofitting
  ▪ World’s first ship to ship bunkering of LPG fuel is planned to be
    completed in the next few days

             Projected fleet capital expenditures (capex)1                                                                                                      Fuel price differentials between LPG and other fuels
                                                                    2021                    2022                   Total                                                Heavy fuel - Propane                 Compliant fuel - Propane
                                                                                                                                                                 200                                                                                 142
 Maintenance capex                                                 $29m                    $19m                    $48m                                          150                                                                          98
                                                                                                                                                                 100

                                                                                                                                           USD per Metric ton
 Upgrade capex2                                                    $89m                    $32m                   $121m                                           50
                                                                                                                                                                   0
 Total capex                                                       $118m                   $51m                   $169m                                          -50
                                                                                                                                                                -100
 Capex paid as at 31 Mar 2021                                     ($51m)                   ($8m)                  ($59m)
                                                                                                                                                                -150
                                                                                                                                                                -200
 Remaining capex to be paid                                        $67m                    $43m                   $110m

1. As at 31 March 2021
2. Upgrade   capex includes the retrofitting of dual-fuel LPG propulsion engines and other upgrades
3. Fuel price differentials sources: Platts, Bloomberg as at 20 April 2021. LPG fuel prices: US Mont Belvieu spot price for LPG + terminal fee of USD 26/ton.
4. Heavy fuel and Compliant fuel prices: Historical fuel price - Panama historical prices+ USD 15/ton delivery cost. Future fuel oil price - Bloomberg fair value price for US Gulf    15      18 May 2021      Q1 2021 Results   Aspire Towards a Better World
   Coast + USD 15/ton delivery fee + USD 30 price premium as an estimate of Panama delivered cost
Financial – Income Statement
Income statement (Figures in USD thousands)                                  Q1 2021               Q1 2020

Net income from spot voyages                                                      111,093              140,254
Net income from time charter voyages                                               38,993               21,703
TCE income                                                                        150,086              161,957

Net (loss)/gain from commodity contracts                                           (2,421)                 528
Fair value gains from equity financial asset                                         2,773                   -
Vessel operating expenses                                                         (22,818)            (26,421)
Time charter contracts (non-lease components)                                      (3,537)             (3,214)
General and administrative expenses                                                (9,487)             (6,172)
Charter hire expenses                                                              (2,955)             (1,907)
Finance lease income                                                                   334                 558
Other operating income – net                                                           650                 998
Operating profit before depreciation, amortisation and impairment (EBITDA)        112,625             126,327

Depreciation charge                                                               (36,043)            (38,139)
Amortisation of intangible assets                                                    (123)                 (13)
Gain on disposal of vessels                                                          1,638                    -
Gain on disposal of assets held-for-sale                                                 -               5,273
Operating profit (EBIT)                                                             78,097              93,448

Finance expense – net                                                              (8,589)            (13,735)
Share of profit of a joint venture                                                   2,031               1,213
Profit before tax for the financial period                                         71,539               80,926

Income tax expense                                                                  (370)                (321)
Profit after tax for the financial period (NPAT)                                   71,169               80,605

                                                                                                                                    16
                                                                             16     18 May 2021   Q1 2021 Results   Aspire Towards a Better World
Financial – Balance Sheet and Cash Flows
Balance sheet (Figures in USD thousands)                     31 March 2021     31 December 2020
Vessels and dry docking                                            1,699,865                  1,754,338
Other non–current assets                                             162,492                    287,589
Total current assets                                                 551,016                    374,704
Total assets                                                       2,413,373                  2,416,631

Total shareholders’ equity                                         1,301,855                  1,251,570
Total non–current liabilities                                        860,365                    908,283
Total current liabilities                                            251,153                    256,778
Total liabilities                                                  1,111,518                  1,165,061
Total equity and liabilities                                       2,413,373                  2,416,631

Cash flows (Figures in USD thousands)                             Q1 2021                    Q1 2020
Cash flows from operating activities
Profit before tax for financial period                               71,539                        80,926
Adjustments and changes in working capital                           84,875                        69,192

Net cash provided by operating activities                           156,414                      150,118

Net cash (used in)/provided by investing activities                 (41,048)                       27,107

Net cash used in financing activities                              (101,265)                    (92,054)

Net increase in cash and cash equivalents                            14,101                        85,171
Cash and cash equivalents at beginning of financial period           56,356                        93,525
Cash and cash equivalents at end of financial period                 70,457                      178,696

                                                                          17   18 May 2021   Q1 2021 Results   Aspire Towards a Better World
Financial – Highlights
Net leverage ratio down to its lowest level in five years at 42% with the highest available liquidity to-date of USD 330 million

                                                                  Net profit after tax                                                                                                             EBITDA
                                400
                                                                      326                                                                                               500
                                300                                                                           274
                                                          256                                                         244                                               400
                                200
                                                                                                                                                                        300

                                                                                                                                                         USD millions
                                              126
                 USD millions

                                100                                                                                           71
                                                                                                                                                                        200                 430                                     399          414
                                                                                   24
                                                                                                      (72)                                                                           340
                                                                                              (45)
                                    0
                                                                                                                                                                        100                        210
                                                                                                                                                                              136                           126         104                                113
                                (100)
                                           2013           2014        2015        2016        2017    2018    2019    2020   YTD                                          0
                                                                                                                             2021                                             2013   2014   2015   2016    2017         2018       2019          2020 YTD 2021

                                        Available liquidity and net leverage ratio                                                                                              FY2021 Operating Cash Breakeven
                        400                                                                                                  60%
                                                                            54%         54%     55%
                                                                                                        50%

                                                                                                                                    Net Leverage Ratio
                        300                                                 245                                        260   50%                                                                                                                   USD/day
         USD millions

                                                                                                        200     230
                                        150                                             210
                        200                                     143                                            44%           40%                         Owned fleet – operating cash breakeven1                                                       20,300
                                        34%
                                                                                                165                    42%
                                                    125         40%
                                                    30%                                                                                                  Total fleet – operating cash breakeven1                                                       22,300
                        100                                                                                                  30%
                                        111
                                                    70           94         81          57       50
                                                                                                        94
                                                                                                                56      70                               All in cash breakeven2                                                                        28,000
                                0                                                                                            20%
                                        2013    2014        2015        2016        2017       2018    2019    2020   YTD
                                                                                                                     2021
                                                    Cash               Undrawn Facility               Net Leverage Ratio

1.Cash breakeven = Total cash costs (excluding capex) / Available days owned fleet or total fleet                                                                                                  18     18 May 2021          Q1 2021 Results      Aspire Towards a Better World
2.All in cash breakeven includes all cash costs including early loan settlements, maintenance capex, and the equity portion of fleet upgrade capex
Financial – Financing Structure and Repayment Profile
No major balloon payments in the next five years
                                   Financing structure1                                                                    Repayment profile1
                                                                                                           $280m Trade Finance Facilities - o/s $24m
                                                                                                           $290m ECA 2028 - o/s $218m
                                                                                                   250
                                                                                                           $300m Revolving credit facility (RCF) - o/s $40m
                                                                                                           $158m Term loan 2026 - o/s $89m
                                                                                                   200                                                                                       191
                                                                                                           $221m ECA 2029 - o/s $159m
                                 $280m Trade

                                                                                    USD millions
                                                                                                                                                                             163
                               Finance Facilities                                                          $400m ECA 2028 - o/s $304m
                                                                       $400m ECA                   150

                                                                                                            97       99                                             97
                                                                                                   100
                                                                                                                               73
                                                                                                                                          57          57
                                                                                                   50
                                                                        $221m ECA
                       $300m RCF
                                                                                                     0
                                                                                                           2021     2022      2023      2024         2025         2026      2027       2028 and
                                                                                                                                                                                         2029
                                         $158m   $290m ECA
                                       Term Loan                                                            Net Debt and Total Available Liquidity
                                                                                                                                                                         USD (millions)
                                                                                                    Net Debt                                                                   930
                                                                                                    Undrawn amount under revolving credit facility                             260
                                                                                                    Cash                                                                        70
                                                                                                    Total available liquidity                                                  330
As at 31 March 2021                                                                                                                             19         18 May 2021     Q1 2021 Results         Aspire Towards a Better World
1 Excludes lease liabilities, capitalised fees, and interest payable
Q&A
CEO Anders Onarheim

CFO Elaine Ong

EVP (Commercial) Niels Rigault

EVP (Technical and Operations) Pontus Berg

                                             20   18 May 2021   Q1 2021 Results   Aspire Towards a Better World
Contact Us

                                                                         Investor Relations
                                                                         investor.relations@bwlpg.com

                                                                         Telephone
                                                                         +65 6705 5588

                                                                         Ticker
                                                                         BWLPG

                                                                         Linkedin
                                                                         https://sg.linkedin.com/company/bwlpg

                                                                         Address
                                                                         10 Pasir Panjang Road
                                                                         Mapletree Business City #17-02
                                                                         Singapore 117438

21   18 May 2021   Q1 2021 Results   Aspire Towards a Better World
Appendix

22   18 May 2021   Q1 2021 Results   Aspire Towards a Better World
VLGC Charter Portfolio 2021 – 2022
Our contract coverage stands at 34% for 2021 (as of 31 March 2021)

                                                                                           Q1 2021                    Q2 2021E                    Q3 2021E       Q4 2021E                    2021E                    2022E
  Owned days                                                                                  2,930                       3,291                          3,312    3,312                      12,845                   13,140
  Time charter in days                                                                          540                         546                          551       460                        2,097                    1,825
  Total calendar days                                                                         3,470                       3,837                          3,863    3,772                      14,942                   14,965
  Offhire1                                                                                     (88)                        (372)                         (203)    (199)                       (862)                    (304)
  Total available days (Net of offhire)                                                       3,382                       3,465                          3,660    3,573                      14,080                   14,661
  Spot days (Net of offhire)                                                                  2,273                       2,076                          2,382    2,539                       9,270                   13,480
  Time charter out days (Net of offhire)                                                      1,109                       1,389                          1,278    1,034                       4,810                    1,181
  % Spot days                                                                                  67%                         60%                           65%       71%                         66%                      92%
  % TC days                                                                                    33%                         40%                           35%       29%                         34%                       8%
  TCE rates                                                                                Q1 2021                    Q2 2021E                    Q3 2021E       Q4 2021E                    2021E                    2022E
  Spot                                                                                      $48,900                           -                            -         -                            -                         -
  Time charter out                                                                          $35,200                     $33,700                     $32,600      $33,200                    $33,700                  $32,900
  VLGC TCE rate (Net of offhire)                                                            $44,400                           -                            -         -                            -                         -

  Time charter in                                                                           $26,100                     $26,100                     $26,100      $27,000                    $26,300                  $27,000

                                                                                                                                                                    23    18 May 2021   Q1 2021 Results   Aspire Towards a Better World
1.Offhire is assumed to be 3 days per year per vessel, distributed equally per quarter, during the years the vessel does not have planned dry dockings
Fleet Environmental Data
                                                     Annual Efficiency Ratio (AER)                                                                                            Energy Efficiency Operational Indicator (EEOI)
                                   9.0         8.6         8.6          8.6                                                                                                   19.0                                   18.5
       g CO2 / (tonne ⋅ nautical

                                                                                    8.3         8.3         8.3         8.3                                                                                                                       18.3

                                                                                                                                                  g CO₂ / (tonne ⋅ nautical
                                   8.5                                                                                              8.1                                       18.5              17.9     18.0
                                                           7.8          7.8                                                                                                   18.0                                                                         17.6
                                   8.0                                              7.7
                                               7.5                                              7.4         7.4         7.5         7.4                                       17.5
                                                                                                                                                                                       16.8
                 miles)

                                   7.5                                                                                                                                        17.0                                                    16.5

                                                                                                                                                           miles)
                                   7.0                                                                                                                                        16.5
                                                                                                                                                                              16.0                                            15.6
                                   6.5
                                                                                                                                                                              15.5
                                          Q2 2019 Q3 2019 Q4 2019 Q1 2020 Q2 2020 Q3 2020 Q4 2020 Q1 2021
                                                                                                                                                                              15.0
                                                           BW LPG Carbon Efficiency Ratio basis AER                                                                           14.5
                                                           Poseidon Principles' expectations - AER Trajectory                                                                 14.0
                                                                                                                                                                                      Q2 2019 Q3 2019 Q4 2019 Q1 2020 Q2 2020 Q3 2020 Q4 2020 Q1 2021

                                                              Generated Emissions                                                                                                                       Cargo Ton-miles
                                                                                                                                                                               26.0
                                                                 425.0                                                                                                                                    23.6                 23.8
                    450                                                                                                                   12                                   24.0
                                                     391.5

                                                                                                                                               Cargo million tons
                    400                                                       380.1       370.5                                                                                          21.7    21.8

                                                                                                                                                Nautical miles ⋅
                                         363.3
                                                                                                      340.6                               10                                   22.0                                  20.9              20.6
                    350                                          10.5                                             326.9       313.8
                                                     9.5                      9.3                                                                                              20.0
                    300                                                                   8.9                                             8
       1,000 tons

                                         8.7                                                                                                                                                                                                      17.9     17.8
                                                                                                      8.0         7.7                                                          18.0
                    250                                                                                                       7.4
                                                                                                                                          6
                    200                                6.5
                                           6.0                      5.8                                                                                                        16.0
                    150                                                                                                                   4
                                                                                                                                                                               14.0
                    100
                                                                                                                                          2                                    12.0
                          50
                                                                                1.5         1.2         1.1         0.8         0.8
                                   0                                                                                                      0                                    10.0
                                       Q2 2019 Q3 2019 Q4 2019 Q1 2020 Q2 2020 Q3 2020 Q4 2020 Q1 2021                                                                                 Q2 2019 Q3 2019 Q4 2019 Q1 2020 Q2 2020 Q3 2020 Q4 2020 Q1 2021

                                                           CO2     NOx (right axis)         SOx (right axis)

    1.Fleet environmental data excludes seven vessels not operated by BW LPG
    2.Emission calculations are based on methodology described in 'Guidelines for voluntary use of the ship Energy Efficiency Operational Indicator (EEOI)' (2009), IMO, and 'EMEP/EEA air pollutant emission inventory guidebook
      2016', European Environment Agency, from which the methodology of Tier III has been used. NOx factors have been adjusted by actual engine loads
                                                                                                                                                                                                                24    18 May 2021     Q1 2021 Results    Aspire Towards a Better World
Fleet Safety Statistics
Safety and Zero Harm onboard remain our key focus, especially during challenging times

                                                                       Safety Statistics
      1.40

                                                                                          TRCF 12 Month Rolling Average (MRA)                                       1.19
      1.20
                           1.09        1.09
                                                                                                                                                 1.03
                                                    0.95                                0.97                                       0.96
      1.00                                                                  0.93
                                                                                                     0.84         0.86
               0.82                                             0.82
      0.80

      0.60

                                                                                            LTIF 12 Month Rolling Average (MRA)
      0.40
               0.27        0.27        0.27

      0.20                                          0.14        0.14        0.13        0.14         0.14         0.14            0.14

                                                                                                                                                0.00               0.00
      0.00
              Apr-20      May-20      Jun-20       Jul-20     Aug-20       Sep-20      Oct-20       Nov-20       Dec-20        Jan-21           Feb-21             Mar-21

      ▪ Increase in TRCF due to a minor head injury
      Total Recordable Case Frequency (TRCF): Work-related fatalities and injuries per one million hours worked
      Lost Time Injury Frequency (LTIF): Workplace fatalities and injuries that leads to lost work time, per one million hours worked

                                                                                                                          25      18 May 2021    Q1 2021 Results     Aspire Towards a Better World
BW LPG Fleet Development

                                                                                      Timeline based on current contracts

                                                                                                                     1
                                                                                                                 5
                                 1
                                                                                                        1        1
                                 1            1
                                                                       2                                                   3
                                                                                             1                                                                                                      2
                                                                                                  1

                   36
                                                                                   32
                                                                                                                                           36                36                      36
                                                                                                                                                                                                               36

                    9                                                              10
                                                                                                                                           6                 6                       6
                                                                                                                                                                                                               4

               Dec 2019        Q1           Q2           Q3           Q4       Dec 2020           Q1            Q2         Q3     Q4    Dec 2021   2022   Dec 2022     2023      Dec 2023        2024       Dec 2024
                              2020         2020         2020         2020                        2021          2021       2021   2021

                                         Chartered-in / Bareboat fleet                                      Owned fleet                 Charter expiry                     Divested vessels

Note: The fleet timeline assumes that vessels on time charter-in will be redelivered at charter expiry
1. BW Global United LPG India’s fleet is included in the owned fleet with BW LPG’s ownership increase to 85%                                                      26   18 May 2021        Q1 2021 Results    Aspire Towards a Better World
Fleet List

                                             Modern fleet of 46 vessels built at leading shipyards (as of 31 March 2021)
            Owned VLGCs (100% Ownership)                                                                                Chartered / Bareboat VLGCs
            Name                 Year                 Shipyard            Name                 Year      Shipyard       Name                          Year        Shipyard         Charter type
                          1
            BW Mindoro                    2017         DSME               BW Pine              2011   Kawasaki S.C.     BW Yushi                      2020     Mitsubishi H.I.     Time charter
            BW Malacca 1                  2016         DSME               BW Sakura            2010   Mitsubishi H.I.   BW Kizoku                     2019     Mitsubishi H.I.     Time charter
                          1
            BW Magellan                   2016         DSME               BW Odin              2009    Hyundai H.I.     Oriental King                 2017      Hyundai H.I.       Time charter
            BW Frigg 1                    2016       Hyundai H.I.         BW Austria           2009       DSME          BW Messina                    2017         DSME            Time charter
            BW Freyja 1                   2016       Hyundai H.I.         BW Lord              2008       DSME          BW Kyoto                      2010     Mitsubishi H.I.     Time charter
                        1
            BW Volans                     2016       Hyundai H.I.         BW Thor              2008    Hyundai H.I.     Yuricosmos                    2010     Mitsubishi H.I.     Time charter
            BW Brage 1                    2016       Hyundai H.I.         BW Princess          2008    Hyundai H.I.     BW Tokyo                      2009     Mitsubishi H.I.     Time charter
                         1                2016       Hyundai H.I.         BW Tyr               2008    Hyundai H.I.     Berge Nantong                 2006      Hyundai H.I.       Time charter
            BW Tucana
            BW Var1                       2016       Hyundai H.I.         BW Loyalty           2008       DSME          Berge Ningbo                  2006      Hyundai H.I.       Time charter
            BW Njord 1                    2016       Hyundai H.I.         BW Oak               2008    Hyundai H.I.     Total 9 vessels (0.7 million CBM)
                       1
            BW Balder                     2016       Hyundai H.I.         BW Liberty           2007       DSME
                     1                    2015       Hyundai H.I          BW Prince            2007    Hyundai H.I.
            BW Orion
            BW Libra 1                    2015       Hyundai H.I          BW Confidence        2006   Mitsubishi H.I.   VLGCs in BW Global United LPG India Private Limited
                   1                                                                                                                                                                                3
            BW Leo                        2015       Hyundai H.I          BW Trader            2006       DSME          Name                          Year     Shipyard           Ownership (%)
            BW Gemini 1                   2015       Hyundai H.I.         BW Empress 2         2005   Mitsubishi H.I.   BW Birch                      2007    Hyundai H.I.           50%
            BW Carina                     2015       Hyundai H.I.                                                       BW Elm                        2007    Hyundai H.I.                50%
            BW Aries                      2014       Hyundai H.I.                                                       BW Cedar                      2007    Hyundai H.I.                50%
                                                                                                                        BW Energy                     2002   Kawasaki H.I.                50%
                                                                                                                        BW Boss                       2001   Kawasaki H.I.                50%
            Total 32 vessels (2.7 million CBM)                                                                          Total 5 vessels (0.4 million CBM)

                                                                           15
                              Vessels to be retrofitted with dual-fuel propulsion technology

1.Retrofit of dual-fuel LPG propulsion engines
2.BW Empress has been sold in April 2021                                                                                                          27    18 May 2021     Q1 2021 Results     Aspire Towards a Better World
3.The ownership in BW Global United LPG India increased to 85% after 31 March 2021
You can also read