Credit Suisse, 31st Annual Basic Materials Conference - New York, 13 September 2018 Martin Heistermann, Senior Investor Relations Manager - K+S ...
←
→
Page content transcription
If your browser does not render page correctly, please read the page content below

K+S Group

Credit Suisse, 31st Annual Basic
Materials Conference
  New York, 13 September 2018
  Martin Heistermann, Senior Investor Relations Manager
K+S Group
Disclaimer

No reliance may be placed for any purpose whatsoever on the information or opinions contained in the Presentation or on its completeness, accuracy of fairness. No
representation or warranty, express or implied, is made or given by or on behalf of the Company or any of its respective directors, officers, employees, agents or
advisers as to the accuracy, completeness or fairness of the information or opinions contained in the Presentation and no responsibility or liability is accepted by any of
them for any such information or opinions. In particular, no representation or warranty, express or implied, is given as to the achievement or reasonableness of, and no
reliance should be placed on any projections, targets, ambitions, estimates or forecasts contained in this Presentation and nothing in this Presentation is or should be
relied on as a promise or representation as to the future.

This presentation contains facts and forecasts that relate to the future development of the K+S Group and its companies. The forecasts are estimates that we have made
on the basis of all the information available to us at this moment in time. Should the assumptions underlying these forecasts prove not to be correct or should certain
risks – such as those referred to in the Annual Report – materialise, actual developments and events may deviate from current expectations. Given these risks,
uncertainties and other factors, recipients of this document are cautioned not to place undue reliance on these forecasts.

This Presentation is subject to change. In particular, certain financial results presented herein are unaudited, and may still be undergoing review by the Company’s
accountants. The Company may not notify you of changes and disclaims any obligation to update or revise any statements, in particular forward-looking statements, to
reflect future events or developments, save for the making of such disclosures as are required by the provisions of statue. Thus statements contained in this
Presentation should not be unduly relied upon and past events or performance should not be taken as a guarantee or indication of future events or performance.

This presentation has been prepared for information purposes only. It does not constitute an offer, an invitation or a recommendation to purchase or sell securities
issued by K+S Aktiengesellschaft or any company of the K+S Group in any jurisdiction.

                                                                                                                                                         K+S Group            1
Current Trading
K+S Group
Market Update
MOP vs SOP Price Development (Source: FMB)
Market
USD/t EUR/t
Good demand across all regions prevailing
600 600
In H1 imports to China up 14%, to India
SOP Europe
20%, and to Brazil on last year’s high level
Potash
500 500
400 400 Many producers are sold out towards the
end of the year
300
MOP Brazil
300
Recovery of MOP prices continued
200 200 Specialty-prices remain strong
20142014 2015
2015 2016
2016 2017
2017 2018 2018
De-icing
Increase in demand both in NA and EU
Biddings underway, supportive indications
for next season
Salt
Non de-icing
Greater share of lower yielding industrial
salt products
*Biddings regionally by percentage of completion Negative FX impact
K+S Group 3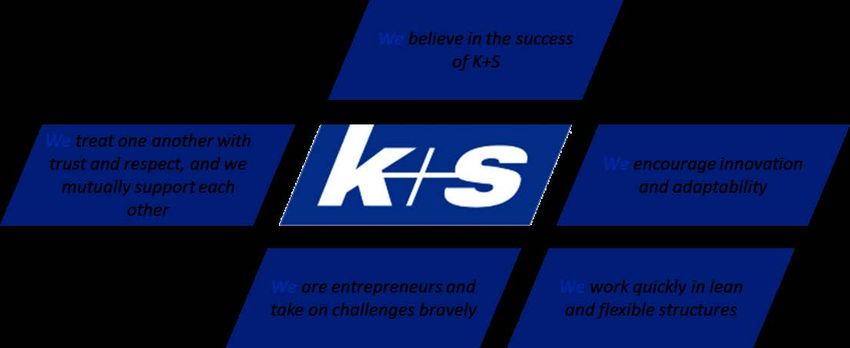
K+S Group
    A Few Challenges Remain – Solutions on Their Way

              VARIOUS ONE-TIME ISSUES                                                      Caking

              Strike rail-workers, several short shutdows

                                                                          Hardness gran.

PRODUCT QUALITY
• High K2O content
• Hardness granulated product
• Caking issues (standard and granular)
   • Finetuning additives
                                                        One-time issues                             GUIDANCE
   • Grinder pump (beg. 2019)
                                                                                                    • Production 2018:
   • Cooling equipment (end 2019)
                                                                                                      1.4 to 1.5 million tons
                                                                                                    • D&A 10 to 15 million Euros/month
                                                                                                    • Positive EBITDA in 2018
                                                                                                    • EBIT break even in 2019
                                                                                                    • Begin Secondary Mining in 2019
                                                                                                      with 100 to 200K tons

                                - First greenfield mine in Sakskatchewan in 40 years -
                        - Going through a lot of “firsts” and we are learning how to adapt -
                              - Well experienced and highly motivated staff in place -
                                                                                                                      K+S Group   4
K+S Group
Production Issues - Germany
Werra: 100kt of lost production in Q2/18 (again)
Lack of staff / Illness rate: open vacancies, high illness, lack of motivation
Achievements so far: management changed, vacancies partly filled, illness rate halved
Further measures: qualifying new staff, filling remaining vacancies,
moving workers from SI, to be resolved by end of 2018
Machinery/Equipment: extensive maintenance breaks led to downtimes in production
Countermeasure: prioritized maintenance and replacement
-> ongoing improvement, 50% to be fixed by end of 2018
Extraordinary low nutrient content (K2O): Crossing field with lower content
at Unterbreizbach (UB)
-> Effect resolved by the end of 2019
Neuhof: 50Kt of lost production in Q2/18
Geology issue: low roof stability -> additional safety measures needed
Countermeasures: new production technologies to be installed (by end Q3 2018)
K+S Group 5
K+S Group
Nutrient content in Germany is diminishing
In Germany we operate mature potash mines
Nutrient content (K2O) is diminishing
Overall impact 2018: 100Kt of product (annualized)
Countermeasures: Operational Excellence (OpsEx)
Starting Operational Excellence program with a consultant
Site-by-site investigation with management and consultants
We have identified many opportunities to increase efficiency across all sites
Start of implementation in 2019 to stabilize current production in Germany
K+S Group 6
K+S Group
Expected development of our Potash Production
Expected production 2018:
Germany: 6.4 to 6.5mt
Bethune: 1.4 to 1.5mt 7.9 to 8.1mt
Huludao 0.1mt
Expected Production 2019:
Germany: 6.4 to 6.5mt
Sigmundshall - 0.6mt
K2O-Content - 0.1mt
Improvement against 2018 + 0.3mt 7.9 to 8.2mt
KCF + 0.1mt
6.1 to 6.2 mt
Bethune: 1.7 to 1.9mt
Huludao 0.1mt
=> OpsEx Program to compensate declining nutrient content after 2020
K+S Group 7
Shaping 2030 Strategy

K+S Group
Our vision for 2030

We will be the most customer-focused,   'One Company'
independent minerals company and grow   ... thinking and acting as 'One Company' and
our EBITDA to €3bn in 2030 by ...       realizing synergies between our businesses

                                        Tapping the full potential of our
                                        existing assets
                                        ... and establish the most value-creating portfolio
                                        combination

                                        Exploring new adjacent growth areas
     Agriculture   Industry             ... pursuing growth by venturing into new markets
                                        where we can use our existing capabilities
    Communities    Consumers

                                        Increasing the share of our specialties
                                        business
                                        ... to ensure an overall stabilized performance and
                                        reduce our dependency on standard products and
                                        weather

                                                                                K+S Group     9
K+S Group
We will implement our strategy in two phases
Phase 1: Transformation Phase 2: Growth
2017 2020 2030
Reduce indebtedness Tapping the full potential of our
existing assets
Realize synergies Exploring new adjacent growth areas
Advance corporate culture Increased share of specialties
Shaping the organization
and focusing towards our clients
Net debt/ halved Investment grade rating EBITDA-Ambition €3bn
EBITDA vs. H1/2017 achieved in 2023
ROCE > 15%
Synergies > €150m Revenue growth
> 4%
beyond 2030
K+S Group 10Phase I
K+S Group
Phase I: Building a basis for our growth options

Divisional Silos                                        Matrix
                                                                                        Board of Executive Directors
                                                                                                       Matrix
                                                                    COO Group                        CEO Group                          CFO Group

    Board of Executive Directors                             Head of Human           Head of Corporate      Head of Corporate      Head of Corporate
                                                               Resources               Development             Controlling         Communications

                                                                                                                        CEO Europe &
                                                                                 CEO Americas
                                                                                                                         Agriculture
                                          Agriculture   Industry

                                         Communities    Consumers

                                                                                                 Head of Marketing,
                                                                                                Sales & Supply Chain
                                                                                                                                   Agriculture
                                                                                                     Excellence
                                                                                                                                       Industries
                                    Customer                                                      Marketing & Sales
                                    Segments                                                        Committee                      Consumers
                                                                                                                                Communities

                                                                                                Head of Operations
                                   Operations                                                      Excellence

                                                                                                Operations Excellence
                                                                                                    Committee

                                                                    Operating Unit        Function        Executive Committee

                                                                                                                                       K+S Group    12
K+S Group
Change of management culture
Bring management and employees closer
together by…
Implementing Town Hall Meetings and
Board meetings on site
Pushing internal communication channels
Our principles of cooperation
”Innovation can‘t just be triggered by the Board and also not from those who work in corporate
development – It has to come from the basis!”
K+S Group 13K+S Group
Synergies: Breakdown by program
SHAPING
2030 Sponsor Net synergies YE 2020
(vs. 2017)
SG&A Optimization CEO ~ €30m
Operations COO > €50m
Lift Procurement CFO > €30m
synergies
Supply Chain and Logistics COO > €20m
Commercial Excellence COO > €20m
∑ > €150m
K+S Group 14K+S Group
SG&A Optimization
Overall, about 50 SG&A initiatives were defined
leading to a good 10% headcount and cost
reduction (~ €30m)
Our Strategy Committee and Supervisory Board
have approved our SG&A initiatives
The implementation will start in October 2018
main focus on bundling and merging of
business activities
K+S Group 15K+S Group
Closing central functions in Hanover
Merging administrative, logistics and production functions in the new customer
segments Industry and Consumer in the Europe and Agriculture operating unit
Headquarters in Hanover office will be closed
Communities: Active customer support for
the Community business remains
Hanover
Central bundling of business activities,
including Logistics, Controlling, Production,
Order Processing by K+S Kali, esco and Waste Industry: Merging with existing activities
Management into the OU Europe and Kassel administrative functions in Kassel
Agriculture
Consumers: Centralizing brand development
and marketing activities across Europe
Agriculture: Not affected by relocation
Bundling of strengths in order to boost customer orientation
K+S Group 16K+S Group
Examples Operations – Increase wrench time
Key to efficient
execution of work is
increasing wrench time
based on activities that
eliminate time wastage
K+S Group 17K+S Group
Examples Procurement
Examples
Mobile Mining Equipment Valves Bearings
Multi-year bundling approach Qualify alternative suppliers Optimized manufacturer portfolio
Representing potential savings of Standardize product portfolio Savings potential up to
€2-4m Savings of > €200k/year €1.1m/year
K+S Group 18K+S Group
Examples Supply Chain and Logistics
Some Key Examples
New Transport Management System: Implementing a new TMS and outsourcing
certain parts of the order processing (i.e. carrier allocation) ensures higher route
guide compliance and improved customer service
Distribution Network Optimization: Consistent utilization of robust modeling tool to
identify and subsequently implement low-cost warehouse network
Supply Chain Planning: Improve maturity level and consistent application of the
S&OP process
Tender Process EU: Optimize and standardize truck tendering process
K+S Group 19K+S Group
Examples Commercial Excellence
Some Key Examples
Pricing & Margin Management: Revisit pricing strategies, improve pricing
tools, and explore price potential
Market & Customer Insights: Explore white spaces / untapped market
potential across K+S
Lead & Opp. Management: Better & consistent use of CRM system to
identify, pursue and win “non-customers”
Market Strategy: Review existing market segment strategies
K+S Group 20K+S Group
Shaping 2030 EBITDA impact
Costs Synergies > €150m
2018e 2019e 2020e
Total costs for synergy program: ~ €150m (2020 year end)
K+S Group 21K+S Group
Net Present Value (NPV) Bethune (1)
We have updated our valuation for Bethune
Current purchase conditions for gas reflected
Modified ramp-up curve taken into consideration
Assumptions
WACC (before taxes) = 8.5%
USD/EUR = 1.15
EUR/CAD = 1.55
View on the 2019 - 2070 period
MOP gran. Brazil: 2019 - 23 = 330-370 USD/t
K+S Group 22K+S Group
Net Present Value (NPV) Bethune (2)
NPV for Bethune EUR 4.8 bn
This NPV equals an EV per share of 25 EUR
Sensitivities
Variation NPV change
MOP gran. Brazil +/- 10 USD/t +/- €200 million
“We create value for our stakeholders!”
K+S Group 23Phase II
K+S Group
Our strategy has incorporated important megatrends
8.5bn 0.2 Arable land shrinking
Global population in 2030 Average global warming (ºC)
Yield needs to be improved
Today: 7.3bn Per decade Higher efficiency of fertilization
and irrigation needed
Implications for K+S Plants have to be more stress
resistent
Infrastructure needs to be
40% 5.4bn improved focus on
of population suffer from people belong to the renewable energy
water shortage by 2030 middle-class by 2030
Growing population, especially
in Asia, needs more salt for
70% of water used 2015: 3.0bn various purposes
for agriculture
K+S Group 25K+S Group
Our steps to achieve the financial ambition
EBITDA (€ bn)
>3
~ 1.8
Existing business Realizing synergies Growth options Ambition
2030 2030
Assumptions
Forecast existing business At least €150 million Realization of organic as
based on sales growth, through realization well as inorganic growth
price development of synergies by 2020 options
(updated potash price
model), inflation,
production capacity,
environmental costs, etc.
ROCE
13% >15%
Realizing of synergies as well as organic and inorganic growth options will significantly
contribute to the closure of the gap and the achievement of the ambition!
K+S Group 26K+S Group
Growth areas and ideas cover the full growth landscape
K+S Growth Landscape
Geo-expansion Fertilizer Industry
Africa Increase of fertilizer specialties Expand Pharma & Food portfolio
Asia Ramp of low cost commodities Chemical applications
Growth areas and ideas cover core and adjacent businesses
K+S Group 27Financials
K+S Group
  Guidance 2018: EBITDA between € 660 – 740m

 € million

                                                                                                   € 660 – 740m
                                                              Main effects:
                                                              - Planning       Main effects:
                                     Main effects:              assumption:    +/- Sigmundshall
                                     + Bethune                  1.21 EUR/USD   - Production
                                     + Potash volumes                              issues
                                       (weather related)                       - Logistics costs
                                     + Tangibly higher salt                    - Bethune
       577                             volumes                                 - Shaping 2030

                   Main effects:
                   + Potash prices

      Actual             Price        Volume/Mix                Currency             Other            2018e
       2017                                                                         effects
                                                                                     (net)

             Full year guidance is not including weather-related outage days

Cash unit cost per ton (2017: 214€/t) likely to be in the range of 205-210€/t in 2018
                                                                                                       K+S Group   29
K+S Group
Housekeeping Items
Additional information on Outlook FY 20181
Tax rate: ~26-28%
Financial result: ~-110 to -120 million EUR
CapEx: below 600 million EUR
D&A (incl. Bethune): 380 to 400 million EUR
Reconciliation (EBITDA): ~-60 to -70 million EUR
FY 2018 Guidance mainly determined by:
Ramp-up at Bethune
Capacity utilization at German plants
Winter conditions in Q4
FX and potash price development
Cash unit cost per ton in PMP between 205-210€/t
1 Incl. ̴ 4mt of potassium sulphate and potash grades with lower mineral content K+S Group 30K+S Group
Extreme weather situation in Germany - Implications
May – August rainfall vs water temperature on a 5-yr comparison (Werra) Impact on K+S
In l/m2 in °C Persistent severe drought led to
250
Rainfall Average Temperature
30 production being temporarily interrupted
at some Werra sites:
25
200 Wintershall site has been shut down on
Monday, August 27
20
150
Hattorf site has been shut down on
Tuesday, September 11
15
Based on current forecasts, the
100
Unterbreizbach site can continue to
10
5yr Average produce
50
5
Additional measures for wastewater
disposal are currently being examined
0 0 Impact on EBITDA of one day of
August
August
August
August
August
June
July
June
July
June
July
June
July
June
July
May
May
May
May
May
production standstill for each site is up to
2014 2015 2016 2017 2018 € 1.5 million
Source: Wetterkontor.de
K+S Group 31K+S Group
CapEx development 2015-2020
in m€
1.200 BU Potash (ex Bethune)
Bethune
BU Salt
1.000
Complementary Activities
800
600
400
200
0
2015 2016 2017 2018e 2019e 2020e
K+S Group 32K+S Group
Moving parts Free Cash Flow 2017-2020
+ Bethune
+ Price
– Werra
– FX Significant
+ Bethune
improvement
+ Volume
-390 = Price
= FX
– Net Working Capital
Operations
CapEx
Operations
CapEx
2017
Shaping
2018e
Shaping
2020e
K+S Group 33K+S Group
Deleveraging – Development 2015-2023
8.1
7.2
6.9
5.2 Halved vs.
4.6 H1/17
2.3 Prerequisites
for IG-Rating
1.3
2015 2016 2017 2018e 2019e 2020e 2021e 2022e 2023e
Net Debt/EBITDA Net Financial Debt/EBITDA
K+S Group 34K+S sustainability KPIs and targets 2030
K+S Group
K+S sustainability KPIs and targets 2030 - People
Target until 2030 at
Goal KPI
the latest
0
Health & Safety Lost time incident rate (LTIR)
Vision 2030
PEOPLE
Diversity & Employees’ favorable perception of inclusive work
>90
Inclusion environment (percent)
Sites covered by a human rights due diligence process
Human Rights 100
(percent)
K+S Group 36K+S Group
K+S sustainability KPIs and targets 2030 - Environment
Goal KPI Target until 2030 at
the latest
Deep well injection of saline waste water in Germany
0 Starting January 2022
(m³ p.a.)
Water
Additional reduction of saline process water from -500,000 Excluding
reduction by KCF facility and end
potash production in Germany (m³ p.a.) of production SI
ENVIRONMENT
Amount of residue used for other purposes than tailings
or increased amount of raw material yield (million 3
Waste tonnes p/a)
Additional area of tailings piles covered (ha) 155
Carbon footprint for power consumed (kg CO2/MWh)
-20
(percent)
Energy & Climate
Specific greenhouse gas emissions (CO2) in logistics
-10
(percent)
K+S Group 37K+S Group
K+S sustainability KPIs and targets 2030 - Business ethics
Target until 2030 at
Goal KPI
the latest
Critical suppliers aligned with the K+S Group Supplier 100
Sustainable Supply Code of Conduct (SCOC) (percent) by end of 2025
BUSINESS ETHICS
Chains
> 90
Spend coverage of the K+S Group SCoC (percent)
by end of 2025
All employees reached by communication measures
Compliance & Anti- 100
and trained appropriately in compliance matters
Corruption by end of 2019
(percent)
K+S Group 38K+S Group
IR Contact Details
K+S Aktiengesellschaft
Bertha-von-Suttner-Str. 7
34131 Kassel (Germany)
E-mail: investor-relations@k-plus-s.com
Homepage: www.k-plus-s.com
IR-website: www.k-plus-s.com/ir
Lutz Grüten Katharina Volkmar
Head of Investor Relations Roadshow Management
Phone: +49 561 / 9301-1460 Phone: +49 561 / 9301-1100
Fax: +49 561 / 9301-2425 Fax: +49 561 / 9301-2425
lutz.grueten@k-plus-s.com katharina.volkmar@k-plus-s.com
Laura Schumbera Martin Heistermann Alexander Enge
Junior Investor Relations Manager Senior Investor Relations Manager Investor Relations Manager
Phone: +49 561 / 9301-1607 Phone: +49 561 / 9301-1403 Phone: +49 561 / 9301-1885
Fax: +49 561 / 9301-2425 Fax: +49 561 / 9301-2425 Fax: +49 561 / 9301-2425
laura.schumbera@k-plus-s.com martin.heistermann@k-plus-s.com alexander.enge@k-plus-s.com
K+S Group 39You can also read