Crisis, Response, and Recovery: The Federal Government and the Black/White Homeownership Gap
←
→
Page content transcription
If your browser does not render page correctly, please read the page content below
A TERNER CENTER REPORT - MARCH 2021

Crisis, Response, and Recovery:
The Federal Government and the
Black/White Homeownership Gap

AUTHOR:
CAROLINA K. REID, FACULTY RESEARCH ADVISOR

                  Copyright 2021 Terner Center for Housing Innovation
              For more information on the Terner Center, see our website at
                            www.ternercenter.berkeley.edu
A TERNER CENTER REPORT - MARCH 2021

Introduction                                                                Researchers have estimated that homes in
                                                                            black neighborhoods are undervalued by
Today, the median non-Hispanic White                                        an average of $48,000, amounting to $156
household holds almost $190,000 in                                          billion in cumulative losses.3
wealth—7.8 times that of the median Black
                                                                            The Biden-Harris Administration has
household ($24,100).1 While the drivers
                                                                            made racial equity one of its top priorities,
of the racial wealth gap are complex,
                                                                            recognizing     that     systemic    racism
disparities in access to homeownership,
                                                                            continues to shape contemporary access
as well as in the financial benefits that
                                                                            to opportunity.4 This attention to racial
homeownership confers, play a key role
                                                                            inequality is long overdue, and is relevant
in shaping this inequality.2 In 2018,
                                                                            to multiple policy domains, including
only 42 percent of Black households
                                                                            social and labor market policies, criminal
owned a home, compared to 73 percent
                                                                            justice, and education. Yet housing remains
of non-Hispanic White households. This
                                                                            a central axis by which racial inequality
homeownership gap is larger than it was
                                                                            is produced and sustained. Historically,
in 1968, before discrimination was legally
                                                                            the federal government has played an
outlawed, demonstrating the enduring
                                                                            outsized role in promoting policies that
effect of structural racism in housing and
                                                                            discriminate against Black households in
mortgage markets (Figure 1). Indeed, the
                                                                            housing and mortgage markets, histories
racialized history of housing policy in the
                                                                            that have been powerfully illuminated in
U.S., including racial covenants, redlining,
                                                                            books like The Color of Law by Richard
and discriminatory credit practices,
                                                                            Rothstein and Race for Profit by Keeanga-
have shaped not only who has access to
                                                                            Yamahtta Taylor, as well as in the work
homeownership, but also its returns.

Figure 1: The Black/White Homeownership Gap, 1960 - 2018

                                     35%

                                     30%
Difference Between White and Black

                                     25%
       Homeownership Rate

                                     20%

                                     15%

                                     10%

                                     5%

                                     0%
                                           1960   1970      1980              1990             2000              2010              2018

Source: Goodman, L., Zhu, J., & Pendall, P. (2017). “Are Gains in Black Homeownership History?” The Urban Institute. Retrieved from: https://
www.urban.org/urban-wire/are-gains-black-homeownership-history.

                                                                                                                                                         2
A TERNER CENTER REPORT - MARCH 2021

of Ta-Nehisi Coates in “The Case for            These failures of government
Reparations” and Nikole Hannah-Jones
in The 1619 Project.
                                               led to a deeply uneven recovery
                                                 for Black homeowners and
The last decade has thrown into sharp
relief the failures of federal public policy     communities, widening not
to repair these harms. Disparate outcomes         only the racial wealth and
for Black homeowners are not a thing of         homeownership gap, but also
the past. Despite the passage of laws like
the Fair Housing Act and the Equal Oppor-         fueling gentrification and
tunity Credit Act, the 2007-2010 foreclo-        displacement pressures in
sure crisis and the recovery that followed        some Black communities.
point vividly to the ways in which housing
and mortgage markets are still deeply
segmented by race. They also point to the      and wealth gap in the future. The
limitations of the government response         policies proposed by the Biden-Harris
to that crisis. Rather than stepping in        Administration represent an important
boldly with direct aid to homeowners, the      first step in promoting an equitable
policy response was shaped by racialized       recovery, including efforts to address
narratives of who was “deserving” of aid       the pandemic and provide immediate
and the unwavering belief that private         financial support to households and small
actors—such as mortgage servicers and          businesses. The recently passed stimulus
investors—were the best placed to provide      package, which includes critical support
aid to hard-hit borrowers and communi-         for renters and families with children, will
ties. These failures of government led to a    do a lot to mediate the worst impacts of the
deeply uneven recovery for Black home-         crisis on American families. But the goal
owners and communities, widening not           of closing the racial wealth gap is going to
only the racial wealth and homeowner-          need a broader set of federal interventions
ship gap, but also fueling gentrification      that consider and affirmatively address
and displacement pressures in some Black       the longstanding impact of discriminatory
communities.                                   government policies on Black households
The lack of an effective government            and communities.
response to the foreclosure crisis—let         This paper explores how federal policy
alone one centered on principles of racial     has helped forge and reinforce disparities
equity—holds important lessons for             in access to homeownership and wealth
federal housing policy, particularly as the    building for Black households over time.
new administration develops responses to       It considers three “chapters” of major
the economic crisis caused by the novel        economic downturns—the Great Depres-
coronavirus (COVID-19) pandemic. How           sion, the Great Recession, and now, the
the federal government chooses to protect      global COVID-19 pandemic—to show how
Black homeowners now, and whether it           the federal government’s decisions about
chooses to implement policies that ensure      whom to assist in the crisis, and how, has
equitable recovery for Black households        broad implications for who benefits from
over the coming years, will have a profound    the recovery.
impact on the racial homeownership

                                                                                                            3
A TERNER CENTER REPORT - MARCH 2021

First, The Legacy of Redlining, reviews          to rising gentrification and displacement
how the establishment of a federal housing       pressures in some neighborhoods.
finance system after the Great Depression
                                                 Third,    The      COVID-19      Pandemic,
played a significant role in promoting the
                                                 considers the current moment, and high-
expansion of homeownership after World
                                                 lights emerging evidence that Black home-
War II. However, this expansion was pred-
                                                 owners and neighborhoods may again be
icated on a set of racist beliefs that largely
                                                 disproportionately affected by the asso-
excluded Black households from federal
                                                 ciated economic downturn. Here, poli-
subsidies (for example, through Federal
                                                 cies can still make a difference. Already,
Housing Administration (FHA) mortgage
                                                 lessons learned from the foreclosure
insurance) and prohibited them from
                                                 crisis have led to promising interventions,
buying homes in suburbanizing neighbor-
                                                 such as broadly implemented mortgage
hoods. This section of the paper—which
                                                 forbearance programs. Yet the evidence
draws largely from existing scholarship—
                                                 that COVID-19 is leading to a K-shaped
is designed to anchor the subsequent
                                                 recovery suggests that there is still more to
analysis of contemporary inequalities in
                                                 do to ensure that recovery from this crisis
these past practices of racial exclusion.
                                                 is broadly shared, and that prolonged job
The disproportionate rates of subprime
                                                 losses or unsustainable debt payment
lending to Black households and neigh-
                                                 don’t lead to additional losses among
borhoods in the 2000s, for example, are
                                                 Black homeowners.
not independent from the creation of a
financial system that valued property and        The final section of the paper presents
distributed credit on the basis of race.         policy recommendations for the Biden-
Indeed, a growing number of studies point        Harris Administration, outlining the prin-
to the enduring legacy of these maps on          ciples that need to form the foundation for
contemporary racial inequality.                  starting to repair the harms of past gener-
                                                 ations and move the country to greater
Second, Uneven Recovery: Black Home-
                                                 racial equality in mortgage and housing
ownership after the Great Recession,
                                                 markets.
turns to the recent past to explore the
ways in which the federal response to the        While the focus here is on Black house-
foreclosure crisis failed to address the         holds and communities, the structural
disproportionate impact foreclosures were        racism that continues to shape Black
having on Black households and neighbor-         disadvantage negatively affects Hispanic/
hoods. While not explicitly “race-based”         Latinx and Asian communities as well,
like the practices that shaped the recovery      as evidenced by the disparate impact
out of the Great Depression, the federal         of both foreclosures and the COVID-19
government’s response to the foreclosure         pandemic for these groups. Tackling anti-
crisis was “race-blind,” missing the ways        Black racism will benefit other structur-
in which Black households and neigh-             ally marginalized populations, yet doesn’t
borhoods were particularly vulnerable            preclude the need for additional research
to foreclosure. This section presents new        and policies that address discrimination
analysis that demonstrates how the lack          and disadvantage in other communities of
of a bold and affirmative set of policies to     color.
protect Black homeowners contributed to
the widening racial wealth gap, as well as

                                                                                                               4
A TERNER CENTER REPORT - MARCH 2021
The Legacy of Redlining homeowners—in their homes.9 The HOLC
also introduced amortizing home mort-
Much of the infrastructure and ideas that gages, which increased the affordability of
shape today’s housing finance system— home purchases and allowed homeowners
from the 30-year amortizing mortgage, to gradually build wealth in their homes
to the Federal Housing Administration, through regular, level payments that paid
to roles played by Fannie and Freddie— down their loan balance.10, 11
were established in response to the market
turmoil precipitated by the Great Depres- However, the HOLC also shaped who
sion. Before then, homeowners were in the would benefit from the recovery, estab-
minority in this country: only one out of lishing a race-based system for assessing
three households owned their home, and property values and risk. The HOLC
property ownership was limited largely to hired local real estate agents to appraise
older individuals and the wealthy. Mort- properties and determine whether they
gages required large upfront payments, would regain their value. Appraisers were
carried high interest rates, and often instructed to consider the condition of the
included a requirement to pay off the house as well as the surrounding neigh-
loan in full after five years. The real estate borhood, including its racial composi-
market was also characterized by limited tion, a practice that came to be known
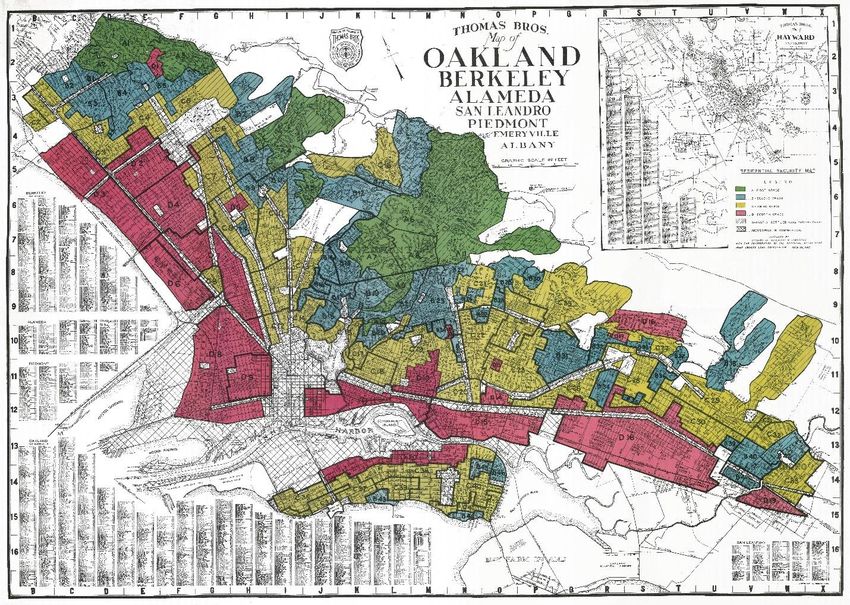
lending guidelines, high price volatility as redlining (Figure 2). A neighborhood
and appraisers who used “look, spit and could be designated as “low risk” and
guess” methods of assessing property colored green if it was home to “not a
values.5 Homeowners seldom built equity, single foreigner or negro…” Conversely,
with interest-only payments common, and neighborhoods that displayed the “infil-
bore the risk and insecurity associated tration of inharmonious racial groups” or a
with short-term mortgages.6 “concentration of negro population” were
deemed “hazardous” and colored red.12
The collapse of the banking system in These maps thus codified pervasive racism
1929 revealed the fragility of the existing in the financial system and provided the
financial system, and led to broad based basis for de jure discrimination in housing
reforms to bolster the U.S. economy. and mortgage markets.13
Among those reforms (which included the
creation of the Social Security Administra- As Rothstein argues, the HOLC maps
tion and the Public Works Administration “put the federal government on record”
in other sectors)7 was the federal Home as explicitly linking Black households and
Owners Loan Corporation (HOLC), which communities to lower quality housing
was designed to respond to the rising wave and neighborhoods.14 They also created
of foreclosures confronting the nation. By a powerful financial incentive for main-
one estimate, approximately half of all taining patterns of racial segregation,
U.S. urban home mortgages were delin- one that was strengthened when the FHA
quent as of January 1, 1934.8 The HOLC adopted many of the same principles in its
purchased home mortgages that were appraisal system for mortgage insurance.15
facing foreclosure and refinanced them The FHA discouraged banks from making
with more favorable payment terms and loans on properties in redlined areas, and
schedules, keeping more than a million recommended racially restrictive cove-
people—over 10 percent of American nants on newly built suburban neighbor-
5A TERNER CENTER REPORT - MARCH 2021
Figure 2: HOLC Redlining Map, Oakland, California
Source: Mapping Inequality: Redlining in New Deal America, University of Richmond Digital Scholarship Lab, available online at: https://dsl.
richmond.edu/panorama/redlining.
hoods to ensure white-only communities.16 further strengthened the government’s
Between 1940 and 1960, the Black-White role in ensuring equal access in credit
homeownership gap increased from 22 to markets. 18
28 percent, and in many cities, levels of
However, prohibiting discrimination is
racial segregation increased as these poli-
not the same as repairing the harm that
cies shaped differential patterns of resi-
was done by past policies, and the impact
dential mobility and housing access for
of redlining endures today. In a recent
Black and White households.17
study, Jacob Faber finds that cities that
These overt forms of de jure discrimi- were appraised by the HOLC became
nation have since been outlawed. The more segregated than those that were
Fair Housing Act of 1968, for example, not mapped, reinforcing the ways in
prohibits discrimination in the housing which systemic racism persists in shaping
market not only by race or ethnicity, but contemporary patterns of inequality.19
also based on religion, national origin, sex, Other researchers have drawn similar
disability, and family status. The Equal conclusions about the lasting legacy of
Credit Opportunity Act (1974), Home redlining, finding that neighborhoods that
Mortgage Disclosure Act (1976), and the were redlined are associated with higher
Community Reinvestment Act (1977) all rates of poverty, lower rates of economic
6A TERNER CENTER REPORT - MARCH 2021
Figure 3: Relationship between HOLC Redlining Map Assessment and Contemporary
Homeownership Rates
90
80
70
Homeownership Rate (2018)
60
50
40
30
20
10
0
A: Best (Green) B: Desirable (Blue) C: Declining (Yellow) D: Hazardous (Red)
Source: Aaronson, D., Hartley, D., &Mazumder, B. (2020). “The Effects of the 1930s HOLC ‘Redlining’ Maps.” Chicago, IL: Federal Reserve Bank of
Chicago.
mobility for children,20 reduced housing access to financial products, and the reluc-
supply, 21 lower life expectancy and higher tance of the federal government to affir-
incidence of chronic diseases,22 as well as matively further fair housing and directly
lower house values and homeownership tackle the persistent “conflation of race
rates (Figure 3).23 and risk to property values”(p. 259). As
a result, the program led to high rates of
While the HOLC maps are historical arti-
foreclosure in Black communities. Taylor
facts, the underlying ideas about prop-
terms this “predatory inclusion,” a term
erty, race, and risk persist, and have never
that could be just as easily applied to the
been sufficiently addressed by the federal
subprime boom that precipitated the next
government. Keeanga-Yamahtta Taylor’s
significant economic crisis nearly 40 years
recent book, Race for Profit: How Banks
later.
and the Real Estate Industry Undermined
Black Homeownership vividly shows the
negative consequences of not addressing
these dynamics. Through an analysis of
FHA’s efforts in the late 1960s and 1970s
to expand homeownership among Black
households, she shows how the passage of
anti-discrimination laws was insufficient
in the face of two enduring characteristics
of U.S. federal homeownership policy: the
reliance on the private sector to expand
7A TERNER CENTER REPORT - MARCH 2021
Uneven Recovery: one in four homeowners were “under-
water,” meaning their mortgage exceeded
Black Homeownership the value of their home.29
after the Great Recession This broader context of economic crisis,
however, obscures the ways in which
The Great Recession of 2007-2009 was Black communities were disproportion-
one of the deepest downturns in the ately impacted by both the labor and
U.S. economy since the Great Depres- housing market downturns. The unem-
sion, notable not only for the severity of ployment rate for Black workers reached
job losses, but also for the persistence of 16.8 percent in March 2010 (compared
weak economic conditions and slow labor to 8.7 percent for non-Hispanic White
market recovery even after the recession workers), and did not reach pre-crisis
was officially over.24 Triggered by crises in levels (7.6 percent) until May of 2017.30
the housing and financial markets,25 the Between 2007 and 2015, the Black-White
unemployment rate hit its peak in October wage gap grew to 26.7 percent, with the
2009 at 10 percent, when more than 15 average White worker making $6.73 more
million individuals were unemployed.26 an hour than the average Black worker.31
During the recession, household net worth
dropped by 18 percent, or more than $10 And, just as 40 years earlier with the
trillion.27 A significant share of this lost predatory expansion of FHA lending to
wealth was due to foreclosures and falling Black families,32 metropolitan racial and
housing values: between 2007 and 2010, ethnic segregation coupled with disparities
approximately 3.8 million households lost in credit access created the opportunity for
their home to foreclosure,28 and nearly subprime mortgage targeting, intensifying
Figure 4: The Impact of the Foreclosure Crisis by Race/Ethnicity
30
Percent of Loans at Risk of Foreclosure or
25
Foreclosed Upon, 2013
20
15
10
5
0
Non-Hispanic Black Hispanic/Latinx Asian
White
Source: Reid, C., Bocian, D., Li, W., & Quercia, R. G. (2017). “Revisiting the Subprime Crisis: The Dual Mortgage Market and Mortgage Defaults by
Race and Ethnicity.” Journal of Urban Affairs 39, no. 4: 469–87.
Note: Universe of loans includes those originated between 2004 and 2008 and tracked until January of 2013.
8A TERNER CENTER REPORT - MARCH 2021
the consequences of the American of the subprime lending boom—either had
housing bubble for Black households lost their home to foreclosure or was at
and other households of color.33 Black risk of doing so—a figure more than double
and Hispanic/Latinx borrowers were the rate of non-Hispanic White borrowers
disproportionately steered into the (Figure 4).
subprime market channel by lenders
who targeted their marketing efforts to The impacts were also spatial: neighbor-
households and neighborhoods that had hoods with more than 50 percent Black
untapped demand for credit, including residents had a foreclosure rate of twice
inner city minority neighborhoods that as high as those with less than 10 percent
had previously been redlined.34 These Black residents (Figure 5). The impact of
borrowers were charged higher interest these concentrated foreclosures in Black
rates and sold risky mortgage products neighborhoods went beyond the direct
with little consideration for whether they loss of homeownership for those families
would be able to afford the home over the experiencing default. These neighbor-
long term.35 hoods experienced much higher rates of
eviction among renters living in foreclosed
Subprime lending products and practices buildings: while data are hard to come by,
contributed directly to higher delinquency an estimated 46 percent of homes facing
and foreclosure rates among Black and foreclosure over this time period were
Hispanic/Latinx homebuyers, even after used as rental properties.37 In addition,
controlling for differences in income, these neighborhoods were more likely to
credit scores, and other observable charac- experience the negative spillover effects
teristics.36 By 2013, more than 25 percent associated with foreclosures, including
of Black homeowners who bought their lower property values and higher rates of
house between 2004 and 2007—the height crime.38
Figure 5: Neighborhood Foreclosure Rate by Percent Black Residents
Less than 10% Black
Residents
10 - 50% Black
Residents
More than 50% Black
Residents
0% 5% 10% 15% 20% 25% 30%
Percent of Loans at Risk of Foreclosure or Foreclosed Upon, 2013
Source: Data analysis based on Reid, C., Bocian, D., Li, W., & Quercia, R. G. (2017). “Revisiting the Subprime Crisis: The Dual Mortgage Market and
Mortgage Defaults by Race and Ethnicity.” Journal of Urban Affairs 39, no. 4: 469–87.
Note: Universe of loans includes those originated between 2004 and 2008 and tracked until January of 2013. Black refers to the percent of
residents in a census tract who self-identify as Non-Hispanic Black, and does not include Hispanic Black residents or those indicating two or
more races.
9A TERNER CENTER REPORT - MARCH 2021
The Federal Government’s Three factors played into this uneven
Response to the Crisis recovery.
The U.S. government’s response to the First, the federal government failed
Great Recession included a wide range to step in with direct borrower relief
of fiscal and monetary interventions. early enough. Researchers and commu-
Ranging from the Federal Reserve’s nity members had raised concerns over
efforts to increase liquidity in the finan- the rise in predatory subprime lending—
cial markets, to the Troubled Asset especially in the refinance market—in
Relief Program (TARP), to the American Black communities as early as 1999, and
Recovery and Reinvestment Act of 2009, certainly well before 2007, there was
these interventions—while controver- evidence that foreclosures were increasing
sial—did help to reduce the severity and in minority neighborhoods.40 However, it
the length of the economic downturn. wasn’t until the crisis hit Wall Street that
Estimates suggest that, due to the fiscal federal policymakers started to take the
and financial responses of policymakers, stress in the housing market seriously. In
real GDP was 16.3 percent higher in 2011, addition, racialized narratives about who
and unemployment was almost seven was to blame for the foreclosure crisis led
percentage points lower, than it would to concerns over moral hazard and “irre-
have been without these interventions.39 sponsible” borrowers choosing to strate-
gically default rather than a focus on the
However, the policies and programs that structural factors that had led Wall Street
were designed to directly intervene to to overextend its investments in subprime
assist homeowners in distress were much mortgage-backed securities.41
less successful. Even though these inter-
ventions were not intentionally discrim- The primary form of borrower relief came
inatory (as, for example, the HOLC’s in the form of the Making Home Afford-
redlining practices coming out of the Great able (MHA) program, passed in 2009.
Depression were), they nevertheless failed MHA included both a loan modifica-
to address the disproportionate impacts of tion program (HAMP) as well as a refi-
the foreclosure crisis on Black households nance program (HARP), which encour-
and communities. As a result, efforts to aged lenders and mortgage services to
address the foreclosure crisis—such as work with borrowers in distress to rene-
the Making Home Affordable (MHA) and gotiate their loan terms. While research
the Neighborhood Stabilization Program has shown that the programs themselves
(NSP)—while on their face race-neutral, didn’t lead to differential loan modifica-
failed to address the structural reasons tion rates for Black borrowers,42 by the
why Black homeowners and communities time these programs got off the ground, a
were hardest hit, and thus benefited least significant share of Black homeowners had
from the ensuing recovery. already lost their homes to foreclosure. In
2005, for instance, more than 30 percent
10A TERNER CENTER REPORT - MARCH 2021
Figure 6: Distribution of Foreclosure Filings over Time, by Race/Ethnicity
60
50
Share of Foreclosure Filings
40
30
20
10
0
2005 2009 (Start of HAMP/HARP) 2012
Non-Hispanic White Black
Source: Data analysis based on Reid, C., Bocian, D., Li, W., & Quercia, R. G. (2017). “Revisiting the Subprime Crisis: The Dual Mortgage Market and
Mortgage Defaults by Race and Ethnicity.” Journal of Urban Affairs 39, no. 4: 469–87.
of recorded foreclosures were experi- that were keeping delinquent borrowers
enced by Black homeowners, despite the from foreclosure: insufficient incomes to
fact that they made up only 8 percent of sustain their mortgages, as well as house
outstanding mortgage liens (Figure 6). values that had plummeted well below
HAMP and HARP only went into effect their purchase price. In addition, dele-
when the share of foreclosures among gating authority to mortgage servicers
non-Hispanic White borrowers had led to considerable problems with both
grown and become more representative tracking and enforcement of relief efforts.44
of the total mortgage business. The lack Stronger federal actions—such as making
of policy maker attention to the crisis that homeowner assistance programs manda-
was hitting Black communities—one that tory or allowing borrowers to restructure
was strongly related to predatory lending their mortgages in bankruptcy—never
practices that sought to strip wealth from gained political traction. While these
Black homeowners—reinforces the not-so- limitations were true for the majority of
subtle ways that these foreclosures were borrowers in distress, the higher rates
initially ignored and then reframed as the of unemployment among Black home-
result of risky borrower decisions rather owners, coupled with greater declines in
than mortgage lending practices. house values and higher rates of negative
equity in Black communities,45 meant that
Government relief also didn’t go deep
the support that was available often did
enough.43 By focusing largely on loan
not reach Black households.
modifications and refinancing, HAMP and
HARP did not address two major factors
11A TERNER CENTER REPORT - MARCH 2021
Second, in the wake of the crisis, High credit score and down-payment
lenders greatly tightened their standards translated into a recovery in
credit standards. Some tightening—and which only the highest credit and highest
particularly more rigorous assessments of wealth borrowers could buy homes.48
a borrower’s ability to repay their mort- Black households, who on average have
gage—was long overdue. But as housing lower credit scores and wealth because of
markets softened, and as affordability historical structural barriers to accessing
increased, credit standards remained credit,49 were thus disproportionately shut
restricted so that only the highest credit out of the homeownership market at the
quality borrowers were able to get a mort- same time that home prices in many neigh-
gage. Even FHA lending—which provided borhoods were at historic lows (Figure 7).
a critical backstop and counter-cyclical Third, the federal government failed
lending role post-crisis—increasingly to adequately address the uneven
shifted toward higher-credit borrowers. distribution of foreclosures across
By 2010, nearly 74 percent of FHA loans neighborhoods. The federal govern-
went to prime or near-prime borrowers, ment sought to address the negative spill-
compared to approximately 25 percent in over effects through the Neighborhood
2000.46 The Urban Institute estimated that Stabilization Program (NSP). NSP, initially
between 2009 and 2013—a period that saw authorized by the 2008 Housing and
house prices recover in many markets— Economic Recovery Act (HERA), entailed
lenders made 4 million fewer loans than three separate rounds, directing approxi-
they would have made if credit standards mately $7 billion towards the acquisition
had been what they were in 2000, a period and redevelopment of foreclosed proper-
of reasonable lending standards. 47
Figure 7: Changes in Home Purchase Originations by Race/Ethnicity, 2004 - 2018
160
Indexed Change in Home Purchase Mortgage Originations
140
120
100
80
60
40
20
0
04 05 06 07 08 09 10 11 12 13 14 15 16 17 18
20 20 20 20 20 20 20 20 20 20 20 20 20 20 20
Asian Black Hispanic/Latinx Non-Hispanic White
Source: Author’s calculations of HMDA Data.
12A TERNER CENTER REPORT - MARCH 2021
ties. NSP sparked significant innovation A broad set of investors stepped into the
at the local level, with city governments vacuum, purchasing foreclosed homes
and nonprofits collaborating on efforts to to convert them to rentals. As shown
establish community land trusts, develop in Figure 8, until 2006, only between 5
social enterprises, and build the capacity and 8 percent of home purchases were
of the field to manage scattered-site afford- made by investors. After 2006, however,
able rentals.50 investors made up an increasingly large
share of the home purchase market. This
However, the program faced significant included both small-scale investors (about
challenges as well, including insufficient 50 percent of the investor market), inves-
funding to match the scale of the crisis, as tors buying between 10 and 100 properties
well as a government oversight structure (30 percent) and large-scale investors (20
that made it difficult for nonprofits to move percent).
as quickly as private companies to purchase
properties.51 The quality and impact of Investor purchases were more common
NSP initiatives also varied greatly by state among lower-priced properties and in
and locale, creating a headwind against neighborhoods with a higher percentage
equity across jurisdictions. The FHA’s and of Black residents, closing off the oppor-
GSE’s bulk distressed asset sales further tunity to buy lower-cost homes. Between
limited the ability of lower-income house- 2011 and 2014, during the height of
holds and nonprofits to purchase more investor activity, nearly 1 in 4 home sales
moderately-priced properties.52 in majority Black neighborhoods went
to investors, and more than 1 in 3 lower-
priced homes did (Figure 9). 53
Figure 8: Share of Home Purchases by Investors, by Property Price Tier
25%
20%
15%
Percent of Sales
10%
5%
0%
99 000 001 002 003 004 005 006 007 008 009 010 11 012 013 014 015 016 017
19 2 2 2 2 2 2 2 2 2 2 2 20 2 2 2 2 2 2
All Home Purchases Lower-Priced Homes Mid-Priced Homes Higher-Priced Homes
Source: Author’s analysis of CoreLogic53 data.
13A TERNER CENTER REPORT - MARCH 2021
Figure 9: Neighborhood Share of Home Purchases by Investors, by Property Price Tier and Percent Black
Residents
40%
35%
30%
25%
Share of Sales
20%
15%
10%
5%
0%
Less than 10% Black Residents 10 - 50% Black Residents More than 50% Black Residents
Investor Purchases 2011-2014 Low Tier Investor Purchases 2011-2014
Source: Author’s analysis of American Community Survey, 2018 5-year estimates and CoreLogic54 data.
Note: Black refers to the percent of residents in a census tract who self-identify as Non-Hispanic Black, and does not include Hispanic Black
residents or those indicating two or more races. Investor purchase data was converted from zip codes to tracts using the Missouri Census Data
Center’s Geocorr 2018 crosswalk.
The Implications for Black failure of the U.S. government to address
Homeownership patterns of residential segregation and the
potential for capital exploitation in Black
54
The confluence of these factors—higher neighborhoods led to an uneven recovery
unemployment rates, higher foreclosures, not only in Black homeownership and
increased investor activity, and tight- wealth, but also in which neighborhoods
ened credit—all intersected to undermine experienced continued disinvestment or
Black homeownership rates (Figure 1) and intensified pressures around gentrifica-
increase the racial wealth gap. Researchers tion and displacement.
at the Urban Institute estimate that even
after controlling for differences in age and To demonstrate this, we clustered urban
educational attainment, Black families neighborhoods in the United States
lost a larger percentage of their wealth along two dimensions: the share of home
during the Great Recession than non-His- purchase loans that were made to Black
panic White families (47.6 versus 26.2 borrowers during the recovery period
percent).55 (2012-2018), as well as the change in the
share of lending to Black borrowers before
Yet these aggregate losses mask the ways and after the crisis.56 This clustering
in which the recovery was also shaped captures two dimensions of lending during
not only by who could buy homes and the recovery: overall access to mortgage
benefit from the recovery in home values credit for Black borrowers, as well as
between 2012 and 2018, but also where how much the share of lending to Black
those homes were located. The continued borrowers changed over time. The purpose
14A TERNER CENTER REPORT - MARCH 2021
of this clustering was to identify how attainment, as well as lower house values.
access to credit—and specifically, loans for These characteristics also typified the
home purchase—shifted over the period neighborhoods in which the recovery
of the recovery. The clustering process period saw increases in lending to Black
identified four different types of neighbor- households, though these neighborhoods
hoods: those that had low levels of mort- were more demographically diverse.
gage lending to Black neighborhoods both
Of particular note, however, are neighbor-
overall and during the recovery, those that
hoods that saw significant declines in their
saw declines in mortgage lending to Black
lending to Black households over the course
borrowers, those that saw increases in
of the recovery. Although they comprise a
mortgage lending to Black borrowers, and
relatively small share of neighborhoods,
those that continually have the majority of
these neighborhoods were places where
loans made to Black borrowers.
the share of mortgage lending to Black
The analysis highlights the continued households dropped to just 22.5 percent of
racial segmentation of housing markets. all purchase originations during recovery.
Of the approximately 47,000 urban This, despite the fact that Black house-
neighborhoods considered for this anal- holds made up approximately 50 percent
ysis (census tracts), more than 95 percent of the population in these neighborhoods.
originated less than 4.2 percent of loans to These neighborhoods also saw higher
Black borrowers. This represents a decline rates of investor purchases in both 2009
in lending to Black borrowers since 2004, and 2014, and a higher share of single-
but only slightly, emphasizing the chal- family homes being used as rental homes.
lenges Black households face in accessing These neighborhoods were also the ones
housing in a broad range of metropolitan that experienced the most dramatic price
neighborhoods. These neighborhoods are gains during the recovery (Figure 10),
predominantly non-Hispanic White, and highlighting the interconnections between
have higher incomes, higher house values, subprime lending, foreclosures, and the
and higher levels of educational attain- shifts in who benefitted from the recovery
ment than other neighborhoods, all of at the neighborhood scale. Neighborhoods
which work to further determine who has that saw declines in mortgage lending to
access to resources and privilege (Table 1). Black borrowers during the recovery saw
an increase in average property values
In contrast, the clustering analysis from $210,000 at the bottom of the
also identified neighborhoods in which market to over $300,000 in 2018, with
Black borrowers comprised a larger these gains accruing disproportionately
share of lending—over two-thirds of all to investors and non-Black households.
purchase mortgages. Lending patterns These neighborhoods were also more
in these neighborhoods did not change likely to be in cities experiencing gentrifi-
much over the course of the recovery cation pressures, including the San Fran-
either. Yet, in these neighborhoods, the cisco Bay Area, Los Angeles, Washington
long-term consequences of residential DC, Atlanta, and Nashville.
segregation manifest in lower household
incomes, lower rates of educational
15A TERNER CENTER REPORT - MARCH 2021
Table 1: Characteristics of Neighborhoods by Lending Clusters, 2019
Declines in
Low Levels Increases High Share
Mortgage
of Lending in Lending of Lending
Lending
to Black to Black to Black
to Black
Borrowers Borrowers Borrowers
Borrowers
Percent of Home Mortgage
Purchase Loans, Black Households 5.1 57.0 32.9 71.5
(2004)
Percent of Home Mortgage
Purchase Loans, Black Households 4.2 22.5 45.6 69.5
(2012-2018)
Neighborhood Socio-Economic
Characteristics (2019)
Percent Non-Hispanic White 66.5 29.4 31.8 15.1
Percent Asian 6.0 3.4 3.5 2.0
Percent Black 7.5 49.5 46.5 71.9
Percent Hispanic/Latinx 16.6 14.1 14.8 8.0
Percent with a BA or Higher 34.8 28.3 24.7 23.8
Unemployment Rate 4.8 7.0 6.7 8.3
Median Income $78,588 $55,946 $60,349 $58,922
Housing Market
Percent of Loans Seriously
13.2 18.9 20.0 21.8
Delinquent (2013)
Percent of Subprime Originations
24.7 39.1 36.1 39.6
(2004-2008)
Share of Investor Purchases (2009) 6.3 11.4 8.4 10.9
Share of Investor Purchases (2014) 12.9 18.9 16.5 18.2
Percent Single-Family Rentals
17.4 27.9 21.4 22.2
(2019)
Median House Value (2019) $339,604 $302,122 $195,775 $196,411
Number of Neighborhoods 44,622 275 890 1,259
Source: Author’s analysis of American Community Survey and Home Mortgage Disclosure Act Data, 2004 – 2018. Analysis limited to census tracts
with at least 100 home purchase loans between 2010 and 2018. Black share of loans calculated as a percent of loans with race data reported. 16A TERNER CENTER REPORT - MARCH 2021
Figure 10: House Price Recovery, by Lending Clusters
140
130
120
Zillow House Value Index (2004=100)
110
100
90
80
70
60
50
40
2004 2005 2006 2007 2008 2009 2010 2011 2012 2013 2014 2015 2016 2017 2018
High Share of Lending to Black Borrowers Increases in Lending to Black Borrowers
Low Levels of Lending to Black Borrowers Declines in Lending to Black Borrowers
Source: Author’s calculations of Zillow House Price Index, adjusted for inflation and normalized to 2004 values.
It is difficult to estimate the consequences reveals the continued stark differences in
of these trends on Black wealth, since the access to credit and wealth building across
counterfactual is far from clear. But to neighborhoods.
illustrate the longstanding consequences
Black households who were able to enter
of residential segregation and differential
homeownership over this time period did
access to credit on wealth, we estimated
build equity—an estimated $44 billion.
the amount of equity that homeowners
But had they received mortgages based on
who bought their homes between 2012
their share of the population (13.4 percent),
and 2018 gained, based on the year
they would have gained an additional $93
they bought their home and the house
billion in equity. Almost all of those gains
price appreciation that occurred in their
would have come from increased access
neighborhood through the end of 2018
to neighborhoods with very low levels of
(Figure 11). This vastly underestimates
lending to Black households (Figure 11).
differences in wealth accumulation over
While largely illustrative, this analysis
this time period, since it does not account
nevertheless demonstrates that in order to
for those who already owned homes, or
close the wealth gap, policies need to tackle
the equity accrued to those who purchased
both access to credit and racial exclusion.
the property without a mortgage. Yet it
17A TERNER CENTER REPORT - MARCH 2021
Figure 11: Racial Disparities in Homebuyer Equity Accumulation, 2012-2018
Declines in Mortgage Lending to Black Borrowers
Increases in Lending to Black Borrowers
High Share of Lending to Black Borrowers
Low Levels of Lending to Black Borrowers
0 20 40 60 80 100 120 140 160
Increase in Housing Equity (Billions $2019)
Equity Accumulated by Black Borrowers, 2012-2018
Alternate 1: Equity if Lending Share was Same as in 2004
Alternate 2: Equity Share if Lending Equal to Black Population in Neighborhood
Alternate 3: Equity Share if Lending Equal to Share of Black Population Nationally
Source: Author’s calculations of HMDA and Zillow Data.
The COVID-19 Pandemic employment since March, compared to
43 percent of non-Hispanic White adults.
The COVID-19 pandemic and associated There is also evidence that Black workers
economic recession presents a new threat are more likely to have experienced perma-
to the well-being of Black homeowners, nent layoffs.58
and has the potential to further exacer-
These disparities have increased housing
bate these racial inequalities in wealth.
insecurity for both Black renters and
Although the impacts of the pandemic
homeowners. Nearly one in five Black
have been widespread, Black workers face
homeowners is behind on their mort-
a double burden: they are more likely to
gage payments, compared to less than 10
be employed in the essential workforce
percent of non-Hispanic White house-
and thus susceptible to the virus,57 yet at
holds (Figure 12).
the same time they are also more likely to
have experienced a loss of income since The systems that are in place to support
March. Based on the Census Household homeowners in arrears are also likely
Pulse Survey, 55 percent of Black adults to be less helpful for Black households,
have experienced a loss of income or reinforcing the ways in which structural
18A TERNER CENTER REPORT - MARCH 2021
Figure 12: Homeowners Behind on Mortgage Payments, by Race/Ethnicity, November/December 2020
25%
Percent of Owner Households with a Mortgage
20%
15%
10%
5%
0%
Non-Hispanic White Black Hispanic/Latinx Asian Other
Source: U.S. Census Household Pulse Survey, November 25-December 7, 2020.
disadvantage manifests in multiple ways. their mortgage payments will be able to
For example, Black households who sell their homes rather than go into default.
applied for unemployment benefits were While certainly better than a foreclosure
less likely to receive them than non-His- (for both the borrower and the broader
panic White adults, and on average, their housing market), this nevertheless raises
unemployment checks were lower (even significant racial equity concerns, particu-
for workers who earn the same salary) larly if Black homeowners are more likely
due to state differences in benefit cover- to be forced to sell due to financial insecu-
age.59 In addition, while homeowners with rity coming out of the pandemic.
federally backed mortgages have some
reprieve thanks to forbearance options, All of this—coupled with research that
a Fannie Mae survey showed that half of shows that the severity and distress of a
homeowners do not know about forbear- recession falls hardest on households of
ance options and that the knowledge gap color—demands that the administration
is particularly acute for lower-income and take both immediate and deliberate action
minority homeowners.60 to ensure a more equitable recovery out of
this crisis than the last. This will require
The current market conditions suggest that both short-term relief actions, as well as
we will not see the same wave of foreclo- a more intentional set of policies for the
sures as we did during the last recession, in recovery that recognize and address the
part due to the fact that house prices have structural inequalities that have produced
been largely stable and/or rising. This and sustained racial inequalities in
means that homeowners unable to make housing and credit markets.
19A TERNER CENTER REPORT - MARCH 2021
Policy Implications that disproportionately benefited those
with capital, including investors and
The election has ushered in a new admin- higher wealth households.
istration, one that has the mandate and
Undoing the legacy of housing and mort-
the responsibility to lead the country out
gage discrimination and redistributing
of the COVID-19 pandemic and associated
the risks and rewards of homeownership
economic downturn. Those actions must
will require a much stronger role for the
be bold and focus on relief that is likely to
federal government going forward. The
have the greatest impact on lower-income
lessons from past periods of crisis point
and households of color. For example,
to two, twin principles that can guide this
expanding housing assistance for renters
agenda: first, develop policies that expand
and ensuring that the crisis doesn’t lead to
access to credit in meaningful and respon-
widespread evictions and increased home-
sible ways to underserved borrowers
lessness is fundamental to reducing racial
and communities, and second, explicitly
inequality, given the high share of Black
confront the systems that work to perpet-
households who are renters. There also
uate residential segregation and that
needs to be explicit policies focused on
exclude or displace lower-income house-
helping households facing accumulated
holds of color from the neighborhoods
rental or mortgage debt.
they want to call home. These two need to
However, these emergency actions are be pursued in tandem, and supported by
insufficient to address the larger systemic federal funding, attention to oversight and
inequalities that Black households face in implementation, and consumer protection.
the homeownership market, during the
The first principle goes back to the long-
recovery period and beyond. For too long,
term repercussions of redlining and the
housing policy has reinforced the legacy of
systemic denial of credit to Black house-
redlining by focusing on the deficiencies
holds. At the heart of this challenge is
of Black neighborhoods, rather than on
the way in which the lending industry
the structures that produced them. The
assesses and prices credit risk. Struc-
lessons from the last recession suggest
tural racism, both past and present, is
that if policies are not explicitly focused on
baked into how the financial system eval-
addressing the structural vulnerabilities
uates a borrower’s creditworthiness. Not
facing Black households, the benefits of
surprisingly, researchers have found that
the recovery will largely accrue to higher-
Black borrowers have a significantly lower
income households, furthering racial
median FICO score (626) compared to
inequalities in the housing market. As
non-Hispanic White borrowers (751). They
Ta-Nahesi Coates argues in “The Case for
are also more likely to have no credit score:
Reparations,” failing to address the roots
an estimated 21 percent of the Black popu-
of residential segregation merely sets
lation has no credit score, compared to
up recurring opportunities for capital to
12 percent of non-Hispanic White house-
extract wealth from Black communities.
holds.61 The rise of Fintech lending, as well
The data presented here show that these
as innovations in credit scoring algorithms
are not dynamics relegated to the past;
and the use of big data, all have the poten-
the subprime crisis—coupled with the
tial to further embed racial differences in
lack of federal attention to addressing
the assessment of risk.62
the conditions for Black families and
neighborhoods—contributed to a recovery
20A TERNER CENTER REPORT - MARCH 2021
Failing to confront these disparities However, the Biden-Harris Adminis-
means that the system will continue to tration should also seek to develop new
produce unequal outcomes. Studies have programs in which the government explic-
consistently shown that Black borrowers itly helps lower-credit score and lower-
are more likely to be denied a mortgage, wealth borrowers overcome the conditions
receive a loan with a higher interest rate, created by historical discrimination. Down
and face greater constraints to refinancing payment programs—while important
to a lower cost product.63 These inequal- in overcoming collateral constraints for
ities translate into material differences some first-time homebuyers—aren’t suffi-
in wealth: A recent paper estimates that cient on their own. Ultimately, reducing
mortgage discrimination costs Black and the Black/White homeownership gap will
Hispanic/Latinx borrowers 7.9 basis require more affirmative credit programs,
points more in interest on their home and a meaningful intent to overcome the
mortgages. Although this difference may legacy of discrimination in housing and
seem small, this “tax” adds up, costing an credit markets. The Community Reinvest-
estimated $765 million in extra interest ment Act is an example of such an affirma-
per year.64 Other researchers have esti- tive obligation, and should be modernized
mated that the average interest rate for to increase its effectiveness at redressing
Black homeowners is 33 basis points racial inequalities.66 The federal govern-
higher than for non-Hispanic White ment has other tools at its disposal as well.
homeowners, translating into an extra For instance, the Equal Credit Opportu-
$743 in mortgage interest costs a year.65 nity Act includes a provision for Special
More broadly, the impacts of how lenders Purpose Credit Programs (SPCPs) that
evaluate and price risk go beyond home- would allow a targeted lending program
ownership, affecting wide-ranging sectors on the basis of a protected class such as
such as job and rental applications, as well race or national origin without violating
as auto, life, and homeowners insurance. other federal antidiscrimination statutes,
such as the Fair Housing Act.67
The significance of credit scores for
everyday life means that there needs to GSE reform should also prioritize their
be much stronger oversight of risk assess- public mission of providing increased
ment practices, and greater transpar- credit access for affordable housing
ency into how credit scores are calculated and homeownership. The GSEs have a
and used. The Biden-Harris Adminis- long history of developing underwriting
tration should leverage the authority guidelines and products, making invest-
of the Consumer Financial Protection ments and developing partnerships that
Bureau to ensure that algorithms used have safely expanded credit to under-
to predict credit risk include expanded served communities. Indeed, the GSE
data on consumer payments (e.g., utility “Duty to Serve” principle is broader than
payments), increase the transparency and fair lending, and involves taking affirma-
quality of credit score calculations, and tive steps to reach out to communities
pursue disparate impact cases under the traditionally underserved by the housing
Equal Credit Opportunity Act and Fair finance market.68 Duty to Serve obliga-
Housing Act. tions, coupled with public funds to subsi-
21A TERNER CENTER REPORT - MARCH 2021
dize mortgage programs for lower-income income requirements, to better assess and
and lower-wealth households, could help mitigate risk while extending credit to
to overcome the different “starting line” borrowers who don’t qualify for a conven-
for Black households with limited assets tional loan.71 While more work is needed
or lower credit scores. to identify which products may be the
most beneficial for Black and other lower-
There are models to build on, that have wealth, the FHA and/or the GSEs are in a
demonstrated it is possible to expand unique position to analyze data and eval-
access to credit and homeownership uate pilot programs to identify potential
in responsible ways. For example, the responsible, scalable models.
Community Advantage Program, a joint
effort of the Ford Foundation, Fannie Policymakers also need to place greater
Mae, and Self-Help Credit Union, used emphasis on post-purchase intervention
a $50 million grant as a credit enhance- and support. There is increasing evidence
ment, which leveraged $4.74 billion in that income volatility and risk among
financing for low-interest-rate mortgages lower-income households is growing.72
to nearly 52,000 low-income home- Lower-income homeowners have a smaller
owners across the country.69 While the financial cushion with which to withstand
serious delinquency rate for these loans the impact of negative life events, such as
during the height of the foreclosure crisis unemployment or serious illness, or to
was higher than that for prime loans (10 meet unanticipated repair costs, and by
percent compared to 5 percent for prime virtue of their limited housing choices,
fixed-rate loans), it was substantially they are more likely to buy houses in need
lower than those for prime adjustable-rate of repair. Research has shown that access
loans, subprime fixed-rate loans, and to savings to cover 2-3 months of mortgage
subprime adjustable-rate loans, which payments leads to lower default rates than
exhibited serious delinquency rates of 18, equity support through down payment
22, and 43 percent, respectively.70 Given assistance.73 Structuring an insurance
the growth and increased capacity of the or savings program—for example, a
community development finance industry, “post-purchase” Individual Development
a new federal fund to provide credit Account that would set money aside for
enhancement capacity to expand this home improvements or shortfalls in mort-
program and bring the number of assisted gage payments funded in part by a share
households to scale could be significant in of the monthly loan payments—could help
mediating inequalities in access to credit improve the sustainability of homeown-
and homeownership. Another potential ership, especially for Black homeowners
remedy would be to look to the Veteran who may face greater precarity in the labor
Administration’s underwriting practices, market.74
including their loan-to-value and residual
22A TERNER CENTER REPORT - MARCH 2021
Second, the Biden-Harris Administra- on mobility strategies alone obscures the
tion needs to center neighborhoods and important ties individuals have to place,
place-based policy-making as part of its and ignores the voices of Black residents
racial equity strategy. The persistence of and organizers who are making claims for
policies and practices that reinforce racial the right to stay in their community.
and ethnic segregation means that Black
households continue to live in different A renewed role for the federal government
neighborhoods than their non-Hispanic in community development could help to
White counterparts. The Administration address the longstanding harms of resi-
has already taken important steps in that dential segregation by providing funding
direction, recommitting to the Affirma- to increase investment in Black commu-
tively Furthering Fair Housing (AFFH) nities through localized strategies, rather
rule and the disparate impact standard.75 than real estate speculation. Especially
Yet there is more to be done to tackle resi- with the likely long-term repercussions of
dential segregation, and the ways in which COVID-19 in lower-income and communi-
not only federal but also local zoning laws ties of color, the federal government could
continue to shape patterns of exclusion. In play a vital role in ensuring that mission-
California, recent legislation has reinforced driven entities have access to funding and
the goals of AFFH, requiring that each city technical assistance to ensure that the
and county include an analysis and action recovery doesn’t merely benefit those with
plan to combat housing discrimination as access to liquid capital. For example, a
part of its General Plan.76 Requiring this of governmental backstop or guarantee (e.g.,
more jurisdictions, as well as expanding through FHA or the GSEs) could be made
the capacity of jurisdictions to assess and available to mission-driven entities to
address barriers to fair housing, could help purchase properties at risk of speculative
to support more inclusive zoning practices flipping in exchange for long-term restric-
which would allow for greater housing tions on rents.79 Others have proposed
choices across metropolitan regions.77 the creation of a “Social Housing Devel-
opment Authority,” which could acquire
However, the framework for implementing distressed properties and then convey
fair housing also needs to account for the them to nonprofit housing organizations,
trends that are reshaping the geography of tenant groups, or other mission-driven
opportunity in many cities and metropol- groups.80
itan areas. Gentrification, displacement,
and the suburbanization of poverty are In addition, the federal government should
creating new patterns of racial exclusion. support the expansion of community
In addition, scholars are increasingly land trusts and cooperative ownership
pointing to the ways in which policies that models, which to date have been limited in
seek to promote integration can reinforce scale due to lack of funding and technical
the devaluation of Black neighborhoods.78 capacity. These models have the potential
What is needed are intentional efforts to build wealth and preserve affordability
to both open up exclusionary neighbor- over the long-term. In cities across the
hoods (urban and suburban) as well as country, community-led initiatives—
invest in community development and often led by Black community members—
the preservation of affordable housing in have been developing and sustaining
lower-income neighborhoods. The focus cooperative models of land ownership
23You can also read