Crop Production - National Agricultural Statistics ...
←
→
Page content transcription
If your browser does not render page correctly, please read the page content below

Crop Production
ISSN: 1936-3737

Released January 12, 2022, by the National Agricultural Statistics Service (NASS), Agricultural Statistics Board, United States Department
of Agriculture (USDA).

Orange Production Up 2 Percent from December Forecast

The United States all orange forecast for the 2021-2022 season is 3.92 million tons, up 2 percent from the previous
forecast but down 11 percent from the 2020-2021 final utilization. The Florida all orange forecast, at 44.5 million boxes
(2.00 million tons), is down 3 percent from the previous forecast and down 16 percent from last season’s final utilization.
In Florida, early, midseason, and Navel varieties are forecast at 17.5 million boxes (788,000 tons), down 3 percent from
the previous forecast and down 23 percent from last season’s final utilization. The Florida Valencia orange forecast, at
27.0 million boxes (1.22 million tons), is down 4 percent from the previous forecast and down 10 percent from last
season’s final utilization.

The California all orange forecast is 47.6 million boxes (1.90 million tons), is up 9 percent from previous forecast but
down 5 percent from last season’s final utilization. The California Navel orange forecast is 39.0 million boxes
(1.56 million tons), is up 11 percent from the previous forecast but down 4 percent from last season’s final utilization. The
California Valencia orange forecast is 8.60 million boxes (344,000 tons), is up 1 percent from the previous forecast but
down 9 percent from last season’s final utilization. The Texas all orange forecast, at 400,000 boxes (17,000 tons), is
down 27 percent from the previous forecast and down 62 percent from last season’s final utilization.
This report was approved on January 12, 2022.

              Secretary of Agriculture          Agricultural Statistics Board
                     Designate                          Chairperson
                    Seth Meyer                       Joseph L. Parsons

2                                                               Crop Production (January 2022)
                                                       USDA, National Agricultural Statistics Service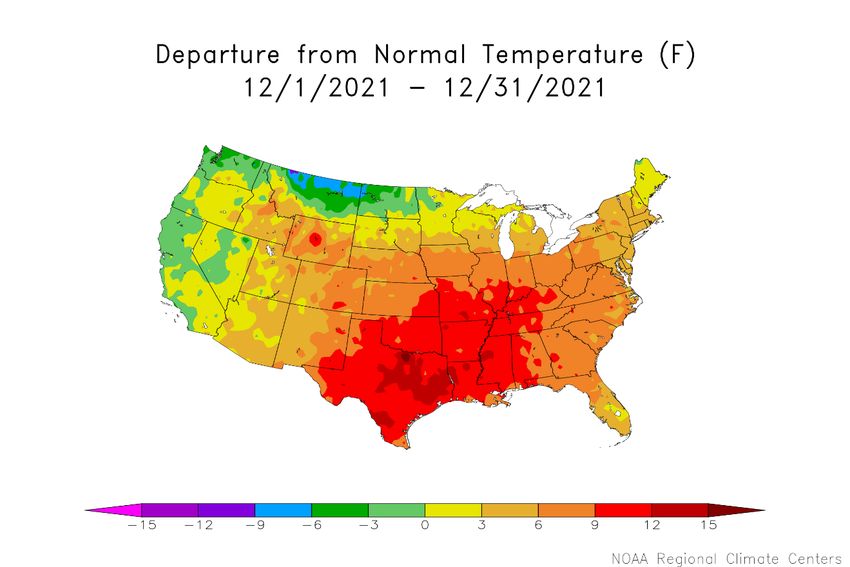
Contents

Utilized Production of Citrus Fruits by Crop – States and United States: 2020-2021 and Forecasted
January 1, 2022 ....................................................................................................................................................................... 4

Hay Stocks on Farms – States and United States: May 1 and December 1, 2020 and 2021 .................................................. 5

Crop Area Planted and Harvested, Yield, and Production in Domestic Units – United States: 2021 and 2022 ..................... 6

Crop Area Planted and Harvested, Yield, and Production in Metric Units – United States: 2021 and 2022 ......................... 8

Fruits and Nuts Production in Domestic Units – United States: 2021 and 2022 .................................................................. 10

Fruits and Nuts Production in Metric Units – United States: 2021 and 2022 ....................................................................... 11

Percent of Normal Precipitation Map ................................................................................................................................... 12

Departure from Normal Temperature Map ........................................................................................................................... 12

December Weather Summary ............................................................................................................................................... 13

December Agricultural Summary ......................................................................................................................................... 13

Crop Comments .................................................................................................................................................................... 14

Statistical Methodology ........................................................................................................................................................ 15

Reliability of January 1 Crop Production Forecasts ............................................................................................................. 15

Information Contacts ............................................................................................................................................................ 16

Crop Production (January 2022)                                                                                                                                                         3
USDA, National Agricultural Statistics Service
Utilized Production of Citrus Fruits by Crop – States and United States: 2020-2021 and
Forecasted January 1, 2022
[The crop year begins with the bloom of the first year shown and ends with the completion of harvest the following year]
                                                                      Utilized production boxes 1                  Utilized production ton equivalent
                   Crop and State
                                                                 2020-2021                 2021-2022            2020-2021                   2021-2022
                                                                (1,000 boxes)             (1,000 boxes)         (1,000 tons)               (1,000 tons)
Oranges
California, all ...........................................                  50,100                    47,600                  2,004                      1,904
 Early, mid, and Navel 2 ..........................                          40,600                    39,000                  1,624                      1,560
 Valencia ................................................                    9,500                     8,600                    380                        344

Florida, all ...............................................                 52,800                    44,500                  2,377                      2,003
 Early, mid, and Navel 2 ..........................                          22,700                    17,500                  1,022                        788
 Valencia ................................................                   30,100                    27,000                  1,355                      1,215

Texas, all ................................................                   1,050                       400                    45                         17
 Early, mid, and Navel 2 ..........................                           1,000                       300                    43                         13
 Valencia ................................................                       50                       100                     2                          4

United States, all .....................................                  103,950                      92,500                  4,426                      3,924
 Early, mid, and Navel 2 ..........................                        64,300                      56,800                  2,689                      2,361
 Valencia ................................................                 39,650                      35,700                  1,737                      1,563

Grapefruit
California ................................................                   3,900                     3,500                   156                        140
Florida .....................................................                 4,100                     4,100                   174                        174
Texas ......................................................                  2,400                     1,600                    96                         64

United States ..........................................                     10,400                     9,200                   426                        378
                                           3
Tangerines and mandarins
California ................................................                  28,100                    21,000                  1,124                       840
Florida .....................................................                   890                       800                     42                        38

United States ..........................................                     28,990                    21,800                  1,166                       878

Lemons
Arizona ...................................................                     800                     1,400                    32                         56
California ................................................                  21,300                    23,000                   852                        920

United States ..........................................                     22,100                    24,400                   884                        976
1
  Net pounds per box: oranges in California-80, Florida-90, Texas-85; grapefruit in California-80, Florida-85, Texas-80; tangerines and mandarins in
  California-80, Florida-95; lemons-80.
2
  Navel and miscellaneous varieties in California. Early (including Navel) and midseason varieties in Florida and Texas.
3
  Includes tangelos and tangors.

4                                                                                                                         Crop Production (January 2022)
                                                                                                                 USDA, National Agricultural Statistics Service
Hay Stocks on Farms – States and United States: May 1 and December 1, 2020 and 2021
May 1 December 1
State
2020 2021 2020 2021
(1,000 tons) (1,000 tons) (1,000 tons) (1,000 tons)
Alabama .................... 120 300 1,800 1,550
Arizona ...................... 45 20 300 180
Arkansas ................... 340 240 1,800 1,700
California ................... 420 220 1,640 1,200
Colorado .................... 410 230 1,700 2,000
Connecticut ............... 8 6 30 38
Delaware ................... 2 2 10 10
Florida ....................... 80 60 520 460
Georgia ..................... 170 290 1,210 1,260
Idaho ......................... 490 410 2,500 2,350
Illinois ........................ 220 270 1,000 950
Indiana ...................... 140 150 800 900
Iowa ........................... 510 430 2,430 3,120
Kansas ...................... 1,420 910 5,000 5,000
Kentucky .................... 625 950 3,825 3,750
Louisiana ................... 120 160 660 640
Maine ........................ 30 21 150 105
Maryland .................... 60 57 290 275
Massachusetts ........... 8 9 60 34
Michigan .................... 220 190 900 1,100
Minnesota .................. 360 400 2,240 1,460
Mississippi ................. 130 170 1,050 1,000
Missouri ..................... 1,410 1,000 6,000 5,700
Montana .................... 1,040 970 4,800 2,900
Nebraska ................... 1,380 1,000 4,200 4,650
Nevada ...................... 80 90 400 490
New Hampshire ......... 7 5 36 42
New Jersey ................ 29 10 90 85
New Mexico ............... 50 40 210 240
New York ................... 350 290 1,000 1,700
North Carolina ........... 180 190 1,120 950
North Dakota ............. 1,290 950 3,700 2,100
Ohio ........................... 220 210 1,300 1,400
Oklahoma .................. 1,350 1,150 4,100 4,260
Oregon ...................... 400 290 1,600 920
Pennsylvania ............. 350 275 1,410 1,440
Rhode Island ............. 1 1 4 5
South Carolina ........... 75 125 400 450
South Dakota ............. 2,350 2,200 5,800 3,300
Tennessee ................. 425 570 2,930 3,000
Texas ........................ 1,950 1,200 6,400 8,200
Utah ........................... 300 170 1,250 1,000
Vermont ..................... 36 35 145 157
Virginia ...................... 310 480 2,050 1,800
Washington ............... 160 220 1,100 1,100
West Virginia ............. 95 145 770 790
Wisconsin .................. 310 570 1,790 2,105
Wyoming ................... 350 325 1,500 1,150
United States ............. 20,426 18,006 84,020 79,016
Crop Production (January 2022) 5
USDA, National Agricultural Statistics ServiceCrop Area Planted and Harvested, Yield, and Production in Domestic Units – United States:
2021 and 2022
[Data are the latest estimates available, either from the current report or from previous reports. Current year estimates are for the full 2022 crop year.
Blank data cells indicate estimation period has not yet begun]
Area planted Area harvested
Crop
2021 2022 2021 2022
(1,000 acres) (1,000 acres) (1,000 acres) (1,000 acres)
Grains and hay
Barley ..................................................................................... 2,660 1,948
Corn for grain 1 ........................................................................ 93,357 85,388
Corn for silage ........................................................................ (NA) 6,481
Hay, all .................................................................................... (NA) 50,736
Alfalfa .................................................................................. (NA) 15,246
All other ............................................................................... (NA) 35,490
Oats ........................................................................................ 2,550 650
Proso millet ............................................................................. 725 662
Rice ........................................................................................ 2,532 2,488
Rye ......................................................................................... 2,133 294
Sorghum for grain 1 ................................................................. 7,305 6,490
Sorghum for silage .................................................................. (NA) 331
Wheat, all ................................................................................ 46,703 37,163
Winter ................................................................................. 33,648 34,397 25,464
Durum ................................................................................. 1,635 1,534
Other spring ........................................................................ 11,420 10,165
Oilseeds
Canola .................................................................................... 2,152.0 2,089.0
Cottonseed ............................................................................. (X) (X)
Flaxseed ................................................................................. 325 268
Mustard seed .......................................................................... 103.0 89.3
Peanuts .................................................................................. 1,585.2 1,545.0
Rapeseed ............................................................................... 14.3 12.5
Safflower ................................................................................. 152.0 135.0
Soybeans for beans ................................................................ 87,195 86,332
Sunflower ................................................................................ 1,288.5 1,243.8
Cotton, tobacco, and sugar crops
Cotton, all ............................................................................... 11,219.5 9,968.3
Upland ................................................................................ 11,093.0 9,844.5
American Pima .................................................................... 126.5 123.8
Sugarbeets ............................................................................. 1,160.0 1,107.6
Sugarcane .............................................................................. (NA) 937.5
Tobacco .................................................................................. (NA) 218.9
Dry beans, peas, and lentils
Chickpeas ............................................................................... 368.5 351.0
Dry edible beans ..................................................................... 1,394.0 1,335.6
Dry edible peas ....................................................................... 977.0 834.0
Lentils ..................................................................................... 708.0 549.0
Potatoes and miscellaneous
Hops ....................................................................................... (NA) 60.9
Maple syrup ............................................................................ (NA) (NA)
Mushrooms ............................................................................. (NA) (NA)
Peppermint oil ......................................................................... (NA) 44.0
Potatoes ................................................................................. 943.0 935.7
Spearmint oil ........................................................................... (NA) 14.9
See footnote(s) at end of table. --continued
6 Crop Production (January 2022)
USDA, National Agricultural Statistics ServiceCrop Area Planted and Harvested, Yield, and Production in Domestic Units – United States:
2021 and 2022 (continued)
[Data are the latest estimates available, either from the current report or from previous reports. Current year estimates are for the full 2022 crop year.
Blank data cells indicate estimation period has not yet begun]
Yield per acre Production
Crop
2021 2022 2021 2022
(1,000) (1,000)
Grains and hay
Barley ......................................................................... bushels 60.4 117,673
Corn for grain .............................................................. bushels 177.0 15,115,170
Corn for silage ..................................................................tons 20.1 130,317
Hay, all .............................................................................tons 2.37 120,196
Alfalfa ...........................................................................tons 3.23 49,245
All other ........................................................................tons 2.00 70,951
Oats ............................................................................ bushels 61.3 39,836
Proso millet ................................................................. bushels 23.2 15,376
Rice 2 ................................................................................. cwt 7,709 191,796
Rye ............................................................................. bushels 33.4 9,808
Sorghum for grain ....................................................... bushels 69.0 447,810
Sorghum for silage ............................................................tons 15.4 5,083
Wheat, all ................................................................... bushels 44.3 1,645,764
Winter ..................................................................... bushels 50.2 1,277,365
Durum ..................................................................... bushels 24.3 37,259
Other spring ............................................................ bushels 32.6 331,140
Oilseeds
Canola ......................................................................... pounds 1,302 2,720,550
Cottonseed .......................................................................tons (X) 5,377.0
Flaxseed ..................................................................... bushels 10.1 2,708
Mustard seed ............................................................... pounds 491 43,834
Peanuts ....................................................................... pounds 4,135 6,389,300
Rapeseed .................................................................... pounds 1,809 22,616
Safflower ..................................................................... pounds 1,001 135,175
Soybeans for beans .................................................... bushels 51.4 4,435,232
Sunflower .................................................................... pounds 1,530 1,902,985
Cotton, tobacco, and sugar crops
Cotton, all 2 ..................................................................... bales 849 17,624.0
Upland 2 ...................................................................... bales 841 17,257.0
American Pima 2 ......................................................... bales 1,423 367.0
Sugarbeets .......................................................................tons 33.2 36,751
Sugarcane ........................................................................tons 35.2 33,030
Tobacco ....................................................................... pounds 2,183 477,973
Dry beans, peas, and lentils
Chickpeas 2 ....................................................................... cwt 815 2,861
Dry edible beans 2 ............................................................. cwt 1,701 22,721
Dry edible peas 2 ............................................................... cwt 1,025 8,549
Lentils 2 .............................................................................. cwt 606 3,327
Potatoes and miscellaneous
Hops ............................................................................ pounds 1,900 115,630.9
Maple syrup ................................................................. gallons (NA) 3,424
Mushrooms .................................................................. pounds (NA) 757,987
Peppermint oil .............................................................. pounds 104 4,566
Potatoes ............................................................................ cwt 438 409,671
Spearmint oil ............................................................... pounds 119 1,775
(NA) Not available.
(X) Not applicable.
1
Area planted for all purposes.
2
Yield in pounds.
Crop Production (January 2022) 7
USDA, National Agricultural Statistics ServiceCrop Area Planted and Harvested, Yield, and Production in Metric Units – United States:
2021 and 2022
[Data are the latest estimates available, either from the current report or from previous reports. Current year estimates are for the full 2022 crop year.
Blank data cells indicate estimation period has not yet begun]
Area planted Area harvested
Crop
2021 2022 2021 2022
(hectares) (hectares) (hectares) (hectares)
Grains and hay
Barley ........................................................................ 1,076,480 788,340
Corn for grain 1 ........................................................... 37,780,640 34,555,670
Corn for silage ........................................................... (NA) 2,622,800
Hay, all 2 .................................................................... (NA) 20,532,350
Alfalfa ..................................................................... (NA) 6,169,900
All other .................................................................. (NA) 14,362,450
Oats ........................................................................... 1,031,960 263,050
Proso millet ................................................................ 293,400 267,900
Rice ........................................................................... 1,024,680 1,006,870
Rye ............................................................................ 863,200 118,980
Sorghum for grain 1 .................................................... 2,956,260 2,626,440
Sorghum for silage ..................................................... (NA) 133,950
Wheat, all 2 ................................................................ 18,900,240 15,039,490
Winter .................................................................... 13,617,010 13,920,120 10,305,030
Durum .................................................................... 661,670 620,790
Other spring ........................................................... 4,621,560 4,113,670
Oilseeds
Canola ....................................................................... 870,890 845,400
Cottonseed ................................................................ (X) (X)
Flaxseed .................................................................... 131,520 108,460
Mustard seed ............................................................. 41,680 36,140
Peanuts ..................................................................... 641,510 625,250
Rapeseed .................................................................. 5,790 5,060
Safflower .................................................................... 61,510 54,630
Soybeans for beans ................................................... 35,286,940 34,937,700
Sunflower ................................................................... 521,440 503,350
Cotton, tobacco, and sugar crops
Cotton, all 2 ................................................................ 4,540,420 4,034,070
Upland ................................................................... 4,489,230 3,983,970
American Pima ....................................................... 51,190 50,100
Sugarbeets ................................................................ 469,440 448,230
Sugarcane ................................................................. (NA) 379,400
Tobacco ..................................................................... (NA) 88,600
Dry beans, peas, and lentils
Chickpeas .................................................................. 149,130 142,050
Dry edible beans ........................................................ 564,140 540,500
Dry edible peas .......................................................... 395,380 337,510
Lentils ........................................................................ 286,520 222,170
Potatoes and miscellaneous
Hops .......................................................................... (NA) 24,630
Maple syrup ............................................................... (NA) (NA)
Mushrooms ................................................................ (NA) (NA)
Peppermint oil ............................................................ (NA) 17,810
Potatoes .................................................................... 381,620 378,670
Spearmint oil .............................................................. (NA) 6,030
See footnote(s) at end of table. --continued
8 Crop Production (January 2022)
USDA, National Agricultural Statistics ServiceCrop Area Planted and Harvested, Yield, and Production in Metric Units – United States:
2021 and 2022 (continued)
[Data are the latest estimates available, either from the current report or from previous reports. Current year estimates are for the full 2022 crop year.
Blank data cells indicate estimation period has not yet begun]
Yield per hectare Production
Crop
2021 2022 2021 2022
(metric tons) (metric tons) (metric tons) (metric tons)
Grains and hay
Barley ..................................................................................... 3.25 2,562,030
Corn for grain .......................................................................... 11.11 383,943,000
Corn for silage ........................................................................ 45.07 118,221,590
Hay, all 2 ................................................................................. 5.31 109,039,980
Alfalfa ................................................................................. 7.24 44,674,310
All other .............................................................................. 4.48 64,365,660
Oats ........................................................................................ 2.20 578,220
Proso millet ............................................................................. 1.30 348,720
Rice ........................................................................................ 8.64 8,699,720
Rye ......................................................................................... 2.09 249,130
Sorghum for grain ................................................................... 4.33 11,374,900
Sorghum for silage .................................................................. 34.42 4,611,220
Wheat, all 2 ............................................................................. 2.98 44,790,360
Winter ................................................................................. 3.37 34,764,180
Durum ................................................................................. 1.63 1,014,020
Other spring ........................................................................ 2.19 9,012,150
Oilseeds
Canola .................................................................................... 1.46 1,234,020
Cottonseed ............................................................................. (X) 4,877,930
Flaxseed ................................................................................. 0.63 68,790
Mustard seed .......................................................................... 0.55 19,880
Peanuts .................................................................................. 4.64 2,898,140
Rapeseed ............................................................................... 2.03 10,260
Safflower ................................................................................ 1.12 61,310
Soybeans for beans ................................................................ 3.45 120,707,230
Sunflower ............................................................................... 1.71 863,180
Cotton, tobacco, and sugar crops
Cotton, all 2 ............................................................................. 0.95 3,837,170
Upland ................................................................................ 0.94 3,757,270
American Pima ................................................................... 1.59 79,900
Sugarbeets ............................................................................. 74.38 33,339,950
Sugarcane .............................................................................. 78.98 29,964,310
Tobacco .................................................................................. 2.45 216,800
Dry beans, peas, and lentils
Chickpeas ............................................................................... 0.91 129,770
Dry edible beans ..................................................................... 1.91 1,030,610
Dry edible peas ....................................................................... 1.15 387,780
Lentils ..................................................................................... 0.68 150,910
Potatoes and miscellaneous
Hops ....................................................................................... 2.13 52,450
Maple syrup ............................................................................ (NA) 17,120
Mushrooms ............................................................................. (NA) 343,820
Peppermint oil ......................................................................... 0.12 2,070
Potatoes ................................................................................. 49.07 18,582,370
Spearmint oil .......................................................................... 0.13 810
(NA) Not available.
(X) Not applicable.
1
Area planted for all purposes.
2
Total may not add due to rounding.
Crop Production (January 2022) 9
USDA, National Agricultural Statistics ServiceFruits and Nuts Production in Domestic Units – United States: 2021 and 2022
[Data are the latest estimates available, either from the current report or from previous reports. Current year estimates are for the full 2022 crop year,
except citrus which is for the 2021-2022 season. Blank data cells indicate estimation period has not yet begun]
Production
Crop
2021 2022
Citrus 1
Grapefruit .............................................................................................. 1,000 tons 426 378
Lemons ................................................................................................. 1,000 tons 884 976
Oranges ................................................................................................ 1,000 tons 4,426 3,924
Tangerines and mandarins .................................................................... 1,000 tons 1,166 878
Noncitrus
Apples, commercial ......................................................................... million pounds 10,525.0
Apricots .......................................................................................................... tons 55,500
Avocados ....................................................................................................... tons
Blueberries, Cultivated ..................................................................... 1,000 pounds
Blueberries, Wild (Maine) ................................................................. 1,000 pounds
Cherries, Sweet ............................................................................................. tons 369,000
Cherries, Tart .................................................................................. million pounds 142.0
Coffee (Hawaii) ................................................................................ 1,000 pounds
Cranberries .................................................................................................. barrel 7,900,000
Dates ............................................................................................................. tons
Grapes ........................................................................................................... tons 6,470,000
Kiwifruit (California) ........................................................................................ tons
Nectarines (California) ................................................................................... tons
Olives (California) .......................................................................................... tons
Papayas (Hawaii) ............................................................................. 1,000 pounds
Peaches ......................................................................................................... tons 696,500
Pears ............................................................................................................. tons 670,000
Plums (California) .......................................................................................... tons
Prunes (California) ......................................................................................... tons
Raspberries, all ............................................................................... 1,000 pounds
Strawberries ........................................................................................... 1,000 cwt
Nuts and miscellaneous
Almonds, shelled (California) ........................................................... 1,000 pounds 2,800,000
Hazelnuts, in-shell (Oregon) ........................................................................... tons
Macadamias (Hawaii) ....................................................................... 1,000 pounds
Pecans, in-shell ................................................................................ 1,000 pounds 258,000
Pistachios (California) ...................................................................... 1,000 pounds
Walnuts, in-shell (California) .......................................................................... tons 670,000
1
Production years are 2020-2021 and 2021-2022.
10 Crop Production (January 2022)
USDA, National Agricultural Statistics ServiceFruits and Nuts Production in Metric Units – United States: 2021 and 2022
[Data are the latest estimates available, either from the current report or from previous reports. Current year estimates are for the full 2022 crop year,
except citrus which is for the 2021-2022 season. Blank data cells indicate estimation period has not yet begun]
Production
Crop
2021 2022
(metric tons) (metric tons)
Citrus 1
Grapefruit ............................................................................................................. 386,460 342,920
Lemons ................................................................................................................ 801,950 885,410
Oranges ................................................................................................................ 4,015,200 3,559,790
Tangerines and mandarins ................................................................................... 1,057,780 796,510
Noncitrus
Apples, commercial .............................................................................................. 4,774,060
Apricots ................................................................................................................ 50,350
Avocados ..............................................................................................................
Blueberries, Cultivated ..........................................................................................
Blueberries, Wild (Maine) ......................................................................................
Cherries, Sweet .................................................................................................... 334,750
Cherries, Tart ........................................................................................................ 64,410
Coffee (Hawaii) .....................................................................................................
Cranberries ........................................................................................................... 358,340
Dates ....................................................................................................................
Grapes ................................................................................................................. 5,869,490
Kiwifruit (California) ...............................................................................................
Nectarines (California) ..........................................................................................
Olives (California) .................................................................................................
Papayas (Hawaii) .................................................................................................
Peaches ............................................................................................................... 631,850
Pears .................................................................................................................... 607,810
Plums (California) .................................................................................................
Prunes (California) ................................................................................................
Raspberries, all .....................................................................................................
Strawberries .........................................................................................................
Nuts and miscellaneous
Almonds, shelled (California) ................................................................................ 1,270,060
Hazelnuts, in-shell (Oregon) .................................................................................
Macadamias (Hawaii) ...........................................................................................
Pecans, in-shell .................................................................................................... 117,030
Pistachios (California) ...........................................................................................
Walnuts, in-shell (California) ................................................................................. 607,810
1
Production years are 2020-2021 and 2021-2022.
Crop Production (January 2022) 11
USDA, National Agricultural Statistics Service12 Crop Production (January 2022)
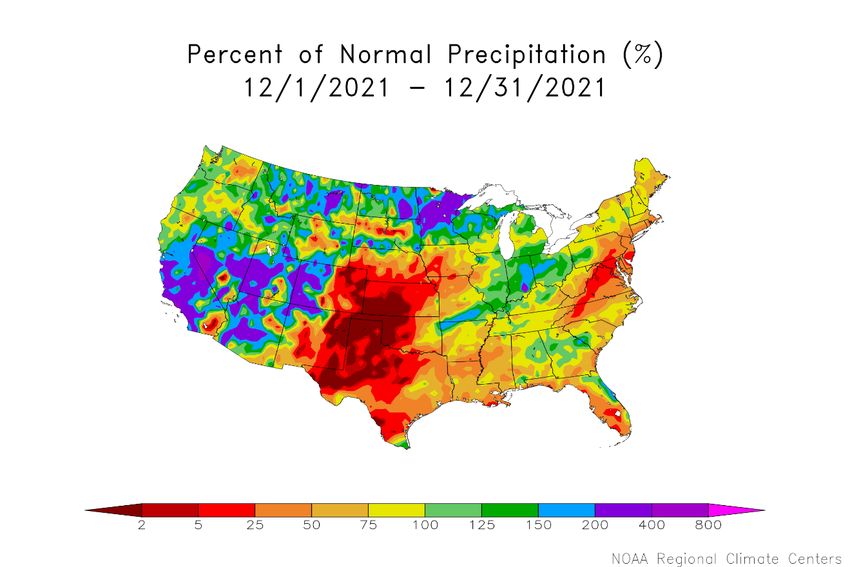
USDA, National Agricultural Statistics ServiceDecember Weather Summary December 2021 featured some notable weather extremes. In fact, monthly temperatures averaged at least 10°F above normal at numerous locations from the southern Plains to the Mississippi Delta, setting records for the warmest-ever December. That warmth, along with frigid conditions (locally more than 5°F below normal) near the Canadian border from the Pacific Northwest to the northern Plains, fueled an active storm track and periods of severe thunderstorms and heavy precipitation. The month’s first significant severe-weather outbreak occurred across the mid-South and lower Midwest on December 5-6. Less than a week later, on December 10, the deadliest December tornado in the Nation’s history—an EF-4 with winds estimated near 190 mph—traveled nearly 166 miles, starting in Obion County, Tennessee, and devastating the Kentucky communities of Mayfield and Dawson Springs. Nearly five dozen deaths occurred during that tornado’s rampage, according to preliminary reports, while dozens of additional tornadoes—some with fatalities— swarmed other parts of the mid-South and lower Midwest. A mid-December wind and dust storm, which raked the central and southern Plains with wind gusts of 75 to 100 mph or higher, further increased concerns regarding the overwintering wheat crop. By the end of December, only 33 percent of Kansas’ winter wheat was rated in good to excellent condition, down from 62 percent in late-November 2021. Similarly, the portion of Nebraska’s wheat rated good to excellent dropped from 64 to 39 percent between November 28 and December 31. Across the southern High Plains, Texas communities such as Amarillo and Borger ended the year on an 80-day streak (October 13 – December 31) without any precipitation—not even a trace. Lingering drought across the northern High Plains also maintained stress on winter wheat; in Montana, 71 percent of the crop was rated very poor to poor at year’s end. The Plains’ drought was also reflected in moisture shortages; at the end of December, among reporting states, topsoil moisture was rated at least one-half very short to short in Colorado (84 percent), New Mexico (80 percent), Montana (77 percent), Kansas (72 percent), Nebraska (68 percent), and North Dakota (50 percent). Toward month’s end, wind-driven wildfires near Boulder, Colorado—including the 6,219-acre Marshall Fire—swept through thousands of acres of drought-cured brush, timber, and grass, as well as portions of the communities of Louisville and Superior, destroying as many as 1,000 structures. In contrast, consistent and widespread storminess delivered December drought relief—in the form of improvements in soil moisture and mountain snowpack—west of the Rockies. Although drought coverage in the 11-state Western region decreased only 5 percentage points (from 94 to 89 percent) between November 30, 2021, and January 4, 2022, there was a substantial decrease in the higher-end drought categories. For example, Western coverage of extreme to exceptional drought (D3 to D4) during that 5-week period decreased from 44 to 24 percent, according to the Drought Monitor. Despite the promising start to the Western winter wet season, additional storminess will be needed in early 2022 to sustain the recovery from a multi-year drought. By December 31, the average water equivalency of the high-elevation Sierra Nevada snowpack stood at just over 15 inches, more than 150 percent of average for the date, but only 55 percent of the typical end-of-season accumulation. In addition, many large reservoirs—including Lake Mead on the Colorado River—remained at historically low levels and will be unlikely to significantly recover, even with ongoing wetness. December Agricultural Summary Most of the Nation was warmer than average during the month of December. Much of the Mississippi Valley, southern Ohio Valley, and Southern Plains were 9°F or more above normal for the month. In contrast, large parts of the Pacific Northwest, Northern Plains, and Northern Rockies were cooler than normal. Much of northern Montana recorded temperatures 6°F or more below normal. December was drier than normal for much of the Delta, Gulf Coast, Mid-Atlantic, Northeast, Central Plains, and Southern Plains. In contrast, large parts of the Northern Plains, Rockies, and Southwest received twice the normal amount of precipitation for the month. Nationwide, 92 percent of the winter wheat acreage had emerged by November 28, equal to last year but 1 percentage point ahead of the 5-year average. As of November 28, forty-four percent of the 2022 winter wheat acreage was reported in good to excellent condition, 2 percentage points below the same time last year. By November 28, eighty-five percent of the Nation’s cotton acreage had been harvested, 2 percentage points ahead of last year and 6 percentage points ahead of the 5-year average. Crop Production (January 2022) 13 USDA, National Agricultural Statistics Service
Ninety-seven percent of the 2021 sorghum acreage had been harvested by November 28, two percentage points behind
last year but 1 percentage point ahead of the 5-year average.

Ninety-six percent of the Nation’s peanut acreage had been harvested as of November 28, equal to both last year and the
5-year average.

By November 28, ninety-four percent of the Nation’s sunflower crop had been harvested, 2 percentage points behind last
year but 8 percentage points ahead of the 5-year average.

Crop Comments

Grapefruit: The United States 2021-2022 grapefruit crop is forecast at 378,000 tons, down 17 percent from the previous
forecast and down 11 percent from last season’s final utilization. The Florida forecast, at 4.10 million boxes
(174,000 tons), is unchanged from previous forecast and unchanged from the last season. California’s grapefruit forecast
at 3.50 million boxes (140,000 tons), is down 10 percent from the previous forecast and down 10 percent from last season.
The Texas grapefruit forecast is down 48 percent from the previous forecast and down 33 percent from the 2020-
2021 season.

Lemons: The 2021-2022 United States lemon crop is forecast at 976,000 tons, up 9 percent from previous forecast and
up 10 percent last season’s final utilization. The California forecast, at 23.0 million boxes (920,000 tons), is up 10 percent
from the previous forecast and up 8 percent from the 2020-2021 season. The Arizona forecast, at 1.40 million boxes
(56,000 tons), is up 8 percent from previous forecast and up 75 percent from last year.

Tangerines and mandarins: The United States tangerine and mandarin crop is forecast at 878,000 tons, down 1 percent
from the previous forecast and down 25 percent from the last season’s final utilization. The California tangerine and
mandarin forecast, at 21.0 million boxes (840,000 tons), is unchanged from the previous forecast but down 25 percent
from last year.

Hay stocks on farms: All hay stored on United States farms as of December 1, 2021 totaled 79.0 million tons, down
6 percent from December 1, 2020, which is the third lowest December 1 stocks since 1977. Disappearance from
May 1, 2021 - December 1, 2021 totaled 59.2 million tons, down 6 percent from the same period in 2020.

Record low December 1 hay stock levels were estimated in Maine, Massachusetts, Minnesota, North Dakota, and Oregon.

14                                                                                               Crop Production (January 2022)
                                                                                        USDA, National Agricultural Statistics Service
Statistical Methodology
Survey procedures: The orange objective yield survey for the January 1 forecast was conducted in Florida. In August
and September, the number of bearing trees and the number of fruit per tree is determined. In August and subsequent
months, fruit size measurement and fruit droppage surveys are conducted, which combined with the previous components
are used to develop the current forecast of production. California and Texas conduct grower on a quarterly basis in
October, January, April, and July. California conducts an objective measurement survey in September for Navel oranges
and in March for Valencia oranges.
Estimating procedures: State level objective yield estimates for Florida oranges were reviewed for errors,
reasonableness, and consistency with historical estimates. Reports from growers in California and Texas were also used
for setting estimates. These three States submit their analyses of the current situation to the Agricultural Statistics
Board (ASB). The ASB uses the survey data and the State analyses to prepare the published January 1 forecast.
Revision policy: The January 1 production forecasts will not be revised. A new forecast will be made each month
throughout the growing season. End-of-season estimates will be published in the Citrus Fruits Summary released in
September. The production estimates are based on all data available at the end of the marketing season, including
information from marketing orders, shipments, and processor records. Allowances are made for recorded local utilization
and home use.
Reliability: To assist users in evaluating the reliability of the January 1 production forecasts, the "Root Mean Square
Error," a statistical measure based on past performance, is computed. The deviation between the January 1 production
forecast and the final estimate is expressed as a percentage of the final estimate. The average of squared percentage
deviations for the latest 20-year period is computed. The square root of the average becomes statistically the "Root Mean
Square Error." Probability statements can be made concerning expected differences in the current forecast relative to the
final end-of-season estimate, assuming that factors affecting this year's forecast are not different from those influencing
recent years.
The "Root Mean Square Error" for the January 1 orange production forecast is 5.1 percent. This means that chances are 2
out of 3 that the current orange production forecast will not be above or below the final estimates by more than
5.1 percent. Chances are 9 out of 10 (90 percent confidence level) that the difference will not exceed 8.8 percent.
Changes between the January 1 orange forecast and the final estimates during the past 20 years have averaged
280,000 tons, ranging from 2,000 tons to 843,000 tons. The January 1 forecast for oranges has been below the final
estimate 6 times and above 14 times. The difference does not imply that the January 1 forecast this year is likely to
understate or overstate final production.
Reliability of January 1 Crop Production Forecasts
[Based on data for the past twenty years]
Difference between forecast
90 percent and final estimate
Root mean
Crop confidence Production Years
square error
interval Below Above
Average Smallest Largest
final final
(percent) (percent) (millions) (millions) (millions) (number) (number)
Oranges 1 ................................................ tons 5.1 8.8 280 2 843 6 14
1
Quantity is in thousands of units.
Crop Production (January 2022) 15
USDA, National Agricultural Statistics ServiceUSDA, National Agricultural Statistics Service Information Contacts
Listed below are the commodity statisticians in the Crops Branch of the National Agricultural Statistics Service to contact
for additional information. E-mail inquiries may be sent to nass@usda.gov
Lance Honig, Chief, Crops Branch ....................................................................................................... (202) 720-2127
Chris Hawthorn, Head, Field Crops Section ......................................................................................... (202) 720-2127
Irwin Anolik – Crop Weather........................................................................................................... (202) 720-7621
Joshua Bates – Oats, Soybeans ........................................................................................................ (202) 690-3234
David Colwell – Current Agricultural Industrial Reports ................................................................ (202) 720-8800
Michelle Harder – Barley, County Estimates, Hay .......................................................................... (202) 690-8533
James Johanson – Rye, Wheat ......................................................................................................... (202) 720-8068
Greg Lemmons – Corn, Flaxseed, Proso Millet ............................................................................... (202) 720-9526
Becky Sommer – Cotton, Cotton Ginnings, Sorghum ..................................................................... (202) 720-5944
Travis Thorson – Sunflower, Other Oilseeds ................................................................................... (202) 720-7369
Lihan Wei – Peanuts, Rice ............................................................................................................... (202) 720-7688
Fleming Gibson, Head, Fruits, Vegetables and Special Crops Section................................................. (202) 720-2127
Fleming Gibson – Blueberries, Cranberries, Cucumbers, Pistachios, Potatoes, Pumpkins,
Raspberries, Squash, Strawberries, Sugarbeets, Sugarcane, Sweet Potatoes............................. (202) 720-2127
Robert Little – Apricots, Dry Beans, Lettuce, Macadamia, Maple Syrup,
Nectarines, Pears, Snap Beans, Spinach, Tomatoes .................................................................. (202) 720-3250
Deonne Holiday – Almonds, Apples, Asparagus, Carrots, Coffee, Onions,
Plums, Prunes, Sweet Corn, Tobacco ........................................................................................ (202) 720-4288
Krishna Rizal – Artichokes, Cauliflower, Celery, Grapefruit, Garlic, Hazelnuts,
Kiwifruit, Lemons, Mandarins and tangerines, Mint, Mushrooms, Olives, Oranges ................ (202) 720-5412
Antonio Torres – Cantaloupes, Dry Edible Peas, Green Peas, Honeydews, Lentils,
Papayas, Peaches, Sweet Cherries, Tart Cherries, Walnuts, Watermelons................................ (202) 720-2157
Chris Wallace – Avocados, Bell Peppers, Broccoli, Cabbage, Chickpeas,
Chile Peppers, Dates, Floriculture, Grapes, Hops, Pecans ........................................................ (202) 720-4215
16 Crop Production (January 2022)
USDA, National Agricultural Statistics ServiceAccess to NASS Reports
For your convenience, you may access NASS reports and products the following ways:
➢ All reports are available electronically, at no cost, on the NASS web site: www.nass.usda.gov
➢ Both national and state specific reports are available via a free e-mail subscription. To set-up this free
subscription, visit www.nass.usda.gov and click on “National” or “State” in upper right corner above “search”
box to create an account and select the reports you would like to receive.
➢ Cornell’s Mann Library has launched a new website housing NASS’s and other agency’s archived reports. The
new website, https://usda.library.cornell.edu. All email subscriptions containing reports will be sent from the new
website, https://usda.library.cornell.edu. To continue receiving the reports via e-mail, you will have to go to the
new website, create a new account and re-subscribe to the reports. If you need instructions to set up an account or
subscribe, they are located at: https://usda.library.cornell.edu/help. You should whitelist notifications@usda-
esmis.library.cornell.edu in your email client to avoid the emails going into spam/junk folders.
For more information on NASS surveys and reports, call the NASS Agricultural Statistics Hotline at (800) 727-9540,
7:30 a.m. to 4:00 p.m. ET, or e-mail: nass@usda.gov.
The U.S. Department of Agriculture (USDA) prohibits discrimination against its customers, employees, and applicants for
employment on the basis of race, color, national origin, age, disability, sex, gender identity, religion, reprisal, and where
applicable, political beliefs, marital status, familial or parental status, sexual orientation, or all or part of an individual's
income is derived from any public assistance program, or protected genetic information in employment or in any program
or activity conducted or funded by the Department. (Not all prohibited bases will apply to all programs and/or
employment activities.)
If you wish to file a Civil Rights program complaint of discrimination, complete the USDA Program Discrimination
Complaint Form (PDF), found online at www.ascr.usda.gov/filing-program-discrimination-complaint-usda-customer, or
at any USDA office, or call (866) 632-9992 to request the form. You may also write a letter containing all of the
information requested in the form. Send your completed complaint form or letter to us by mail at U.S. Department of
Agriculture, Director, Office of Adjudication, 1400 Independence Avenue, S.W., Washington, D.C. 20250-9410, by fax
(202) 690-7442 or email at program.intake@usda.gov.Register Today https://www.usda.gov/oce/ag-outlook-forum
You can also read