Cross-platform electric powertrain optimisation for developing modular product families
←
→
Page content transcription
If your browser does not render page correctly, please read the page content below
Cross-platform electric powertrain optimisation for developing
                     modular product families
                                               B. Falvy1, M. Bryant1
 1: Drive System Design, Unit B Berrington Road, Sydenham Industrial Estate, Leamington Spa, CV31 1NB, UK

Abstract: When developing a product strategy aimed              traditional OEM’s, the current number of
at a range of vehicle platforms, is developing bespoke          manufacturers may not be sustainable. Traditional
electric powertrains for each platform the way to go?           OEM’s cannot expect to keep their current share in
The introduction of entire product families in a                the EV market. In addition to the increased
competitive and fast-paced EV marketplace demands               competition, EV’s have reduced profit margins due to
a high-level approach focussed on cross-platform                higher development and component cost [3]. Some
analysis. To achieve this, tools and processes are              studies show that most of the EV manufacturers incur
required that not only optimise architecture selection          loss in every EV sold barring the premium vehicle
but optimise product electrification strategies as a            segment [2]. Potential advantages of multi-platform
whole across multiple vehicle platforms.                        modularity are yet to be unlocked although clearly a
                                                                necessity in such a market dynamic. This is partly due
Drive System Design (DSD) has developed a system
                                                                to lower volumes of manufacture, but also because
approach called Electrified Powertrain Optimisation
                                                                synergies between various component technologies
Process (ePOP). ePOP enables the potential design
                                                                in such a fast-paced and developing market are
space for a given application to be thoroughly
                                                                difficult to clearly identify. All the above factors are
mapped. Through validated characterisation of
                                                                putting significant strain on EV powertrain
subsystems and components and rapid generation of
                                                                development programs.
input, vast numbers of complete powertrains variants
                                                                The challenge for OEM’s is to develop an optimised
can be simulated. Each system can be analysed for
                                                                powertrain that can be used across different vehicle
performance and range and compared using
                                                                programs, or to develop different powertrains with
intelligent trade off algorithms to study sensitivity to
                                                                common subcomponents. ePOP is an electrified
vehicle platform variations.
                                                                powertrain concept development tool used to
In this paper ePOP will be used to demonstrate how              generate an optimised powertrain from a multitude of
cross-platform optimisation can help manufacturers              rapidly generated feasible powertrains for different
create product strategies that are cost effective               topologies and layouts [4]. The generated powertrains
across a variety of target vehicle segments.                    are simulated and are optimised through cost
Keywords: electrified powertrain, modularity, ePOP,             functions and trade off algorithms. Powertrain cost
optimisation, multi-platform, range-anxiety, cost,              and energy consumption / EV range remains the key
efficiency, trade-off                                           for most evaluations. The traditional methods of
                                                                component cost optimisation may not be feasible in
                   1. Introduction                              every case. For example, considering a powertrain
                                                                built from slightly more expensive subsystems may be
With      most     traditional    Original    Equipment         worth the investment if the combined system level
Manufacturers (OEM’s) committing to have either a               efficiency brings an even more reduced battery cost.
fully electric portfolio or significantly increasing the        The basic methodology of ePOP can be extended for
number of electric vehicles in their offerings together         cross platform optimisation by simulating powertrains
with the new entrant OEM’s, total Electric Vehicle              that are identical (or share key design attributes) in
(EV) sales are on a rising trajectory. Despite                  multiple vehicle platforms. Additional filtering can be
temporary disruption of growth due to global events,            applied to simultaneously show powertrains that meet
continuous growth is expected to be sustained                   performance requirements for the vehicle they are
throughout the decade. Government commitments to                tested in, for multiple vehicle platforms at once. This
meeting aggressive emission targets to battle climate           paper demonstrates this approach via an example
change are having a positive impact on the future of            optimisation study.
EV development [1].
At present, the price of an EV is comparatively higher                        2. Definition of the study
than its ICE (Internal Combustion Engine) counterpart
which may deter customers. The decline of subsidies             2.1 Design Space
for EV’s from governments across the world
                                                                Whilst an optimisation study of a high number of
exacerbates the problem. With the emergence of new
                                                                dimensions and sample points is usually considered
entrant OEM’s in the EV domain in addition to
                                                                the best approach in order to explore the largest

                                                       Page 1 / 6
possible design space, this study is intentionally small               Vehicle Platform               A            B          C
in scope and focuses on a key aspect of modularity.
                                                                       Vehicle Mass [kg]             1200         1500       1900
The conclusions of this study are not intended to be a
definitive statement of the optimised powertrains for                  Wheel Radius [m]              0.3          0.33       0.33
the vehicle platforms in question, but a demonstration                 Frontal Area [m2]              2           2.2        2.3
of the value of the ePOP tool in the quest of helping                  Drag Coefficient [-]          0.33         0.3        0.26
the industry find optimal solutions at lowest cost. It is
                                                                       Peak Power [kW]               65           80         130
demonstrated that even if the design variables are
fundamentally reduced to a single attribute (motor                     Top Speed [km/h]              125          150        150
length), this still presents a valuable insight into trade-            0-100 km/h time [s]           13           12         8.5
offs on a system level.
                                                                       Wheel Torque [Nm]             1200         1800       2700
•   A total of 3 vehicles have been defined to
    investigate modularity. The power requirement at                        Table 1: Vehicle platform parameters and
    the wheel ranges from 65kW to 130kW peak.                                             requirements
•   Motors have been fixed in diameter and cross-
    section. An array of motors has then been built up             2.3 Powertrain Configurations
    using the elementary cross section and adjusting               Each vehicle has been targeted with a combination of
    the active length of the motor to result in a total of         powertrains according to Table 2.
    8 motors. The motors generated in this way cover
    a power range of 70 to 150kW peak. The motor
    concepts have had aspect ratios limited to avoid                   Vehicle Platform                     A            B     C
    challenging cooling requirements.                                  Motors < 100kW                       Yes        Yes    No
•   A fixed inverter technology is considered (IGBT).                  Motors > 100kW                       No          No    Yes
•    The transmission technology in focus is the                       Motors < 100kW (twin input)          No          No    Yes
     single-speed two-stage standard reducer. It is
     considered both as a single input shaft and as a                  Table 2: Powertrain combinations to target vehicle-
     twin input shaft arrangement (to support twin                                 dependent requirements
     motors driving onto the same input). A ratio band
     of 5:1 to 15:1 is covered using increments of                 2.4 Component Generation
     approximately 0.1:1.                                          The different powertrains are generated in ePOP by
•    The industry standard WLTP drive cycle is used                combining variants of electric motor, inverter and
     to test each vehicle / powertrain combination for             transmission. The input data generation process
     energy consumption. Based on experience if the                creates data for a range of subsystems according to
     design space includes technologies with very                  the desired design space.
     different attributes (such as for example varying
                                                                   Electric Motors: The motor models required in ePOP
     motor topologies), then the impact on energy
                                                                   are generated in MotorCAD and subsequently
     consumption may be significantly different
     particularly if a drive cycle with higher speed               imported into MATLAB/Simulink. Some key
     sections is considered.                                       parameters of each motor model include efficiency
                                                                   maps, material masses and inertias. The toolchain
For such a constrained study, a total number of
approximately 600 powertrain combinations have                     can cover a wide range of motor technologies and
been generated and simulation time is approximately                topologies. In this study, electric motors chosen are
8 minutes. An in-depth study covering a wide range of              limited to interior permanent magnet machine type
attributes would be recommended to have in the                     with hairpin winding, are cooled via direct oil spray
region of 50,000 - 100,000 powertrains generated,                  only and have a V-block type rotor magnet
which would take approximately 24 hrs on a single                  arrangement. The different motors generated have
core.                                                              unique peak and continuous power curves and
                                                                   efficiency maps.
2.2 Vehicle Platforms                                              Inverters: Every single motor model generated was
                                                                   uniquely paired with the selected IGBT inverter power
The vehicle platforms chosen were example                          module. Key attributes include efficiency map and
passenger car classes A, B and C. Each platform has                active material masses.
its own specific set of parameters as well as                      Transmissions: Model generation has capabilities to
requirements, these are shown in Table 1.
                                                                   generate the mass and efficiency of different types of
                                                                   transmissions. It can handle multiple speeds, multiple
                                                                   stages and different gear macro geometries. For this

                                                          Page 2 / 6
study, the architecture of transmission is limited to a offers a clear representation of the design space. The
single speed with two gear stages. The sizing of the lighter vehicles (class A and B) are relatively close in
gears, bearings and shafts are automatically specification and require powertrains of low power,
determined by the tool to meet speed, torque, and which leads to lower powertrain cost estimate
ratio requirements. Key attributes include active compared to the heavier class C vehicle. It also
material masses, efficiency maps and concept level means lower energy required to propel these vehicles
through the drive cycle speed profile, leading to lower
sizing.
energy consumption.
3. Powertrain performance testing
There are two major tests implemented in ePOP,
which accommodates both drive cycle simulation and
performance simulation. Drive cycle simulation uses
a backwards facing model while performance
simulations are performed on a forward-facing model.
The vehicle model considers vehicle and component
inertias, rolling resistance, aerodynamic drag,
gradient, and component efficiency maps to calculate
operating conditions and drive cycle energy
consumption.
ePOP also enables the user to directly link subsystem
performance to vehicle performance parameters such
as acceleration time, top speed, or drive cycle
efficiency. As a result, a fair comparison of different Figure 1: All simulated powertrains
systems across their operating conditions can be
presented for evaluation.
The data presented may contain powertrains with
transmission ratios that are not adequate to meet
vehicle level requirements. For example, too low
4. Study Results and Evaluation ratios will provide high vehicle top speeds but will not
have enough wheel torque at low speeds to address
4.1 Cost Function acceleration and / or gradeability. On the other hand,
The highly parametrised post processing of ePOP having a ratio that is too high will accelerate the
vehicle rapidly and will have high wheel torque, but
offers flexibility in adapting the cost function. The cost
will likely struggle to achieve top speed targets. For
model is primarily based on masses of active this reason, we apply the performance targets
components within each powertrain component. (different per vehicle) as defined in Table 1. The
Additional on-costs and weightings can be added for filtered results can be seen (zoomed in) in Figure 2.
high level parameters for example package volume
and shape or NVH risk ratings. This helps in
penalising the powertrains for not meeting the
required targets on parameters important for the
study but not otherwise included in the simulations
themselves. For multi-platform optimisation, one such
additional cost factor may be to reward modularity and
represent appropriately the savings in both
development and production costs. These factors are
so highly dependent on production volumes and the
manufacturing environment that they have not been
directly implemented in the cost model.
4.2 Results Analysis
Simulation results include all design space attributes,
inputs and outputs in a single database. The Post-
Processing Interface is utilised to visualise data. Figure 2: Filtered powertrains with performance
Figure 1 shows a plot of all simulated powertrains in targets applied
the design space (shaded by vehicle class). This view
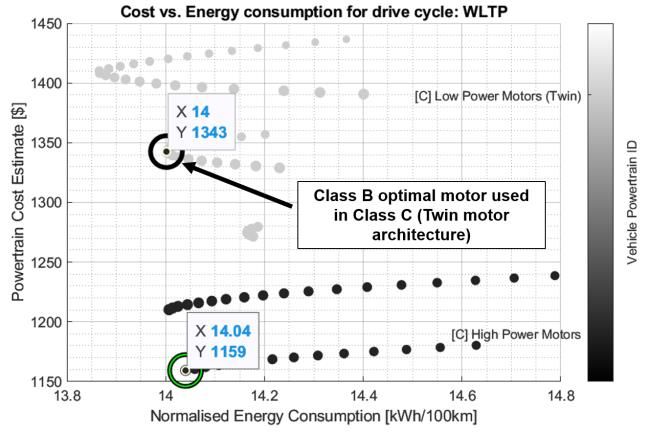
Page 3 / 6Vehicle Classes A and B: Taking a closer look at the defined in Table 1 have been met for all three
lighter vehicles, it is apparent that applying identical selections.
powertrains leads to a higher number of ratio
combinations that meet Class A requirements. This
behaviour is in line with expectations, and if the Vehicle Platform A B C
optimisation exercise is strictly about selecting Wheel Torque [Nm] 1229 1830 2718
optimal (lowest cost / lowest energy consumption Top Speed [kph] 156 152 193
balanced) powertrains per vehicle platform, then the
Acc. 0-100 kph [s] 11 11.8 8.4
recommended powertrains for each are shown in
Figure 3. Energy C. [kWh/100km] 11.5 12.7 14.0
Overall Efficiency [%] 82.2 81.5 78.2
Powertrain Cost Est. [$] 762 805 1159
Motor A Power [kW] 70 75 140
Motor A Torque [Nm] 125 165 300
Motor A Length [mm] 80.4 91.6 171.3
Total Ratio (1st) 9.8 11.2 9.3
Table 3: Optimised powertrain attributes (no
modularity)
5. Modularity Considerations
It is demonstrated that the most cross-platform
modularity can be achieved via the optimised Class B
powertrain. This a motor/transmission combination
Figure 3: Class A and B optimal powertrains that would be suitable to cover Class A, and also
Class C (with a shared motor, but a transmission
design with higher torque rating). These modular
Class C: This heavier vehicle platform with more powertrain options are different from the otherwise
aggressive performance targets had two separate optimised powertrains of Class A and Class C and
types of powertrain architectures assigned. Figure 4 therefore have an impact on both performance and on
shows the data shaded by powertrain type. There is a cost estimation. OEM’s have the fundamental choice
clear increase in cost when considering twin motor to make a selection between the two extreme cases
input arrangements (lighter colour). The optimised with regards to modularity, or to choose a path in
powertrain for Class C is highlighted. between.
• No modularity, each platform has its own
dedicated powertrain solution. This leads to the
lowest BoM cost for each application, but also
means higher development and manufacturing
overhead costs.
• The fully modular approach creates solutions with
higher BoM costs, but a cost reduction across
multiple platforms.
Simulation results for the fully modular approach are
summarised in Table 4. Energy consumption is
defined as a normalised kWh / 100km unit, which
gives a fair comparison between the various platforms
without having to consider the impact of batter
Figure 4: Class C optimal powertrain capacity.
The optimised powertrains for each vehicle and their
key attributes are summarised in Table 3. It is
demonstrated that all vehicle level requirements
Page 4 / 6Vehicle Platform A B C Class C impact: Due to the high difference in vehicle
Wheel Torque [Nm] 1830 1830 3490
specification, maintaining the same powertrain
specification across all A, B and C platforms is not
Top Speed [kph] 147 152 181
cost effective. It is however demonstrated that by
Acc. 0-100 kph [s] 9.1 11.8 7.7 taking the smaller power motor of Class B and
Energy C. [kWh/100km] 11.6 12.7 14.0 implementing a twin-input transmission design to
Overall Efficiency [%] 80.9 81.5 78.4 utilise the motor twice, this arrangement has notable
Powertrain Cost Est. [$] 805 805 1343
advantages. This is already the case without
considering the positive aspects of modularity. Since
Motor A Power [kW] 75 75 75
the transmission for such a high torque requirement
Motor B Power [kW] 0 0 75 would not be possible to derive from the Class B
Motor A Torque [Nm] 165 165 165 powertrain, there is a freedom of choice when it
Motor B Torque [Nm] 0 0 165 comes to ratio selection. Such a selection leads to the
Motor A Length [mm] 85.6 85.6 85.6 Twin-motor architecture to reach marginally better
energy consumption (7. Acknowledgement
The authors of this paper wish to thank Pinku Jojan,
Control Systems Engineer at DSD sincerely for her
invaluable contributions to this paper.
8. References
[1] Deloitte, “New market. New entrants. New
challenges. | Battery Electric Vehicles”, 2019.
[2] Y. Baik, R. Hensley, P. Hertzke, and S. Knupfer:
"Making electric vehicle profitable”, McKinsey, 2019.
[3] Strategy&: "Powertrain Study 2020, Staying
profitable in the new powertrain age", 2020.
[4] M. Bryant: " Costly decisions – creating product
strategies robust to market instability and cost
volatility ", CTI China, 2019.
[5] M. Bryant and T. Holdstock: " Gearing up for lower
cost electric drives: accelerating the development of
optimal electrified powertrain architectures,” 32nd
Electric Vehicle Symposium (EVS32), Lyon, France,
2019.
9. Glossary
ePOP: electrified Powertrain Optimisation Process
OEM: Original Equipment Manufacturer
BEV: Battery Electric Vehicle
EV: Electric Vehicle
IBGT: Insulated-Gate Bipolar Transistor (power module /
inverter technology)
SiC: Silicon Carbide (power module / inverter
technology)
BoM: Bill of Materials
Page 6 / 6You can also read