Cryogenic cave carbonate and implications for thawing permafrost at Winter Wonderland Cave, Utah, USA - Nature
←
→
Page content transcription
If your browser does not render page correctly, please read the page content below
www.nature.com/scientificreports
OPEN Cryogenic cave carbonate
and implications for thawing
permafrost at Winter Wonderland
Cave, Utah, USA
Jeffrey Munroe1*, Kristin Kimble1, Christoph Spötl2, Gabriela Serrato Marks3,
David McGee3 & David Herron4
Winter Wonderland Cave contains perennial ice associated with two types of cryogenic cave carbonate
(CCC) formed during the freezing of water. CCCfine is characterized by relatively high δ13C values,
whereas CCCcoarse exhibits notably low δ18O values indicating precipitation under (semi)closed-system
conditions in a pool of residual water beneath an ice lid. Previous work has concluded that CCCcoarse
forms during permafrost thaw, making the presence of this precipitate a valuable indicator of past
cryospheric change. Available geochronologic evidence indicates that CCC formation in this cave is a
Late Holocene or contemporary process, and field observations suggest that the cave thermal regime
recently changed in a manner that permits the ingress of liquid water. This is the first documented
occurence of CCCcoarse in the Western Hemisphere and one of only a few locations where these minerals
have been found in association with ice. Winter Wonderland Cave is a natural laboratory for studying
CCC genesis.
The cryosphere is responding rapidly to climate warming, and paleoclimate records are critical for understand-
ing the novelty of these r esponses1,2. A persistent challenge is that many paleoclimate archives are biased toward
extremes, for instance the most extensive glacial a dvances3, most widespread periglacial c onditions4, or sea level
high- and low-stands5. Yet records of past climatic transition are crucial for placing contemporary global change
into a longer-term c ontext6. This is especially true in Arctic and high mountain environments where temperatures
are warming rapidly7,8, leading to dramatic diminishment of ice extent9,10 and degradation of permafrost11–13.
Thus there is an urgent need for better records of how the cryosphere changed in the past, to clarify when and
how rapidly changes occurred, and in what pattern these changes unfolded across the landscape.
A unique proxy demonstrated to provide information about past episodes of permafrost thaw, a transition
that is often particularly disruptive to landscapes, ecosystems and infrastructure, is cryogenic cave carbonate
(CCC). These minerals form when liquid water enters a cave containing subzero temperature conditions14. As
this water freezes, solutes are concentrated in the residual liquid until saturation is reached and precipitation of
CCC is i nduced15,16. Although seasonal subzero conditions can be created inside a cave entrance by winter cold,
more significant permanently subzero conditions are maintained in so-called “ice caves” by ventilation regimes
that preferentially allow the ingress of winter air while excluding summer w armth17,18. For instance, caves with
a single downward sloping entrance can trap cold air through density settling in winter; air that is not replaced
by warmer, less dense air in the summer. Alternatively, caves with multiple entrances at different elevations
are susceptible to chimney effects that support freezing conditions where large amounts of cold air are pulled
inter17,19. Either way, CCC is precipitated when water containing sufficient dissolved solutes
into the cave in w
encounters the subzero conditions.
Two types of CCC have been identified. One group, referred to as CCCfine, forms when a film of water freezes
on the surface of pre-existing ice20. The large surface area of this thin layer facilitates degassing of C O2, pref-
erentially removing 12C, and leaving the remaining water enriched in 13C through disequilibrium e ffects21,22.
Simultaneously, the preferential incorporation of 18O in the ice is counterbalanced by evaporation of lighter 16O
from the water surface, yielding a characteristically higher δ13C and relatively unaltered δ18O values20. The ice
1
Geology Department, Middlebury College, Middlebury, VT 05753, USA. 2Institute of Geology, University of
Innsbruck, 6020 Innsbruck, Austria. 3Department of Earth, Atmospheric, and Planetary Sciences, Massachusetts
Institute of Technology, Cambridge, MA 02142, USA. 4USDA-Forest Service, Ashley National Forest, Duchesne,
UT 84021, USA. *email: jmunroe@middlebury.edu
Scientific Reports | (2021) 11:6430 | https://doi.org/10.1038/s41598-021-85658-9 1
Vol.:(0123456789)
www.nature.com/scientificreports/
Figure 1. Map of Winter Wonderland Cave showing sections of the cave floored by ice (blue), breakdown
(hatched pattern), and sampling locations. Inset shows the location of the cave in northeastern Utah (star).
involved in the formation of CCCfine does not need to be perennial, however the presence of CCCfine in a cur-
rently ice-free cave is nonetheless clear evidence for colder conditions in the past.
In contrast, CCCcoarse is a more specific proxy because it forms when a migrating permafrost table driven
by thaw intersects the upper part of a cave, allowing dripwater to enter and form pools on the ice s urface23,24.
Because the temperature in the main part of the cave (below the permafrost table) is still subzero, these pools
freeze over, creating (semi)closed-system conditions in which degassing of C O2 and evaporation of water are
greatly reduced23. Slow freezing of these isolated volumes of water precipitates CCCcoarse distinguished by notably
lower values of δ18O compared with CCCfine14,16,25. As is apparent throughout Arctic and high mountain environ-
ments today, elevation of ground temperature above 0 °C, thawing of permafrost, and melting of ground ice are
step-changes with dramatic repercussions for landscape and environmental e volution26. CCCcoarse, therefore, is
a critical proxy because it records past episodes of permafrost thaw.
Here we report the first discovery of CCCcoarse in North America from an unusual setting where apparently
young CCC is present in association with modern perennial ice. Our work provides an important point of
comparison for CCC from well-studied caves in Europe, and documents a setting in which theories for CCC
genesis could be evaluated.
Location. The CCC studied in this project was collected from Winter Wonderland Cave (WWC) in the
Uinta Mountains of northeastern Utah, USA (Fig. 1). This solution cave has developed in the Carboniferous-age
Madison Limestone, a regionally extensive rock unit that in this area consists of fine to coarse-grained dolomite
and limestone, with locally abundant nodules of chert27. The entrance to WWC is at an elevation of 3140 m asl
in a north-facing cliff at the edge of the karstified Blind Stream Plateau (40.53°N, 110.73°W), a sparsely forested
subalpine landscape. The mean annual air temperature (1985–2020) at the Brown Duck snowpack telemetry
(SNOTEL) station at a similar elevation (3223 m) 12 km to the east of WWC is 0.3 °C (https://wcc.sc.egov.usda.
gov/nwcc/site?sitenum=368). Elsewhere in the Uinta Mountains, the Chepeta remote automated weather station
(RAWS) at an elevation of 3694 m recorded a mean temperature of − 2.0 °C between 2000 and 2019 (https://
wrcc.dri.edu/cgi-bin/rawMAIN.pl?utCHEP). Inside WWC temperatures were consistently subzero from 2016
to 2018 (with a mean of − 0.5 °C) because of a ventilation regime that brings cold winter air in through the main
entrance, which is elevated above the main part of the cave, and inhibits the entry of warm air in the summer.
As a result, about half of the cave, which has a mapped length of 245 m, is floored by perennial ice up to 3 m
thick. CCC is present as a lag on the ice surface, drapes rocks emerging from the sublimating ice, and occurs as
discrete layers within the ice body (Fig. 2a). Additional details about the cave, its climatology, and the perennial
ice are presented in Munroe (2021).
Representative CCC samples, numbered YS-1 through YS-6 (Table S1) were collected from the ice surface
along with a sample (BF) from within an exposed stratigraphic section through the ice, and three samples that
were submerged in small (~ 10–30 cm deep) pools (Fig. 2b) of water filling depressions in the ice (CP, YP, and
TF). Additional samples of Madison Limestone bedrock and water from pools were also collected for analysis.
Results and interpretation
CCC morphology. An array of morphologies is present in the CCC samples from WWC (Figs. 2 and S1).
The smallest size fractions are spherulitic, with larger aggregates reaching diameters of 50 µm, and individual
spherules from 10 to 20 µm in diameter (Figs. 2c and S1a,b). This observation is corroborated by results from
laser scattering, which reveal mean grain sizes from 24 to 42 µm in the < 75-µm fraction. Rounded grains are
typically clumped in botryoidal aggregates with smooth surfaces, and dumbbell structures are common. Occa-
sionally more sharp-edged morphologies are present, with needle-like points that rarely exceed 5 μm in length.
Larger size fractions (75–250 μm) contain rafts of aggregated grains in excess of 200 μm long. The TF samples,
which were collected from the water surface, are characterized by arrow-shaped blades 10–20 µm long, grouped
Scientific Reports | (2021) 11:6430 | https://doi.org/10.1038/s41598-021-85658-9 2
Vol:.(1234567890)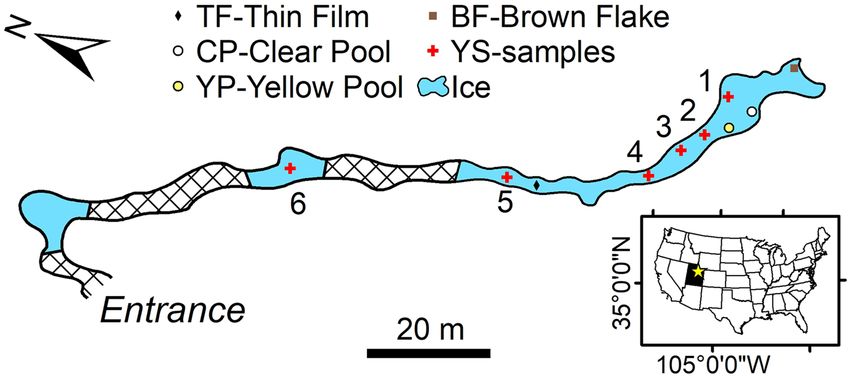
www.nature.com/scientificreports/
Figure 2. (a) Loose CCCcoarse on the surface of the ice. Red knife is 10 cm long. (b) Pool of water with a lid of
ice along the edge of the perennial ice. (c) SEM image of sample YS-6 (CCCcoarse) showing calcite spherules. (d)
SEM image of sample TF (CCCcoarse) showing broken calcite rafts.
into thin rafts (Figs. 2d and S1c). All of these observations match CCC morphologies reported in the literature.
For instance, previous work has established that CCC often occurs as raft-like aggregates of crystals, and spheri-
cal forms23,24,28. Rafts are generally flat and composed of interlocking crystals in a manner similar to floating
carbonate minerals reported from non-cryogenic cave environments29. Crystal splitting has been invoked as a
mechanism for the growth of spherical forms30, which are sometimes superimposed on a branching, sheaf-life
skeleton31. Finally, spherules are reported to display smooth surfaces, and often connect during growth to form
dumbbell shapes23 or chains24.
On the other hand, the CCC in WWC is considerably finer than precipitates with similarly low δ18O values
reported from European caves. Although there is a wide range in sizes, CCC is typically described as having
crystals from < 1 to ~ 40 mm23,24,28 compared with the 10–20-µm diameter spherules common in WWC. The
significance of this difference is unclear; it may simply indicate that CCC in WWC formed from smaller-volume
pools, or from water with a lower total dissolved load.
Types of CCC present in WWC. Although, as their names suggest, early studies differentiated CCCfine and
CCCcoarse by grain size, δ13C and δ18O values reflecting different C and O isotope fractionation mechanisms are
now recognized as the only valid criteria for distinguishing between the two g roups20. With this in mind, values
of δ13C and δ18O indicate that both types of CCC are present in WWC (Fig. 3a), despite no consistent distinction
in their grain size distributions. Samples YS-3 and YS-4 have δ13C and δ18O values averaging 6‰ and − 7.3‰
respectively (Table S2), suggesting that both are CCCfine. In contrast, samples YS-1, YS-2, YS-5, YS-6, BF, CP, and
YP have lower values of δ13C, averaging ~ 3.0‰, and notably lower δ18O values, averaging − 16.5‰. These values
identify these samples as CCCcoarse (Table S2). Sample TF also plots in the CCCcoarse field (Fig. 3a), although it
was collected from a pool that had just begun to freeze, which may explain why its δ18O value is less negative
than the other CCCcoarse samples. For comparison, samples of the Madison Limestone collected in WWC have
an average δ13C value of 2.2‰ and δ18O value of − 5.9‰ (Fig. 3a). Consistency of stable isotope values within
individual size fractions (< 75 µm, 75–165 µm, and 165–250 µm) emphasizes that YS-5, YS-6, CP, and YP are
pure CCCcoarse (Fig. 3b). In YS-1 and YS-2, CCCcoarse is concentrated in the < 75-µm fraction. In contrast, YS-4 is
consistently CCCfine in all size fractions.
The results of additional analyses permit further interpretation of these samples. XRD reveals that YS-3 and
YS-4 (CCCfine) are a mixture of calcite and quartz (Fig. S2), and rounded quartz grains were visible in the SEM
images (Fig. S1d). The presence of quartz is confirmed in the XRF results, where sample YS-4 contains 52% S iO2
(Table S3). YS-3 and YS-4 also have much higher chondrite-normalized REE values (Table S4, Fig. S3). These
observations, along with the isotope data for size fractions presented above, are evidence for a detrital component
in these CCCfine samples, which were collected from bedrock shelves 50–100 cm above the current ice surface. In
contrast, XRD analysis indicates that the CCCcoarse samples from the ice surface are composed solely of calcite, as
are the bedrock samples (Fig. S2). Major element analysis (Table S3) reinforces the abundance of calcite in YS-6
Scientific Reports | (2021) 11:6430 | https://doi.org/10.1038/s41598-021-85658-9 3
Vol.:(0123456789)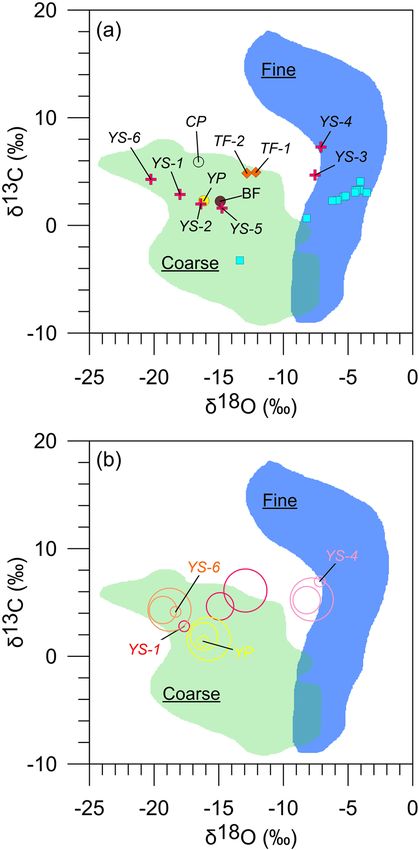
www.nature.com/scientificreports/
Figure 3. (a) Isotope data for samples from WWC: blue squares are bedrock; red crosses are CCC from the ice
surface; CP and YP are CCC from the “clear” and the “yellow” pools, respectively; BF is from a layer of CCC
within the perennial ice body. The blue and green fields delineate the typical range of isotope values for CCCfine
and CCCcoarse after28. (b) Isotope values for samples YS-1, YS-4, YS-6, and YP presented by size fraction: large
circle, 165–250 µm; medium circle, 75–165 µm; small circle, < 75 µm.
(70% as CaO), and Mg is considerably more abundant in YS-6 (12.2% as MgO) than in YS-4 (1.8%). Collectively
these analyses support the conclusion that the CCCcoarse samples are (nearly) pure precipitates, whereas the CCC
fine samples are a mixture of precipitated calcite and detrital minerals.
CCC ages. Previous studies have successfully applied 230
Th/U disequilibrium dating28 to CCC16. Accord-
ingly, an attempt was made to date CCCcoarse from WWC (Table S5). The resulting ages are imprecise due to low
230
Th/232Th ratios, a situation that has complicated other work24,28, meaning that the correction for detrital 230Th,
and the uncertainty on that correction, are large. On the other hand, one of the samples analyzed (TF) is clearly
modern because it was collected in 2018 from a pool of water that was not present in 2016. The initial 230Th/232Th
for this sample was, therefore, applied to the others (with a 25% 2-σ uncertainty) to refine the age calculations.
Results indicate that the CCC in WWC likely formed during the Holocene, and nearly all of the ages have error
estimates that overlap with modern (Table S5, Fig. S4). Thus these ages, imprecise as they are, are consistent with
CCC formation as a recent or current process in WWC. This result is significant because the majority of pub-
lished CCC ages are from the Late Pleistocene e.g.23,32, with only a few reports of Holocene ages24,28,33.
Two additional lines of evidence support the interpretation that the CCC in WWC is young. First, rafts of
calcite from sample YS-6 yielded a radiocarbon result of f Modern 1.111 ± 0.005, consistent with formation in the
late 20th Century when calibrated with the NH1 bomb curve in OxCal 4.434 (Fig. S5). Second, samples of rodent
fecal pellets from the ice beneath the surface lag of CCC yielded radiocarbon ages that calibrate to between AD
1560 and 1 83035 (median values) using the IntCal20 calibration c urve36. Together this evidence strongly sup-
ports the conclusion that CCC formation in WWC occurred in the late Holocene, and is still occurring today.
Scientific Reports | (2021) 11:6430 | https://doi.org/10.1038/s41598-021-85658-9 4
Vol:.(1234567890)www.nature.com/scientificreports/
Figure 4. A selection of photographs highlighting recent changes observed in WWC. (a) The sculpted surface
of the ice in 2016 illustrating intersecting cuspate forms produced by sublimating air currents. The total relief
is ~ 30 cm. CCC is visible as tan material on the ice surface. (b) A view showing the edge of the ice in 2016
where a ~ 20-cm-deep moat had formed at the contact with the rock wall of the cave. (c) The surface of the ice in
2018 illustrating how inflowing water had submerged nearly all of the former sculpted surface beneath new ice.
The red knife is located at the end of a ~ 1-m long section of a former crest in the ice that reaches barely above
the new ice surface. (d) Another view from 2018 where new ice formed from inflowing water has completely
inundated the former sculpted ice surface. Red knife is 10 cm long.
Winter Wonderland Cave as a unique natural laboratory for the study of CCC. Because of its util-
ity as a paleoclimate proxy, numerous studies have investigated CCC e.g.23,32,37,38. However, there are only a few
reports of CCC from locations outside E urasia21,39, and all of these are categorized isotopically as CCCfine. Winter
Wonderland Cave is, therefore, the first location in the Western Hemisphere where the unique paleoclimate
indicator CCCcoarse has been identified.
Furthermore, nearly all previous observations of CCC describe these minerals from locations where they
are present as loose concentrations of mineral grains on an ice-free cave floor23,28. Only twice has CCCcoarse been
reported in association with modern, perennial i ce33,38, and a recent comprehensive review noted that “Despite
increasing evidence for Holocene CCCcoarse, actively forming sites have not yet been observed”14. In WWC, CCCcoarse
with late Holocene to modern ages is present in association with perennial ice, making this cave an exceptional
natural laboratory in which to study these precipitates and their genesis.
Furthermore, firsthand observations indicate that the situation within WWC is consistent with the model for
the formation of CCCcoarse. During summer visits in 2014, 2015, and 2016, the cave was dry and the ice surface
exhibited a complex pattern of elongated ridges and troughs with local relief on the order of 30 cm (Fig. 4a-c)
formed as a result of s ublimation40. Short-term studies in an ice cave in Alberta, Canada suggest ice sublimation
rates on the order of 3 mm per y ear41, although rates up to 10× higher have also been r eported14. Either way,
extrapolation from these benchmarks suggests that the relief observed on the ice surface in 2016 reflects 101 to
102 years of sublimation without the addition of new water. In contrast, in summer 2018, and again in 2019, liquid
water entered the cave, filling many of the furrows, and freezing to create a new ice surface (Fig. 4d). Deeper pools
of water had lids of ice from 1 to 5 cm thick (Fig. 2b), precisely the mechanism proposed for the formation of
CCCcoarse16,23,25. This water ranged from clear to a deep yellow color, and CCC was observed on the floor of each
pool (Table S1). From the available data we cannot determine if this CCC precipitated from the water, or whether
it was present as a lag on the ice surface before the pools formed. However, the concentration of solutes in this
pool water was very high, with the highest values (K, Mg, and Ca > 200 mg/L) corresponding to the yellow color
(Fig. S6), consistent with conditions necessary for mineral precipitation through freezing-induced saturation15.
The change from 2016 to 2018 suggests that the thermal state of the epikarst has shifted, at least locally, to
allow liquid water to penetrate to the level of the cave (~ 100 m below the ground surface), or to produce melt-
water from ice farther back in inaccessible parts of the cave system. Under extensive permafrost conditions,
caves are unlikely to contain ice sourced from dripwater because the permafrost inhibits the downward move-
ment of liquid water42. Only when permafrost is degrading is it possible for liquid water to reach a cave where
Scientific Reports | (2021) 11:6430 | https://doi.org/10.1038/s41598-021-85658-9 5
Vol.:(0123456789)www.nature.com/scientificreports/
temperatures remain consistently subzero. The available evidence supports the interpretation that WWC and its
surrounding bedrock comprise a sporadic permafrost body that is currently undergoing this transition. Given
the presence of several meters of layered ice and associated CCC in WWC, it seems likely that this site has had
a complicated thermal history, during which lengthy (decadal scale or longer) intervals of permafrost condition
in the epikarst were interrupted by thawing events that allowed water to enter the cave and create new layers of
ice. The influx of water to the cave observed in the past two summers is, therefore, not entirely unprecedented.
Nonetheless, numerical modeling suggests that the time window between the onset of permafrost thaw in the
epikarst and ultimate loss of cave ice deposits can be relatively s hort43, and studies have noted that cave ice is
rapidly ablating in various locations around the w orld44. Future investigations in WWC should take advantage
of this singular opportunity to observe the formation of different types of CCC in (near) real time, with the goal
of improving our ability to use the presence of these features in currently ice-free caves as a dateable indicator
of past permafrost thaw23.
Conclusion
Winter Wonderland Cave in the Uinta Mountains of Utah contains cryogenic cave carbonate (CCC) associated
with perennial ice. Two types of CCC with different genesis are present and can be distinguished on the basis of
O and C isotope values. CCCfine is produced through open system freezing as a thin film of water flows over the
ice surface. In contrast, CCCcoarse is produced by (semi) closed-system freezing in deeper pools of water beneath
thickening lids of ice. These conditions arise during permafrost thaw, thus CCCcoarse records past episodes of
permafrost degradation. Available age control suggests that CCC formation occurred in this cave during the
late Holocene and may be a contemporary process. This cave is the first location in the world where such young
CCCcoarse has been found, and is the first cave in the Western Hemisphere where CCCcoarse has been identified.
Records of past cryosphere transitions are critical context for assessing contemporary changes in Arctic and
Alpine environments. Winter Wonderland Cave provides a singular opportunity to test and improve theories of
CCC genesis that will ultimately allow better insight into how permafrost responded to past climatic transitions.
Methods
Sample preparation and analysis. At Middlebury College, CCC samples were wet-sieved into < 75,
75–250, and > 250-µm size fractions. Each fraction was placed in a 50-mL centrifuge tube, and after fine sedi-
ment had settled, excess water was carefully decanted. Samples were then frozen in a − 40 °C freezer for 4 h. The
uncapped centrifuge tubes were then dried overnight in a Labconco FreeZone 6 L freeze dryer. The resulting
powder was lightly ground with a clean mortar and pestle and returned to each tube.
Scanning electron microscopy. A Tescan Vega 3 LMU scanning electron microscope (SEM) at Mid-
dlebury College was used to acquire images of the CCC in different grain size fractions. Samples were adhered
to metal disks with double sided tape, coated in gold palladium, and images were captured at different magni-
fications in order to compare CCC morphologies. Energy dispersive X-ray spectroscopy (EDS) was applied to
samples YS-3, YS-6, TS-2, CP, YP, and TF after carbon coating to determine if varying morphologies correspond
to different elemental compositions. The semi-quantitative elemental results were converted to weight % oxides
to differentiate between calcite, dolomite, and quartz. AZtecOne software was used to capture secondary elec-
tron and backscatter images and for elemental analysis. Weight % oxide data were transformed into structural
formulae for common minerals.
Grain size distribution. The grain size distribution of the < 75-µm fraction of each sample was determined
using a Horiba LA-950. In preparation for analysis, samples were dispersed in distilled water, mixed for 30 s
using a Vortex-T Genie 2, and sonified with an FS20D sonifying water bath for 1 min. A clean syringe was used
to transfer an aliquot of each sample to the Horiba. Sample runs were duplicated to assess consistency. Grain size
distribution data were presented as volume percentages of sand (coarse, medium, and fine), silt (coarse, medium,
fine, and very fine), clay (2–1 µm), and colloid (< 1 µm).
X‑ray diffraction. Samples of the 75–250-µm fraction, as well as rock samples powdered in a shatterbox,
were analyzed on a Bruker D8 Advance Model X-Ray Diffractometer at Middlebury College. The mineralogy
of several samples was compared across different size fractions (< 75 µm and 75–250 µm) to detect any compo-
sitional differences. As no obvious differences were detected, the fractions < 75 µm and 75–250 µm were used
interchangeably for future analyses depending on the volume of sample remaining. Nine samples were analyzed
as bulk powders from 2° to 50° 2Θ. Samples CP, YP, and TF were not large enough for a bulk powder analysis,
so they were transferred to a glass slide and analyzed as oriented powders, and scanned from 2°–40° 2Θ. The
diffractometer operated at 40 kV and 40 mA with a solid state detector, theta-theta goniometer, and CuKα radia-
tion. Mineral abundances were assessed using intensity ratios, and known mineral spectra peaks were identified
by comparison with standard reference patterns.
X‑ray fluorescence. Samples of the 75–250-µm size fraction were analyzed for major element composition
using X-ray fluorescence (XRF) at Middlebury College. Samples were ignited at 1000 °C for 30 min in a Leco
TGA-701 thermogravimetric analyzer prior to analysis to remove organics and interstitial water. Ignited samples
were ground to a fine powder and combined in a 10:1 ratio of lithium borate fluxing agent to sample (6.0 g flux-
ing agent and 0.6 g of sample). The combined sample and fluxing agent were melted in a Claisse LeNeo fluxer
at 1050 °C to form a glass disk. This process was repeated for samples YS-4, YS-6, TS-1, TS-2, and one bedrock
Scientific Reports | (2021) 11:6430 | https://doi.org/10.1038/s41598-021-85658-9 6
Vol:.(1234567890)www.nature.com/scientificreports/
sample; other samples did not contain sufficient mass in the desired particle size range for fluxing. Glass disks
were analyzed using a Thermo Scientific ARL QuantX energy dispersive (ED) XRF spectrometer to measure
major elements. A glass disk made from Standard Reference Material 88B (dolomitic limestone) was included in
each run to assess the accuracy of measurements. The analysis quantified the abundance of oxides, which were
converted to atomic abundances of major elements (Si, Ti, Al, Fe, Mn, Mg, Ca, Na, K, P).
Inductively coupled plasma mass spectrometry. Seven samples of the < 75-µm fraction (YS-3, YS-4,
YS-5, YS-6, TS-1, TS-2, and a bedrock sample), and an additional YS-4 sample of the 75–250-µm fraction, were
prepared for analysis with inductively coupled plasma mass spectrometry (ICP-MS) to determine the abundance
of trace and rare earth elements. Dried samples were combined in a 9:1 ratio of lithium metaborate fluxing agent
to sample (1.8 g L
iBO2 and 0.2 g sample). A Claisse LeNeo fluxer was used to melt the sample and fluxing agent
and dissolve the melt in 5% H NO3. Dissolved CCC and rock samples, along with samples of water from the cave
were analyzed with a Thermo Scientific iCAP Q ICP-MS at Middlebury College in conjunction with Qtegra
ISDS software. Calibration curves were generated for each run, and quality control with internal standards was
used to drift correct results after every five samples. Standard Reference Material 88B (dolomitic limestone) was
analyzed at the beginning and end of every batch of CCC samples, and National Institute of Standards and Tech-
nology (NIST) standard 1643f. (trace elements in water) was run in conjunction with water samples.
C and O stable isotopes. Eleven samples (all of < 75-µm size fraction except for CP and YP where the
75–250-µm fraction was used) were prepared for δ18O and δ13C stable isotope analysis in the Department of
Geology at Union College using a Thermo GasBench II connected to a Thermo Delta Advantage mass spectrom-
eter in continuous flow mode. Analytical uncertainties were better than 0.1 ‰ (1σ) for δ18O and 0.05‰ (1σ) for
δ13C. All values were calibrated against international standards and reported in permil (‰) relative to Vienna
Pee Dee belemnite (VPDB).
Eleven samples of bedrock, along with additional wet-sieved size fractions (< 75, 75–165, and 165–250 µm)
of samples YS-1 through YS-6, CP, and YP were analyzed in the Institute for Geology at the University of Inns-
bruck on a Thermo Scientific Delta V Plus isotope ratio mass spectrometer (IRMS) connected to a GasBench
II45. This system produces a typical precision (1σ) of ± 0.06‰ for δ13C and ± 0.08‰ for δ18O ref.46. All samples
were run in duplicate.
230
Th/234U disequilibrium dating. Five samples (YS-5, YS-6, CP, YP, and TF) were analyzed using U-Th
radiometric dating techniques in the Department of Earth, Atmospheric, and Planetary Sciences at the Mas-
sachusetts Institute of Technology. Two samples were divided into three replicates (YS-5 A, B, C and YS-6 A, B,
C) to assess reliability of the dating for young samples with a high potential for Th contamination. One replicate
for each sample did not produce a result due to a low yield in chemistry. Approximately 0.03 g of each sample
was combined with a 229Th-233U-236U spike, then digested and purified via iron coprecipitation and ion exchange
chromatography. U and Th were analyzed on separate aliquots using a Nu Plasma II-ES multi-collector ICP-MS
equipped with a CETAC Aridus II desolvating nebulizer following previously published protocols47. U-Th ages
were calculated using standard decay constants for 230Th, 234U, and 238U48–50. Ages were recalculated by assigning
sample TF an age of -61 years BP (where present is defined as AD 1950), given the observation that it formed
in the past few years. Reported errors for 238U and 232Th concentrations are estimated to be ± 1% (2-sigma) due
to uncertainties in spike concentration, whereas analytical errors are smaller. Variability of initial 230Th/232Th
throughout the cave is assumed to be ± 25% at 2-sigma.
Data availability
The dataset generated in this study has been deposited in the Hydroshare repository and will have the doi https://
doi.org/10.4211/hs.b5f0000096174af9af94fe62bd2065d6 after publication.
Received: 23 November 2020; Accepted: 4 March 2021
References
1. Adler, C., Huggel, C., Orlove, B. & Nolin, A. Climate change in the mountain cryosphere: impacts and responses. Reg. Environ.
Change 19, 1225–1228 (2019).
2. Overland, J. et al. The urgency of Arctic change. Polar Sci. 21, 6–13 (2019).
3. Mackintosh, A. N., Anderson, B. M. & Pierrehumbert, R. T. Reconstructing climate from glaciers. Annu. Rev. Earth Planet. Sci.
45, 649–680 (2017).
4. Lindgren, A., Hugelius, G., Kuhry, P., Christensen, T. R. & Vandenberghe, J. GIS-based maps and area estimates of northern
hemisphere permafrost extent during the last glacial maximum. Permafr. Periglac. Process. 27, 6–16 (2016).
5. Murray-Wallace, C. V. & Woodroffe, C. D. Quaternary Sea-Level Changes: a Global Perspective (Cambridge University Press, 2014).
6. Maslin, M., Seidov, D. & Lowe, J. Synthesis of the nature and causes of rapid climate transitions during the quaternary. Am. Geophys.
Union Geophys. Monogr. 126, 9–52 (2001).
7. Palazzi, E., Mortarini, L., Terzago, S. & Von Hardenberg, J. Elevation-dependent warming in global climate model simulations at
high spatial resolution. Clim. Dyn. 52, 2685–2702 (2019).
8. Zhang, J. Warming of the arctic ice-ocean system is faster than the global average since the 1960s. Geophys. Res. Lett. 32, 1–4 (2005).
9. Meier, W. N. et al. Arctic sea ice in transformation: a review of recent observed changes and impacts on biology and human activity.
Rev. Geophys. 52, 185–217 (2014).
10. Sommer, C. et al. Rapid glacier retreat and downwasting throughout the European Alps in the early 21st century. Nat. Commun.
11, 1–10 (2020).
Scientific Reports | (2021) 11:6430 | https://doi.org/10.1038/s41598-021-85658-9 7
Vol.:(0123456789)www.nature.com/scientificreports/
11. Marcer, M. et al. Inferring the destabilization susceptibility of mountain permafrost in the French Alps using an inventory of
destabilized rock glaciers. The Cryosphere Discussions 1–30 (2018).
12. Rudy, A. C. A., Lamoureux, S. F., Kokelj, S. V., Smith, I. R. & England, J. H. Accelerating thermokarst transforms ice-cored terrain
triggering a downstream cascade to the ocean. Geophys. Res. Lett. 44, 11–080 (2017).
13. Colucci, R. R. & Guglielmin, M. Climate change and rapid ice melt: suggestions from abrupt permafrost degradation and ice
melting in an alpine ice cave. Prog. Phys. Geogr. Earth Environ. 43, 561–573 (2019).
14. Žák, K. et al. Cryogenic mineral formation in caves. In Ice caves. 123–162 (Elsevier, 2018).
15. Killawee, J. A., Fairchild, I. J., Tison, J.-L., Janssens, L. & Lorrain, R. Segregation of solutes and gases in experimental freezing of
dilute solutions: implications for natural glacial systems. Geochim. Cosmochim. Acta 62, 3637–3655 (1998).
16. Žák, K., Urban, J., Cılek, V. & Hercman, H. Cryogenic cave calcite from several Central European caves: age, carbon and oxygen
isotopes and a genetic model. Chem. Geol. 206, 119–136 (2004).
17. Luetscher, M. & Jeannin, P.-Y. The role of winter air circulations for the presence of subsurface ice accumulations: an example from
Monlési ice cave (Switzerland). Theor. Appl. Karstol. 17, 19–25 (2004).
18. Luetscher, M. & Jeannin, P.-Y. A process-based classification of alpine ice caves. Theor. Appl. Karstol. 17, 5–10 (2004).
19. Perșoiu, A. Ice caves climate. In Ice Caves. 21–32 (Elsevier, 2018).
20. Žák, K., Onac, B. P. & Perşoiu, A. Cryogenic carbonates in cave environments: a review. Q. Int. 187, 84–96 (2008).
21. Clark, I. D. & Lauriol, B. Kinetic enrichment of stable isotopes in cryogenic calcites. Chem. Geol. 102, 217–228 (1992).
22. Lacelle, D., Lauriol, B. & Clark, I. D. Effect of chemical composition of water on the oxygen-18 and carbon-13 signature preserved
in cryogenic carbonates, Arctic Canada: implications in paleoclimatic studies. Chem. Geol. 234, 1–16 (2006).
23. Žák, K. et al. Coarsely crystalline cryogenic cave carbonate-a new archive to estimate the Last Glacial minimum permafrost depth
in Central Europe. Clim. Past 8, 1821–1837 (2012).
24. Luetscher, M., Borreguero, M., Moseley, G. E., Spötl, C. & Edwards, R. L. Alpine permafrost thawing during the Medieval Warm
Period identified from cryogenic cave carbonates. Cryosphere 7, 1073–1081 (2013).
25. Richter, D. K., Meissner, P., Immenhauser, A., Schulte, U. & Dorsten, I. Cryogenic and non-cryogenic pool calcites indicating
permafrost and non-permafrost periods: a case study from the Herbstlabyrinth-Advent Cave system (Germany). Cryosphere 4,
501 (2010).
26. Oliva, M. & Fritz, M. Permafrost degradation on a warmer Earth: challenges and perspectives. Curr. Opin. Environ. Sci. Health 5,
14–18 (2018).
27. Bryant, B. Geologic and Structure Maps of the Salt Lake City 1 x 2 Quadrangle, Utah and Wyoming (US Geological Survey, 1992).
28. Spötl, C. & Cheng, H. Holocene climate change, permafrost and cryogenic carbonate formation: insights from a recently deglaci-
ated, high-elevation cave in the Austrian Alps. Clim. Past 10, 1349–1362 (2014).
29. Jones, B. Calcite rafts, peloids, and micrite in cave deposits from Cayman Brae, British West Indies. Can. J. Earth Sci. 26, 654–664
(1989).
30. Meakin, P. & Jamtveit, B. Geological pattern formation by growth and dissolution in aqueous systems. Proc. R. Soc. A Math. Phys.
Eng. Sci. 466, 659–694 (2010).
31. Chaykovskiy, I. I., Kadebskaya, O. I. & Ák, K. Morphology, composition, age and origin of carbonate spherulites from caves of
Western Urals. Geochem. Int. 52, 336–346 (2014).
32. Orvošová, M., Deininger, M. & Milovskỳ, R. Permafrost occurrence during the last permafrost maximum in the western Carpathian
Mountains of Slovakia as inferred from cryogenic cave carbonate. Boreas 43, 750–758 (2014).
33. Bartolomé, M. et al. Characteristics of cryogenic calcites in Pyrenean ice caves of the Pyrenees (Northern Spain). Geogaceta 107–110
(2015).
34. Ramsey, C. B. Development of the radiocarbon calibration program OxCal. Radiocarbon 43, 355–363 (2006).
35. Munroe, J. S. First Investigation of Perennial Ice in Winter Wonderland Cave, Uinta Mountains, Utah, USA. Cryosphere 15, 863–881
(2021).
36. Reimer, P. J. et al. The IntCal20 northern hemisphere radiocarbon age calibration curve (0–55 cal kBP). Radiocarbon 62, 725–757
(2020).
37. Richter, D. K., Meyer, S., Scholz, D. & Immenhauser, A. Multiphase formation of Weichselian cryogenic calcites, Riesenberg Cave
(Süntel/NW Germany)[Weichselzeitliche mehrphasige Genese kryogener Calcite in der Riesenberghöhle des Süntel (Weserber-
gland/NW Deutschland)]. Z. Dtsch. Ges. Geowiss. 164, 353–367 (2013).
38. Colucci, R. R. et al. First alpine evidence of in situ coarse cryogenic cave carbonates (CCCcoarse). Geografia Fisica Din. Quat. 40,
53–59 (2017).
39. Lacelle, D., Lauriol, B. & Clark, I. D. Formation of seasonal ice bodies and associated cryogenic carbonates in Caverne de l’Ours,
Québec, Canada: Kinetic isotope effects and pseudo-biogenic crystal structures. J. Cave Karst Stud. 71, 48–62 (2009).
40. Bella, P. Morphology of ice surface in the Dobšiná Ice Cave. in 2nd International Workshop on Ice Caves. Proceedings. Slovak Caves
Administration, Liptovskỳ Mikuláš 15–23 (2007).
41. Marshall, P. & Brown, M. C. Ice in Coulthard Cave, Alberta. Can. J. Earth Sci. 11, 510–518 (1974).
42. Vaks, A. et al. Speleothems reveal 500,000-year history of Siberian permafrost. Science 340, 183–186 (2013).
43. Pielsticker, K. H. Höhlen und Permafrost–thermophysikalische Prozesse von Höhlenvereisungen während des Quartärs. Bochumer
Geol. Geotech. Arbeit 55, 187–196 (2000).
44. Kern, Z. & Perşoiu, A. Cave ice–the imminent loss of untapped mid-latitude cryospheric palaeoenvironmental archives. Quat. Sci.
Rev. 67, 1–7 (2013).
45. Spötl, C. & Vennemann, T. W. Continuous-flow isotope ratio mass spectrometric analysis of carbonate minerals. Rapid Commun.
Mass Spectrom. 17, 1004–1006 (2003).
46. Spötl, C. Long-term performance of the Gasbench isotope ratio mass spectrometry system for the stable isotope analysis of carbon-
ate microsamples. Rapid Commun. Mass Spectrom. 25, 1683–1685 (2011).
47. Burns, S. J. et al. Rapid human-induced landscape transformation in Madagascar at the end of the first millennium of the Common
Era. Quat. Sci. Rev. 134, 92–99 (2016).
48. Jaffey, A. H., Flynn, K. F., Glendenin, L. E., Bentley, W. C. & Essling, A. M. Precision measurement of half-lives and specific activi-
ties of 235U and 238U. Phys. Rev. C 4, 1889 (1971).
49. Edwards, R. L., Gallup, C. D. & Cheng, H. Uranium-series dating of marine and lacustrine carbonates. Rev. Mineral. Geochem. 52,
363–405 (2003).
50. Cheng, H. et al. Improvements in 230Th dating, 230Th and 234U half-life values, and U-Th isotopic measurements by multi-collector
inductively coupled plasma mass spectrometry. Earth Planet. Sci. Lett. 371, 82–91 (2013).
Acknowledgements
C. Walcott was crucial to the success of this challenging fieldwork. P. Ryan and J. Smith assisted with the ICP-MS
analysis. Thanks to D. Gillikin at Union College for help with the initial isotope measurements. Financial support
was provided by the Middlebury College URO.
Scientific Reports | (2021) 11:6430 | https://doi.org/10.1038/s41598-021-85658-9 8
Vol:.(1234567890)www.nature.com/scientificreports/
Author contributions:
J.M. designed the study, wrote the manuscript, and prepared the figures. K.K. participated in fieldwork, conducted
the geochemical and preliminary isotope analyses, and prepared samples for U/Th dating. C.S. oversaw isotope
analyses at the University of Innsbruck. D.M. and G.S.M. oversaw the U/Th dating at MIT. D.H. ensured safe
passage to and from the cave, and provided the mapping upon which Fig. 1 was based. All authors reviewed the
manuscript before submission.
Competing interests
The authors declare no competing interests.
Additional information
Supplementary information The online version contains supplementary material available at https://doi.org/
10.1038/s41598-021-85658-9.
Correspondence and requests for materials should be addressed to J.M.
Reprints and permissions information is available at www.nature.com/reprints.
Publisher’s note Springer Nature remains neutral with regard to jurisdictional claims in published maps and
institutional affiliations.
Open Access This article is licensed under a Creative Commons Attribution 4.0 International
License, which permits use, sharing, adaptation, distribution and reproduction in any medium or
format, as long as you give appropriate credit to the original author(s) and the source, provide a link to the
Creative Commons licence, and indicate if changes were made. The images or other third party material in this
article are included in the article’s Creative Commons licence, unless indicated otherwise in a credit line to the
material. If material is not included in the article’s Creative Commons licence and your intended use is not
permitted by statutory regulation or exceeds the permitted use, you will need to obtain permission directly from
the copyright holder. To view a copy of this licence, visit http://creativecommons.org/licenses/by/4.0/.
© The Author(s) 2021
Scientific Reports | (2021) 11:6430 | https://doi.org/10.1038/s41598-021-85658-9 9
Vol.:(0123456789)You can also read