Custom rates higher in 2019 - Iowa State ...
←
→
Page content transcription
If your browser does not render page correctly, please read the page content below
A Business Newsletter for Agriculture
Vol. 23, No. 5                        www.extension.iastate.edu/agdm                                       March 2019

              Custom rates higher in 2019
                 By Alejandro Plastina, extension economist, 515-294-6160, plastina@iastate.edu

P
      erforming custom work can        custom operators, and farm              The average rate and range for
      be an additional source of       managers. Twenty percent of the         each machine work function were
      income for farm operators        respondents performed custom            compiled into the survey as usual,
around the state. For others,          work, 10 percent hired work done,       as well as the median charge and
custom work is a full-time career.     47 percent indicated doing both,        number of responses for each
When labor is available, and           2 percent indicated doing none,                                  continued on page 2
another party has equipment,           and 21 percent did not indicate
renting equipment for a short-         whether they perform or hire             Handbook updates
term is also a common practice.        custom work.                             For those of you subscribing
While only a small portion of Iowa                                              to the handbook, the following
farmland is completely custom          The publication, which can
                                                                                updates are included.
farmed, many farm operations rent      be found online at the ISU
                                       Extension Store (FM 1698,                Iowa Farm Custom Rate Survey –
equipment or hire out one or two                                                A3-10 (5 pages)
operations on their farm each year.    https://store.extension.iastate.
                                       edu/Product/1792) or on the Ag           Lean Hog Basis – B2-41 (1 page)
The 2019 Iowa Farm Custom              Decision Maker website (File             Live Cattle Basis – B2-42 (1 page)
Rate Survey, www.extension.            A3-10, www.extension.iastate.            Feeder Cattle Basis – B2-43 (1
iastate.edu/agdm/crops/html/a3-        edu/agdm/crops/html/a3-10.               page)
10.html, canvassed 532 farmers,        html), provides rates for custom
                                                                                Please add these files to your
custom operators, and farm             work in the following categories:
                                                                                handbook and remove the out-
managers from the state, putting       tillage, planting, drilling, seeding,
                                                                                of-date material.
together a guide for pricing           fertilizer application, harvesting,
custom machine work. The survey        drying and hauling grain,                                      continued on page 6
questionnaire was mailed to 349        harvesting forages, complete
people by the U.S. Postal Service      custom farming, labor, and both
and 183 people via e-mail in           bin and machine rental. All rates
                                                                               Inside . . .
February 2019.                         include fuel, repairs, depreciation,    Market reality, stress and grief..........
                                       interest, labor, and all other          .............................................Page 3
A total of 121 usable responses,       machinery costs for the tractor and     Iowa Nutrient Reduction Strategy
giving 3,716 custom rates were         implement unless otherwise noted.       annual report available..........Page 4
received from Iowa farmers,

                                                                                Ag Decision Maker is compiled by
                                                                                         extension ag economists
                                                                                Ann Johanns, aholste@iastate.edu
                                                                                     extension program specialist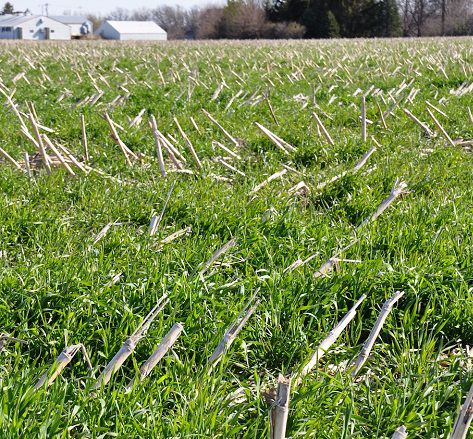
2 March 2019
Custom rates higher in 2019, continued from page 1
category. The average rate for a work function is and shape of fields, number of acres contracted,
calculated as the simple average of all responses for and the condition of the crop for harvesting. The
that work function. The median rate is the response availability of custom operators in a given area will
that splits all the ordered responses within a work also affect rates. Any custom rate should cover the
function (from smallest to largest) in half. A newly cost of operating the farm machinery as well as the
listed operation in 2019 is controlled burning of operator’s labor.
grass, CRP, or pasture per acre.
The survey found there was a 7 percent price increase
across all surveyed categories. The change from
2018 to 2019 varied across categories, with complete
harvesting and hauling for corn and soybeans
increasing by 6 percent and hired labor going up by
7 percent. Table 1 shows historic rates for a sample
of operations from the survey.
“Even with stable fuel prices and thin profit margins
in crop production in the horizon, the majority of
operations reported a rate increase.” said Alejandro
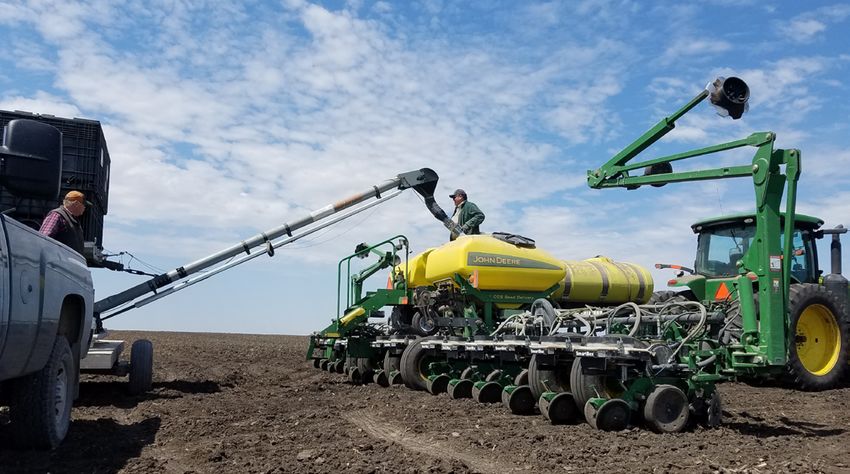
Plastina, assistant professor and extension economist Any custom rate should cover the cost of operating the
farm machinery as well as the operator’s labor.
with ISU Extension and Outreach. “I believe this is
more indicative of part-time custom workers paying
more attention to covering all costs and actually The Ag Decision Maker website offers a Decision
profiting from this activity than of a substantially Tool, www.extension.iastate.edu/agdm/crops/xls/
higher demand for their services.” a3-29machcostcalc.xlsx, to help custom operators
and other farmers estimate their own costs for
The reported rates are expected to be charged or paid specific machinery operations. If you are interested
in 2019, including fuel and labor. The average price in joining the 2020 Custom Rate Survey mailing
for diesel fuel was assumed to be $2.94 per gallon.
list, send your mail or e-mail address to:
The values presented in the survey are intended only
Alejandro Plastina, Iowa State University,
as a guide. There are many reasons why the rate
Department of Economics, 478E Heady Hall,
charged in a particular situation should be above
518 Farm House Lane, Ames, IA 50011-1054;
or below the average. These include the timeliness
call 515-294-6160; or email plastina@iastate.edu.
with which operations are performed, quality and
special features of the machine, operator skill, size
Table 1. Average farm custom rates reported for Iowa
Operation 1978 1988 1998 2008 2014 2016 2018 2019
Chisel plowing, per acre $6.00 $8.40 $9.65 $13.70 $16.15 $16.45 $17.60 $18.35
Planting, no attachments, per acre $4.40 $6.80 $8.85 $13.20 $17.85 $18.55 $19.15 $20.40
Spraying, per acre $2.40 $3.50 $4.00 $5.60 $6.90 $6.80 $6.60 $7.25
Combining corn, per acre $16.20 $22.00 $23.40 $28.10 $34.15 $34.75 $34.80 $35.95
Combining soybeans, per acre $14.00 $20.60 $22.55 $27.10 $34.15 $34.05 $34.00 $35.10
Baling square bales, per bale $0.21 $0.29 $0.36 $0.48 $0.65 $0.66 $0.67 $0.68
Custom farming, corn, per acre $58.00 $71.00 $75.80 $94.10 $136.10 $129.95 $128.80 $132.25
Custom farming, soybeans, per acre $50.00 $65.00 $70.65 $83.00 $121.00 $116.15 $117.10 $121.20
Machinery operating wage, per hour $3.50 $5.10 $7.20 $11.70 $13.90 $15.05 $16.30 $17.20
Source: Iowa State University Extension and Outreach, Iowa Farm Custom Rate Surveys, FM 1698.
3                                       March 2019

                            Market reality, stress and grief
                                  By Fred Hall, 712-737-4230, fredhall@iastate.edu; Larry Tranel, 563-
                                  583-6496, tranel@iastate.edu, Iowa dairy specialists, ISU Extension and
                                  Outreach, www.extension.iastate.edu/dairyteam/

This is the first in a series from the ISU Extension and Outreach Dairy Team on Dealing with Farm Stress.
More farm stress resources can be found at: www.extension.iastate.edu/dairyteam/familyfarm-stress.

M
          arket Reality is an understanding of past            Dairy producers have heard time and again they
          market cycles, current market forces, and            need to use records to fine-tune their management
          future market opportunities based on a               to find every penny of margin. Getting back to the
complex set of economic, political, cultural, and              basics– knowing their cost of production; feeding
other situations that affect farm incomes at any given         and breeding efficiency; producing the most pounds
point in time. Market Stress is an extended time               of solids per hundredweight of milk; improving the
where low product prices or high input costs cause             milking system to increase labor efficiency; breeding
negative margins and/or negative cash flow. Market             superior females for needed herd replacements and
Grief is a reaction to the loss of something (profit           breeding the lower quality females to beef bulls that
or way of life) that is loved and cherished because            generate added revenue. Many have done all that and
finances or cash flow do not work out for extended             more, and the numbers still may not work out.
periods of time. It may be an exasperation of a “Holy
                                                               Dairying might get even tougher in reality as
Cow” to a situation beyond control. Alternatives
                                                               markets change. Exports might not clear additional
seem limited or are difficult to adjust to or realize in
                                                               milk and processing capacity sees constraints.
the new market norm.
                                                               Markets are not always humane–providing a price to
At times, farmers get ravaged by the economy. Dairy            balance supply and demand, even if low. Benefits of
prices plummet from time to time, which can last               a free market do not come without cost. A sad reality
for years. Crop and other livestock prices often do            is the probability of an extended dairy recession
not fare any better, minimizing alternatives. In 2014,         even worse than the past few years. Somebody
for example, dairy farmers were getting over $20               or something needs to clear the market, meaning
per hundredweight for their milk. In late 2018, that           producers continue to leave.
number sat below $14 cwt. The 2018 average was
the lowest average of that four year timeframe–a               Making the Tough Choices and Seeking
timeframe already previously stressful!                        Marketing Options. While many producers do not
                                                               use a risk management tool, they are available and
To put this in perspective, the 2018 breakeven price           can be useful. For example, the 2018 Farm Bill gives
for many Iowa milk producers was well over $17.00              dairy producers new market protection options,
cwt. With the 2018 cow and heifer prices going                 which, in reality, may actually protect the over-
below $40 per cwt., selling heifers meant losing more          supply of milk. It renames the Margin Protection
than half the cost of growing them. In a depressed             Program for Dairy (MMP-Dairy) to Dairy Margin
cow market, selling cows may mean forfeiting lots of           Coverage Program (DMC) and permits participation
the value of milk cows on the balance sheet. So, how           in both DMC and Livestock Gross Margin for Dairy
does one spell stress and grief?                               (LGM) on the same production. DMC and the Dairy
                                                               Revenue Protection program may also be used
  Farm market stress and grief can cause feelings              together. The DMC program is vastly improved
  of being overwhelmed, depressed, immobilized,                from the old MPP and when combined with LGM
    lack of energy, or loss of hope. This can lead             coverage, should be considered by every dairyman,
   to exhibits of anxiety, anger and loss of good              no matter how many cows they milk.
   decision-making ability. SEEK HELP! PLEASE!

                                                                                                  continued on page 4
4                                         March 2019

Market reality, stress and grief, continued from page 3

Every farm needs an operating plan, and as                    Hopefully, a new acceptance is attained that
important, an exit strategy– setting a point where            gives hope to meaningful life–a life that maybe just
one is no longer willing to accept equity loss and will       different than before.
exit the industry or reallocate resources to another
enterprise. The easiest route is to do nothing and                With market stress and grief, people often
hope things resolve themselves. Unfortunately, that              wonder, what can I do to get out of this mess
hardly ever works. Remember, there is life after                  or be able to save the lifestyle and assets?
the cows leave the barn or even after people leave               The important part is to recognize when to
the farm. It is a tough reality, filled with stress and          seek help and make informed decisions, not
maybe even grief, but is often a necessary outcome in            out of confusion and emotion, but objective
times of trouble.                                                reality, even when confusion and emotions
                                                                               are running high.
Farmers need to be resourceful when considering
how else resources can be used. Farm alternatives
or off-farm jobs might not be a great choice,
but a possibility needing consideration. Often, a
conversation with someone who has gone through
an “exit” can be helpful. Bringing others, including
extension specialists, into the discussion might
help to bring out ideas that otherwise might not be
considered.

Hopefully, all the market reality, stress and grief
can be worked through: making tough choices,
reaching out to others, exploring options, and giving
life a new reality.

Iowa Nutrient Reduction Strategy annual report available
      By Brian Meyer, College of Agriculture and Life Sciences, 515-294-0706, bmeyer@iastate.edu;
      Lexi Marek, Iowa Department of Agriculture and Land Stewardship, 515-281-5322; Alex Murphy, Iowa
      Department of Natural Resources; 515-729-7533, Alex.Murphy@dnr.iowa.gov

I
   owa State University, the Iowa Department of               “The Nutrient Reduction Strategy is a very important
   Agriculture and Land Stewardship and the Iowa              and critical effort working to enhance water quality,
   Department of Natural Resources announced                  and to see positive changes and results is gratifying,”
that the Iowa Nutrient Reduction Strategy Annual              said Bruce Trautman, acting director of the Iowa
Progress Report is now available to the public at             DNR. “We are continually committed to improving
www.nutrientstrategy.iastate.edu/documents.                   and protecting water quality, and with partnerships
                                                              developed through the strategy, we are making great
“We are committed to robust measuring and                     strides, but we still have work to do to meet the
reporting around each of the steps necessary to               goals.”
reach our water quality goals,” said Mike Naig, Iowa
Secretary of Agriculture. “This report shows progress         The annual report provides progress updates on
in each of the areas measured. We are encouraged              point source and nonpoint source efforts to reduce
by the efforts of the public and private sectors to           nitrogen and phosphorus loads leaving the state.
implement conservation practices across the state,            The report follows the “logic model” framework that
and are working to build on this success going                identifies measurable indicators of desirable change
forward.”                                                     that can be quantified, and represents a progression
                                                              toward the goals of achieving a 45 percent reduction
                                                              in nitrogen and phosphorus loads.
                                                                                                   continued on page 5
5                                      March 2019

Iowa Nutrient Reduction Strategy annual report available, continued from page 4

                                                                                               • Since 2013, the Iowa Nutrient Research
                                                                                                 Center at Iowa State University has funded
                                                                                                 $8.7 million for 76 research projects led

                                                          NRCS/SWCS photo by Lynn Betts
                                                                                                 by scientists at the state’s three Regents
                                                                                                 universities. The research evaluates the
                                                                                                 performance of current and emerging nutrient
                                                                                                 management practices and helps to provide
                                                                                                 recommendations on implementing the
                                                                                                 practices and developing new practices.
                                                                                               • Of the 154 municipal wastewater plants and
     Report identifies $500 million in public and                                                industrial facilities required to assess their
           private water quality funding                                                         nutrient removal capacity, 125 have been
                                                                                                 issued new permits and 82 of those have
The framework recognizes that in order to affect                                                 submitted feasibility studies on potential
change in water quality, there is a need for increased                                           technology improvements to reduce nutrient
inputs, measured as funding, staff, and resources.                                               loss.
Inputs affect change in outreach efforts and human
behavior. With changes in human attitudes and                                                  • The Conservation Infrastructure Initiative
behavior, changes on the land may occur, measured                                                engaged a broad cross-section of leaders
as conservation practice adoption and wastewater                                                 within and outside of the agriculture industry
treatment facility upgrades. Finally, these physical                                             to address barriers, innovative market-based
changes on the land may affect change in water                                                   solutions, and new revenue streams to improve
quality, which ultimately can be measured through                                                water quality.
both empirical water quality monitoring and through                                           Human - outreach efforts
modeled estimates of nutrient loads in Iowa surface                                            • Partners reported 511 outreach events focused
water.                                                                                           on water quality were held in 92 counties.
“The report highlights the increase in activities in                                           • Partners reported 45,800 participants attended
the five years since the release of the Iowa Nutrient                                            an outreach event.
Reduction Strategy, which is encouraging,” said
Matt Helmers, Director of the Iowa Nutrient
                                                                                              Land - conservation practice adoption
Research Center at Iowa State University. “But, it                                             • Statewide estimates indicate 760,000 acres of
is also important to recognize the scale of change                                               cover crops were planted in 2017, including
required to meet nutrient reduction goals, and the                                               330,000 acres enrolled in government cost
need for increased levels of practice adoption and                                               share programs.
implementation throughout the state.”                                                          • 1.8 million acres of land were enrolled in the
                                                                                                 Conservation Reserve Program, about 200,000
Highlights from the report                                                                       acres more than in 2011.
Inputs - funding, staff, and resources
  • $512 million in private and public sector                                                  • Statewide mapping of six types of conservation
    funding for Nutrient Reduction Strategy efforts                                              practices was completed. An analysis of the
    identified during the 2018 reporting period.                                                 results shows the value of this public and
                                                                                                 private investment in conservation would
  • Long-term funding is now in place that                                                       be $6.2 billion in today’s dollars. Additional
    will provide an additional $270 million                                                      analysis is underway to quantify the water
    for conservation practices and wastewater                                                    quality impact of these practices in terms of
    treatment upgrades over the next 12 years.                                                   reduced sediment and phosphorus loads to
                                                                                                 Iowa streams.

                                                                                                                                continued on page 6
6 March 2019
Iowa Nutrient Reduction Strategy annual report available, continued from page 5
Water quality monitoring and estimates The annual report works towards evaluating progress
• Iowa has an extensive water quality monitoring using an updated baseline that is consistent with the
system in place, including 32 more real-time Gulf of Mexico Hypoxia Task Force and follows the
nitrate sensors deployed by the University of direction of the Iowa Legislature. The baseline looks
Iowa’s Hydroscience and Engineering - IIHR at the 1980-1996 time period. In future reports, the
than in 2016. baseline period will be used to measure progress
toward water quality goals identified by the Iowa
• At least 88 percent of Iowa’s land drains Nutrient Reduction Strategy.
to a location with water quality sensors
installed and maintained mainly by the The annual report was compiled by the College
Iowa Department of Natural Resources, of Agriculture and Life Sciences at Iowa State
Hydroscience and Engineering - IIHR, and the University with support from the Iowa Department
U.S. Geological Survey. of Agriculture and Land Stewardship and the Iowa
Department of Natural Resources. A draft of the
• Surface water samples are collected regularly report was shared with the Iowa Water Resources
at 302 locations, plus 582 edge-of-field Coordinating Council in November and their
sites by the Iowa Soybean Association and feedback was incorporated into the recently finalized
Agriculture’s Clean Water Alliance. report.
Updates, continued from page 1
Internet Updates
The following Information Files and Decision Tool have been updated on www.extension.iastate.edu/agdm.
2014-2023 Payment Data by County for ARC-CO and PLC – A1-33 (Decision Tool)
Commodities Versus Differentiated Products – C5-203 (2 pages)
Demand – C5-204 (3 pages)
Economies of Scope – C5-205 (1 page)
Economies of Size – C5-206 (2 pages)
Current Profitability
The following tools have been updated on www.extension.iastate.edu/agdm/info/outlook.html.
Corn Profitability – A1-85 Season Average Price Calculator – A2-15
Soybean Profitability – A1-86 Ethanol Profitability – D1-10
Iowa Cash Corn and Soybean Prices – A2-11 Biodiesel Profitability – D1-15
Permission to copy
Iowa State University Extension and Outreach does not discriminate on the basis of age, disability, Permission is given to reprint ISU Extension
ethnicity, gender identity, genetic information, marital status, national origin, pregnancy, race, color, and Outreach materials contained in this
religion, sex, sexual orientation, socioeconomic status, or status as a U.S. veteran, or other protected publication via copy machine or other copy
classes. (Not all prohibited bases apply to all programs.) Inquiries regarding non-discrimination policies technology, so long as the source (Ag Decision
may be directed to the Diversity Advisor, 2150 Beardshear Hall, 515 Morrill Road, Ames, Iowa 50011, Maker Iowa State University Extension and
515-294-1482, extdiversity@iastate.edu. All other inquiries may be directed to 800-262-3804. Outreach) is clearly identifiable and the
appropriate author is properly credited.You can also read