Investor Presentation - November 2018 - Imagica

 
CONTINUE READING
Investor Presentation - November 2018 - Imagica
Investor Presentation – November 2018
Investor Presentation - November 2018 - Imagica
Safe Harbour

This presentation and the accompanying slides (the “Presentation”), which have been prepared by Adlabs Entertainment
Limited (the “Company”), have been prepared solely for information purposes and do not constitute any offer,
recommendation or invitation to purchase or subscribe for any securities, and shall not form the basis or be relied on in
connection with any contract or binding commitment whatsoever. No offering of securities of the Company will be made
except by means of a statutory offering document containing detailed information about the Company.

This Presentation has been prepared by the Company based on information and data which the Company considers
reliable, but the Company makes no representation or warranty, express or implied, whatsoever, and no reliance shall be
placed on, the truth, accuracy, completeness, fairness and reasonableness of the contents of this Presentation. This
Presentation may not be all inclusive and may not contain all of the information that you may consider material. Any
liability in respect of the contents of, or any omission from, this Presentation is expressly excluded.

This presentation contains certain forward looking statements concerning the Company’s future business prospects and
business profitability, which are subject to a number of risks and uncertainties and the actual results could materially differ
from those in such forward looking statements. The risks and uncertainties relating to these statements include, but are
not limited to, risks and uncertainties regarding fluctuations in earnings, our ability to manage growth, competition (both
domestic and international), economic growth in India and abroad, ability to attract and retain highly skilled professionals,
time and cost over runs on contracts, our ability to manage our international operations, government policies and actions
regulations, interest and other fiscal costs generally prevailing in the economy. The company does not undertake to make
any announcement in case any of these forward looking statements become materially incorrect in future or update any
forward looking statements made from time to time by or on behalf of the company.

                                                                                                                            2
Investor Presentation - November 2018 - Imagica
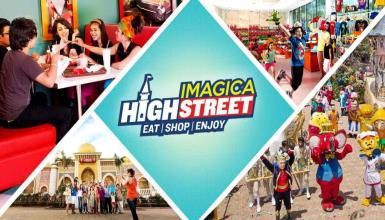
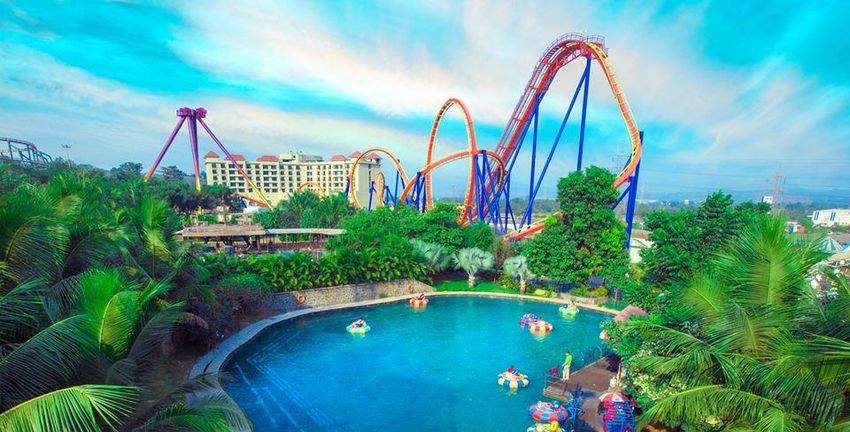
Imagica : Heralding a new era in outdoor entertainment

• India’s first true theme park and family entertainment destination, which has deployed
  the latest technology from reputed international vendors and conceptualizing unique
  and indigenous themes customized to appeal to the rapidly growing Indian consumers.

• A ‘mega-tourism’ project recognized by Govt. of Maharashtra, situated off the Mumbai-
  Pune Expressway ensuring excellent connectivity to key metros of Mumbai, Pune and
  other cities – one of the best catchments in India

• Has become a well established brand and a preferred entertainment destination serving
  >7.5mn visitors within a short span of time.

• Project conceptualized and pioneered by Indian media and entertainment entrepreneur,
  Manmohan Shetty, having over 30 years of rich & varied experience.
   – Promoter’s impeccable credentials have gone a long way in successful execution and financial
     closure for this first of its kind venture in India

                                                                                              3
Investor Presentation - November 2018 - Imagica
Management Team

            Mr. Manmohan Shetty,                 Col Ashutosh Kale,
                                                                                                  Mr. Mayuresh Kore,
        Chairman & Managing Director                 Joint CEO         Mr. Dhimant Bakshi,
                                                                                                 Chief Financial Officer
    A veteran from the film industry          Over two decades of          Joint CEO
                                                                                                 15+ years of
    A Pioneer in film processing, ‘IMAX’       experience in the      Over two decades of
                                                                                                 experience in Project
     technology & Multiplex Revolution in       safety and security    experience in Retail
                                                                                                 Finance, Treasury and
     India                                      largely serving the    Has worked with          Investment Banking
                                                Indian Army            Future Group, Reliance
                                                                                                 Has worked with
                                               He has worked with     Retail, Shoppers Stop,
                                                                                                 Centrum Finance Ltd,
                                                Go Air and has been    Globus & Piramyd
                                                                                                 Walkwater Media Ltd.
                                                awarded by United      Retail.
                                                                                                 and Adlabs Films Ltd
                                                Nations

                                                                                                                           4
Investor Presentation - November 2018 - Imagica
India’s First and Only Global Scale Theme Leisure &
  Entertainment Destination

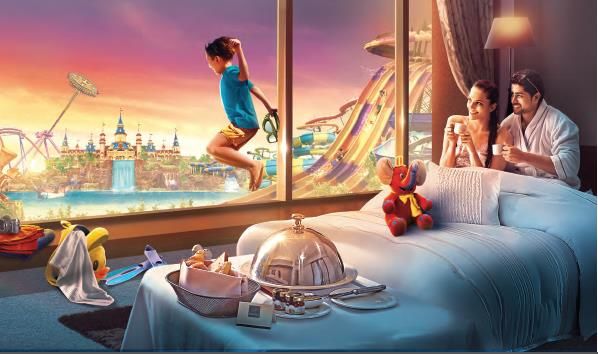
  2013: Theme Park                                                           2015: Novotel Imagica
  All-weather theme park with 25 rides and attractions targeted at           287 keys family hotel to be managed under the
  visitors of all age groups with an estimated daily capacity of             name “Novotel Imagica Khopoli”
  15,000 guests
                                    2013                                                           2015
                                                          2014

2014: Water Park                                                                                              2018
                                                                                     2016
A Mykonos theme based water
park with 14 water slides and
wave pools with an estimated
daily capacity of 5,450 guests

                                   2016: Snow Park                                          2018: House of Stars
      India’s Largest Snow Park with 100% natural snow               India’s First Bollywood Hall of Fame with interactive
                     spread over 15,000 sqft. snow area                           life-size figurines of leading film actors

                                                                                                                         5
Investor Presentation - November 2018 - Imagica
Key milestones & customer testimonials

         Achieved a milestone                  Non-catchment including                            Highest ever footfall on
                                                  Gujarat activation                                  New Years Eve
        of entertaining   over
                                                                                                  i.e. 31st December 2016
          7.5mn guests                         has resulted in    ~35%
             since launch
                                                contribution for FY17                             of   over 12,000

Theme Park Rating                TRIPADVISOR
                                                 “I visited lots of amusement park in America, London, Singapore and Malaysia but
                                  5/5           Imagica is the best amusement park in India...i visited last week with my family and
                                                 I really enjoyed, spl. Scream machine,nitro and deep space is the excellent rides in
                                  (Ratings)      imagica..very safe rides, reasonable price compare to other countries amusement
                                                           park, food is very costly and not good also..but park is fantastic...”

                                  5/5              “A must visit place if you stay in Mumbai Pune, opt for the Ghar Se Ghar Tak
                                                           Package, it includes everything and it is value for money.”
Water Park Rating                 (Ratings)

                                                 “Visited today with my two grown up sons, got there just on opening so got into
                                  4/5             rides pretty easy, later in the day there were longer rides for some slides. They
                                                were all top class rides and great fun. We also ate a thalli meal which seemed good
                                                value and was nice. Even though it rained the whole time we were there we had a
                                  (Ratings)
                                                                       good day, spending solid 5 hours wet... ”

                                                                                                                                        6
Investor Presentation - November 2018 - Imagica
Vision 2021

                                 FY 2021

                               2.0-2.4 mn

          FY 2018*
        1.72 mn
                     Revenue   Rs. 300-325 cr
        Rs. 201 cr

        Rs. 56 cr

                               Rs. 110-125 cr

 *Excl. Hotel

                                                7
Investor Presentation - November 2018 - Imagica
Demographics and macroeconomics: Strong cues for
growth in consumer discretionary spending

                                            Robust GDP growth                      Young population                    Rising per capita incomes

                                                                6.4%                                                                                   182,4

                                                                                                                  Nominal GDP per capita
                                                     5.4%                                                                                               26
                                                                                                                                           73,78
                                       4.4%                                           34%     31%                                            0
         Favorable
       Demographics

                                                                                                                          (INR)
     Strong growth, working                                                                 35%
       population & rise in
        household incomes
                                                                               0-14 Years         15 - 34 Years

                                       2015          2016       2017           > 34 Years                                                  2011            2019

                                     Growing consumerism – share of spending                      GDP Per Capita x 2 = Discretionary Spend 10X

                                                                                                  Discretionary Spend
                                            2005                       2012                       Basic Spend
                                                                                                                                                   1,000
  Shift in consumption
                                     31%                         40%         42%                                                10X
         patterns
                                               54%                                                       100
   Growth in leisure activities      15%
  outpacing growth in GDP per                                          18%                                                                         1,000
                                                                                                         900
             capita
                                  Staples       Discretionary     Consumer Services
                                                                                                  GDP p.c. $ 1,000                          GDP p.c. $ 2,000

                                                                                                                                                                  8
Investor Presentation - November 2018 - Imagica
India – Still an underpenetrated market

             Primary Catchment Potential                             Secondary Catchment Potential

                        25.60 mn                                                   53.00 mn

                    2.56 mn (assuming                                         2.65 mn (assuming 5%
                    10% activation rate)                                         activation rate)

                           1.10                                                      0.40
                          million                                                   million

                  Addressable Population       Potential Annual Penetration         Current Annual Footfalls

 • Addressable population for the primary and secondary catchment are 25.6mn and 53mn, respectively
 • Till now, Imagica has only activated 17% of the of the addressable population in the catchments
 • Currently, Annual activation is at 4% and 2% for primary catchment and secondary catchment, respectively
 • It has a potential to activate 10% and 5% of the primary and secondary catchment, which would lead to an
   annual unique visitation of 2.56mn and 2.65mn for primary and secondary catchment, respectively

                                                                                                               9
Investor Presentation - November 2018 - Imagica
India lacks a complete family entertainment destination
 Imagica has a critical first mover advantage

                  Significant gap in market for World Class Live Entertainment Destinations in India
                             Consumer Options         Availability           Concepts                     Average Cost

                                                                                                     INR.800- INR.1,000 per
                                                                         The Comedy Store,
                                  Theatre                 Yes                                        person for 2-3 hours of
                                                                     Prithvi Theatre, NCPA etc.
                                                                                                         entertainment
                                                                                                     INR.800-1,000/- with no
                           Standard Amusement                           Essel World & Water
                                                          Yes                                       major attractions and they
                                  Parks                                       Kingdom
                                                                                                     lack scale and ambience

                           Family Entertainment                      Malls (Retail, Dining, Pubs,   INR.1000/- onwards for a
                                                          Yes
                               Destinations                                   Cinema)                       family

                            Weekend Get away                         Aamby Valley City, Lavasa,
Lack of                                                   Yes                                       INR 3,000 onwards per day
                              Destinations                             Kashid, Lonavala etc.
Entertainment
Destinations in          Full Fledged Entertainment
and around                                                                                          Towards the highest end
                          Destination with Theme
Mumbai                                                    No                Non Existent             of live entertainment
                          park, Water park, Retail,
                                                                                                           value chain
                                  Dining etc.

        Imagica enjoys high entry barriers in this space due to factors such as large land parcel
     requirements, sizable capital investment, intricate design and creative conceptualization, long
                 construction and set-up period, thus deterring potential competition

                                                                                                                           10
Key gears for growth

                                    Exploit
                                   Operating
                                   Leverage

                        Higher
                         Non-
                       ticketing
                       Revenue

                                          Drive Footfall

                                                           11
Strategies to Drive Footfalls – Targeting all income
segments

STRATEGIES FOR EACH INCOME SEGMENT

                             Activate higher spending and time at the parks
                             •   Adding more options for increased spending and time at the park like
                                 Snowpark, indoor gaming zone etc.
                             •   Pushing convenience products and family packages like Express
                                 tickets, VIP packages
                  01         •   Late evening events to add more entertainment options
                             •   Widespread food and drinking options
                                      Create reasons for visitation
                                      •   Engaging events during festive seasons
                                      •   Early bird discounts during Tuesdays and Wednesdays
             02                       •   Attractive packages to suit budgets and needs like ghar-se-
                                          ghar-tak, bus pick-up & drop service
                                                 Bespoke solution as per wallet size
                                                 •   Tie-ups with organizations of large workforce
        03                                       •   Custom offers for low income group

                                                                                                     12
Differentiated Product - Entertainment
Imagica continue to add new attractions and entertainment

    1st of its kind          India’s first official    1st of its kind novel        India’s first 3D +
 association in India        ‘Bollywood Hall of         concept in India           Augmented Reality
  of a popular TV/                  Fame’              offering an unique                 Park
 movie character in         - In association with        experience and            - World of optical illusion
    a Theme park            India’s best production     multiple facilities          with state-of-the-art
                            houses such as Dharma        under one roof                gallery of canvas
                            Productions, Fox Star                                  paintings and 3D images
  - Permanent home for      Studios India, Arka        - Provides  ONE a glimpse
  Chhota Bheem – most       Mediaworks and more        into a world of non-stop
  popular kid’s character                              entertainment, partying,    - Subjects an individual to
  in India                  - Indoor entertainment
                                                       shopping and varied food    unique trickery by getting
                            attraction - interactive
  - Chhota Bheem &                                     and beverage options to     lost in the world of visual
                            life-size figurines of
  friends – join Stars of                              choose from at a nominal             deception
                            popular Bollywood actors
  Imagica (Grand Imagica    amidst iconic movie        price point                 - For a perfect time with
  Parade)                   scenes                                                  your friends and family

                                                                                                                 13
Strategies to Drive Footfalls – Catchment-wise

                                             Secondary Catchment
                                             (Ahmedabad, Surat, Rajkot,
                                               Baroda, Nashik, Nagpur)

                                                   Increase current
     Primary                                         penetration

    Catchment
   (Mumbai & Pune)

  Drive penetration
 and repeat visitation
                                                 Non-Catchment (Indore,
                                                  Jaipur, Delhi, Bangalore,
                                                         Hyderabad)

                                                   Marginally improve
                                                      penetration

                                                                              14
Strategies to Drive Footfalls – Catchment-wise
Primary Catchment

                        Primary Catchment (Mumbai & Pune)
                        Drive penetration and repeat visitation
                       •   Easing access to transportation
                       •   Maintain newness by adding event based propositions
                       •   Increasing Tie-ups with mid-to-large corporates
                       •   Drive youth footfall with college specific products
                       •   Increase brand tie-ups and alliances

                                 Primary Catchment Potential (in Million)

                                    133%                                            25.60

                                                       2.56

               1.10

      Current Annual Footfalls             Potential Annual Penetration     Addressable Population

                                                                                                     15
Strategies to Drive Footfalls – Catchment-wise
Secondary Catchment

                        Secondary Catchment (Ahmedabad, Surat, Rajkot, Baroda, Nashik, Nagpur)
                        Increase current penetration
                       •   Increase base of agents in each city
                       •   Improve corporate tie-ups
                       •   Insertion of Imagica travel packages
                       •   Increasing awareness through marketing
                       •   Tie-ups with Budget Hotels near Imagica

                                 Primary Catchment Potential (in Million)

                                    563%                                            53.00

                                                       2.65

               0.40

      Current Annual Footfalls             Potential Annual Penetration     Addressable Population

                                                                                                     16
Strategies to Drive Footfalls – Catchment-wise
Non-Catchment and Repeat Visitation

                      Non-Catchment (Indore, Jaipur, Delhi, Bangalore, Hyderabad)
                      Marginally improve penetration
                     •   Increase base of agent network
                     •   Increasing awareness through marketing
                     •   Tie-ups with budget hotels near Imagica
                     •   Increase corporate travel desk tie-ups
                     •   Create Imagica packages along with nearby attractions

        Drive Repeat Visitation
        Increase the reasons to revisit
        • Addition of new attractions like Snowpark, Increase
          in events and added attractions
        • Pushing multi visit products like Imagica Passport

                                                                                    17
Strategies to enhance non-ticketing revenues

                       • Increase the per capita spending on F&B
                            • Promoting combo-packages including meals at the parks
                            • Adding beverage portfolio
         Food &        • Promoting concepts like breakfast and dinner with characters
        Beverages      • Catering to evening events

                       • Leveraging existing Intellectual Property
   Merchandise         • Out of park sales on Imagica stores, website and other online
     and IP
                         portals
                       • Expanding product portfolio
       Sponsorship,
       alliances and   • Destination for weddings and events (corporate offsite etc)
           events      • Sponsorship and alliances with other brands
                       • Brand activation at the park

                                                                                         18
Exploit Operating leverage

   3000                                                  25.5%                   26.5%        30%
                                     17.1%                                                    20%
   2500
                10.8%
                                                                                              10%
   2000
                                                                                              0%
   1500
                                                                                              -10%
                                          2,340               2,390                   2,363
   1000              1,894        1,874                                                       -20%
             1,528                                    1,541                   1,476
    500                                                                                       -30%

      0                                                                                       -40%
                 FY15                FY16                   FY17                 FY18
                               Total Fixed Cost   Revenue          EBITDA %

• AEL has a high operating leverage, with >80% of current costs being fixed in nature
• Post recoupment of fixed costs, EBITDA growth can be exponential
• Management continues to put its efforts on cost rationalization – scope for further reducing
  utility costs etc.

                                                                                                     19
Financials Section

                     20
Footfalls during Q2 FY19

                                                      Total Number of Guests
                                                                                      575,404                                 588,597
   539,187
                                           515,555
                                                                                                          494,482
                       449,621                                    433,437                                           421,909
                                                                            397,674

                                 317,368
             248,123                                                                            230,754                                 228,978
                                                      197,553                                                                                     -1%

   Q1 FY16 Q2 FY16 Q3 FY16 Q4 FY16 Q1 FY17 Q2 FY17 Q3 FY17 Q4 FY17 Q1 FY18 Q2 FY18 Q3 FY18 Q4 FY18 Q1 FY19 Q2 FY19
                                                     Theme Park       Water Park       Snow Park

• For Q2FY19, footfall reduced by 1% to 2.29 lakh vs 2.31 lakh in FY17
   – Footfalls for Theme Park and Water Park impacted due to higher Rainfall intensity in the region
   – Snow Park showed good growth of 38% YoY in footfall

                                                                                                                                                  21
Revenue Break-up – Quarter

                Q2 FY19 Revenue Build-up (Rs. mn)                                    Q2 FY19 Revenue Break-up

                                                                        356                       1% 10%
                                                  5          36                            21%
                                      74
                           25
   151         66                                                                           7%                  42%

                                                                                            18%
                                                                                   Ticket           F&B          Retail
 Ticketing    F&B        Retail      Hotel   Snow Park     Others     Total
                                                                     Revenue       Hotel            Snow Park    Other

                Q2 FY18 Revenue Build-up (Rs. mn)                                    Q2 FY18 Revenue Break-up

                                                                        359                         1% 5%
                                                  4          17                             21%
                                      75
                           28
   184         50                                                                          8%
                                                                                                                51%
                                                                                       14%
                                                                                   Ticket           F&B          Retail
 Ticketing    F&B        Retail      Hotel   Snow Park     Others     Total
                                                                     Revenue       Hotel            Snow Park    Other

F&B includes only park F&B revenues, Hotel revenues include Room + F&B revenues.

                                                                                                                          22
Revenue Break-up – Half Year

                H1 FY19 Revenue Build-up (Rs. mn)                                    H1 FY19 Revenue Break-up

                                                                       1,204                      1% 7%
                                                             85                             14%
                                                 18
                                     165
                           95                                                           8%
   631         211
                                                                                                                52%
                                                                                      18%
                                                                                   Ticket           F&B          Retail
 Ticketing    F&B        Retail      Hotel   Snow Park     Others     Total
                                                                     Revenue       Hotel            Snow Park    Other

                H1 FY18 Revenue Build-up (Rs. mn)                                    H1 FY18 Revenue Break-up

                                                                       1,225                       1% 5%
                                                             61                             15%
                                                 17
                                     183
                          105                                                           9%
   682         176

                                                                                                                56%
                                                                                     14%
                                                                                   Ticket          F&B           Retail
 Ticketing    F&B        Retail      Hotel   Snow Park     Others     Total
                                                                     Revenue       Hotel           Snow Park     Other

F&B includes only park F&B revenues, Hotel revenues include Room + F&B revenues.

                                                                                                                          23
ARPU Break-Up: Quarter

                     ARPU (Rs.)                                      ARPU - Ticketing (Rs.)

            10%                                               -12%
                  1,786                             1,109
   1,631                             5%                               976                         -9%
                             1,150         1,210                                         713                648

   Q2FY18         Q2FY19    Q2FY18         Q2FY19   Q2FY18           Q2FY19             Q2FY18           Q2FY19

            ARPU – Non Ticketing (Rs.)                               ARPU Break Up (%)
                                                            Theme Park                         Water Park
                                                      7%                                  4%                4%
            55%                                       8%                 18%              14%               12%
                    810              29%              17%                7%
                                                                                          20%               30%
     522                                     562                         20%
                              437
                                                      68%                55%              62%               54%

   Q2FY18        Q2FY19      Q2FY18        Q2FY19    Q2FY18           Q2FY19             Q2FY18           Q2FY19
       Theme Park               Water Park
                                                                Others         Retail      F&B          Ticketing

                                                                                                                    24
ARPU Break-Up: Half Year

                     ARPU (Rs.)                                     ARPU - Ticketing (Rs.)

            1%                                                -8%
    1,794         1,809              2%             1,241
                                                                    1,139                         -3%
                             1,227         1,250                                         777                755

   H1FY18         H1FY19    H1FY18         H1FY19   H1FY18          H1FY19              H1FY18           H1FY19

            ARPU – Non Ticketing (Rs.)                              ARPU Break Up (%)
                                                            Theme Park                         Water Park

                                                      8%                                  4%                4%
            21%                                                          12%
                                                      8%                                  13%               12%
                    670              10%                                 7%
     553                                              15%
                                             495                         18%              20%               24%
                              450

                                                      69%                63%              63%               60%

    H1FY18        H1FY19     H1FY18        H1FY19    H1FY18          H1FY19              H1FY18           H1FY19
        Theme Park              Water Park
                                                                Others         Retail      F&B          Ticketing

                                                                                                                    25
Management Commentary – Q2 FY19

• For Q2 FY19, total ARPU for the Theme Park and Water Park improved by 7% YoY
   – Ticketing ARPU for the Theme Park and Water Park declined by 11% over the corresponding
     quarter in FY18, mainly due to the GST impact absorbed by the company
   – However, Non ticketing ARPU improved by a staggering 44% over the corresponding quarter in
     FY18, due to various initiatives taken by the management to increase visitor spending on F&B
• Performance for Q2 FY 2018-19 vis-à-vis Q2 FY 2017-18
   – Footfall for Q2 stands at 2.29 lakh vs. 2.30 lakh
   – Revenue for Q2 remained flat at Rs. 35.63 crore vis-a-vis Rs. 35.86 crore
   – EBITDA for Q2 improved to a loss of Rs. 0.62 cr in Q2 FY19 from a loss of Rs. 1.85 cr in Q2 FY18
• Footfall conversion was noteworthy in our smaller ticketed attractions like Snow Park
  (SP), House of Stars (HOS), and Eyelusion
   – SP footfall grew by 38% to 46,176 footfall in the quarter
   – In Q2, new ticketed attractions of House of Stars and Eyelusion showed good promise
• In line with its objective of aligning the company’s debt obligations with the operational
  cash flows, the company has presented a comprehensive debt resolution plan to its
  lenders and the same is under active consideration.

                                                                                                   26
Profitability Statement – Half year & Quarter

 Particulars (Rs. mn)                          H1 FY19   H2 FY18    YoY      Q2 FY19   Q2 FY18   YoY
 Footfall* (Nos.)                              817,575   806,158     1%      228,978   230,754   -1%
 Revenue                                       1,203.6   1,224.8    -2%       356.3     358.6    -1%
 Raw Material                                   121.5     134.7     -10%      39.2      44.0     -11%
 Advertisement, sales and marketing expenses    201.4     212.0     -5%       70.5      79.9     -12%
 Employee benefits expense                      260.7     273.5     -5%       127.1     132.1    -4%
 Repairs and Maintenance                        51.4      45.5      13%       21.3      19.2     11%
 Power, fuel and water                          88.2      92.6      -5%       36.3      38.7     -6%
 Other expenses                                 139.8     162.7     -14%      62.6      63.2     -1%
 EBITDA                                         340.8     303.7     12%        -0.6     -18.5     -
 EBITDA Margin                                  28.3%     24.8%    350 bps    -0.2%     -5.2%     -
 Other Income                                    3.6       1.8      95%        1.3       0.2     497%
 Depreciation                                   474.5     464.2      2%       243.6     234.8    4%
 Finance Cost                                   633.6     635.2      0%       312.2     315.5    -1%
 Profit Before Tax                              -763.7    -793.8      -       -555.1    -568.6    -
 Tax                                              -         -         -         -         -       -
 Profit after Tax                               -763.7    -793.8      -       -555.1    -568.6    -
 Other Comprehensive Income                     2.23      0.90        -       0.83      0.58      -
 Total Comprehensive Income                     -761.5    -792.9      -       -554.3    -568.0    -
   * Excl. Hotel

                                                                                                       27
Balance Sheet

Equity & Liabilities (Rs. mn)      Sep-18     Mar-18     Assets (Rs. mn)                           Sep-18     Mar-18

Equity                             3,330.0    4,091.1    Non-Current Assets                        14,812.0   15,236.0
                                                          Fixed Assets
 Equity Share Capital               880.6      880.6       - Property, plant and equipment         11,772.3   11,331.3
 Other Equity                      2,449.4    3,210.5      - Capital work- in-progress               12.8      862.0
                                                           - Other intangible assets                205.3      219.0
Non-Current Liabilities            8,013.0    8,925.4      - Intangible assets under development     5.4        5.4
 Financial Liabilities                                    Financial assets
                                                           - Non-Current investments               1,061.8    1,061.8
   - Borrowings                    7,999.4    8,911.5
                                                           - Others                                  5.3        5.3
 Long-term provisions                13.6       13.9      Deferred tax Assets (net)                1,654.1    1,654.1
                                                          Other Non-Current Assets                   95.1       97.2
Current Liabilities                4,057.6    2,791.1
                                                         Current Assets                             588.6      571.6
 Financial Libilities                                     Inventories                               132.0      142.9
                                                          Other Financial Assets
   - Borrowings                     808.5      837.7
                                                            - Trade receivables                      36.7       51.2
   - Trade payables                 319.6      274.6        - Cash and cash equivalents              36.4       28.4
                                                            - Other Bank Balances                     0.9        0.4
   - Other Financial Liabilities   2,559.5    1,290.0
                                                            - Short-term Loans and Advances         140.9      127.2
 Other current liabilities          364.9      386.3        - Others                                 34.9       35.0
 Short-term provisions               5.1        2.5       Current tax assets                         34.6       32.6
                                                          Other Current Assets                      172.1      154.0
Total Equity & Liabilities         15,400.6   15,807.5   Total Assets                              15,400.6   15,807.5

                                                                                                                     28
Profitability Statement – Full Year

  Particulars (Rs. mn)                           FY18        FY17         YoY
  Footfall* (Nos.)                              1,722,549   1,544,219     12%
  Revenue                                        2,362.9     2,389.9      -1%
  Raw Material                                   259.7       240.6        8%
  Advertisement, sales and marketing expenses    395.4       394.9        0%
  Employee benefits expense                      485.5       558.1       -13%
  Repairs and Maintenance                         91.1       105.6       -14%
  Power, fuel and water                          169.2       159.4        6%
  Other expenses                                 335.2       322.7        4%
  EBITDA                                         626.7       608.5        3%
  EBITDA Margin                                  26.5%       25.5%      +106 bps
  Other Income                                     9.9         5.2        92%
  Depreciation                                   924.2       944.7        -2%
  Finance Cost                                   1,264.2     1,198.9      5%
  Profit Before Tax                             -1,551.7    -1,530.0       -
  Tax                                               -        -358.7        -
  Profit after Tax                              -1,551.7    -1,171.4       -
  Other Comprehensive Income                      -2.6        -0.3         -
  Total Comprehensive Income                    -1,554.4    -1,171.7       -
  * Excl. Hotel

                                                                                   29
Awards & Recognitions

•   Voted among the Top 10 Amusement parks in Asia                            •   IAAPI Awards 2016
•   Tripadvisor’s Traveller’s Choice Award 2015 & 2017                             –   Print Media – Winner
     –   Imagica Water Park Ranked 14th among the top 25 water parks in the        –   Electronic Media – TV Channel – Winner
         World by Tripadvisor (2017)
                                                                              •   Novotel Imagica Khopoli Awarded the Best New Hotel of
•   Winner of “Best Customer Experience in the Services
    Sector” at Customer Experience Awards by Zendesk at The                       the Year – “Upper Mid Scale Segment” at Hotel
    Customer FEST Show 2018                                                       Investment Conference South East Asia
•   VFS Global Times Travel Awards (ET) 2018 - Winner –                       •   Imagica gets ISO certified for Integrated Management
    Adventure Attraction Sector                                                   Systems by Bureau Of Indian Standards (BIS)
•   Times Retail Icon Awards 2018 – Preferred Theme Park                           –   Quality Management System- IS/ISO 9001:2008
    Destination                                                                    –   Occupational Health and Safety Management system – IS
•   IAAPI Awards 2017 - Most Innovative Rides & Attractions –                          18001:2007
    Winner                                                                    •   TRA Research
•   Kids Stop Press’ Digital Awards 2017 – Best Outdoor Park                       –   India’s Most Attractive Brands 2015 – Entertainment category

                                                                                                                                                      30
For further information, please contact:

Company :                                  Investor Relations Advisors :

Adlabs Entertainment Ltd.                  Strategic Growth Advisors Pvt. Ltd.
CIN: L92490MH2010PLC199925                 CIN: U74140MH2010PTC204285

Mr. Khelan Shah                            Mr. Jigar Kavaiya - jigar.kavaiya@sgapl.net
Khelan.shah@adlabsentertainment.com        +91-9920602034

                                           Mr. Rohan Adhiya - rohan.adhiya@sgapl.net
                                           +91-9833219522

www.adlabsimagica.com                      www.sgapl.net

                                                                                         31
You can also read