Cycling in the City Smart choices for cities - CIVITAS
←
→
Page content transcription
If your browser does not render page correctly, please read the page content below
Smart choices for cities
Cycling in the City
Smart choices for cities
                                                               Cycling in the City

Pictures © Shutterstock, 2016, pages: 1, 14, 15, 20, 22.

                                                           2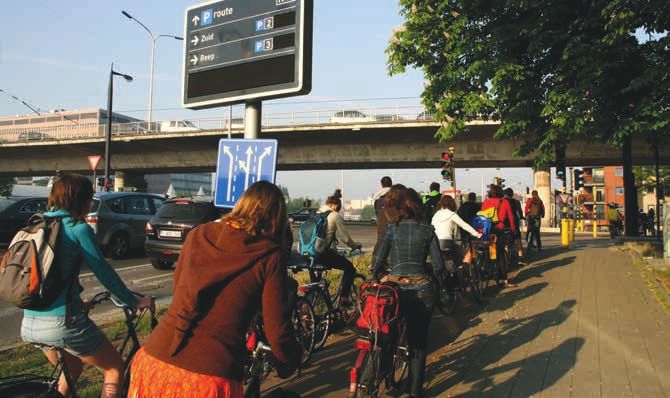
Smart choices for cities
                                                                                                           Cycling in the City

Table of contents

Preface. .  .  .  .  .  .  .  .  .  .  .  .  .  .  .  .  .  .  .  .  .  .  .  .  .  .  .  .  .  .  .  .  .  .  .  .  .  .  .  .  .  .  .  .  .  .  .  .  .  .  .  .  .  .  .  .  .  .  .  .  .  .  . 4
Introduction . .  .  .  .  .  .  .  .  .  .  .  .  .  .  .  .  .  .  .  .  .  .  .  .  .  .  .  .  .  .  .  .  .  .  .  .  .  .  .  .  .  .  .  .  .  .  .  .  .  .  .  .  .  .  .  .  .  .  . 5
           The city is changing . . . . . . . . . . . . . . . . . . . . . . . . . . . . . . . . . . . . . . . . . . . . . . . . . . . . . . . . . . . . . . . . . .  5
           Why cycling? . . . . . . . . . . . . . . . . . . . . . . . . . . . . . . . . . . . . . . . . . . . . . . . . . . . . . . . . . . . . . . . . . . . . . .  8
           An integrated approach to cycling provision in the urban environment . . . . . . . . . . . . . . . . . . . . . . . . . . . . . . .  9

Infrastructure and equipment . .  .  .  .  .  .  .  .  .  .  .  .  .  .  .  .  .  .  .  .  .  .  .  .  .  .  .  .  .  .  .  .  .  .  .  .  .  .  .  .  .  .  .  .  . 10
           Introduction. . . . . . . . . . . . . . . . . . . . . . . . . . . . . . . . . . . . . . . . . . . . . . . . . . . . . . . . . . . . . . . . . . . . . . .  10
           Cycling safety . . . . . . . . . . . . . . . . . . . . . . . . . . . . . . . . . . . . . . . . . . . . . . . . . . . . . . . . . . . . . . . . . . . . .  10
                  Where do most accidents happen?. . . . . . . . . . . . . . . . . . . . . . . . . . . . . . . . . . . . . . . . . . . . . . . . . .  11
                  Senior cyclists and safety. . . . . . . . . . . . . . . . . . . . . . . . . . . . . . . . . . . . . . . . . . . . . . . . . . . . . . . . .  12
                  Equipment. . . . . . . . . . . . . . . . . . . . . . . . . . . . . . . . . . . . . . . . . . . . . . . . . . . . . . . . . . . . . . . . . . .  12
                  Implications for infrastructure . . . . . . . . . . . . . . . . . . . . . . . . . . . . . . . . . . . . . . . . . . . . . . . . . . . . . .  12
           Building blocks for safe infrastructure . . . . . . . . . . . . . . . . . . . . . . . . . . . . . . . . . . . . . . . . . . . . . . . . . . . . .  14
                  Recognisability . . . . . . . . . . . . . . . . . . . . . . . . . . . . . . . . . . . . . . . . . . . . . . . . . . . . . . . . . . . . . . .  16
                  Specific infrastructural situations. . . . . . . . . . . . . . . . . . . . . . . . . . . . . . . . . . . . . . . . . . . . . . . . . . . .  16
                  Multi-modal Transport. . . . . . . . . . . . . . . . . . . . . . . . . . . . . . . . . . . . . . . . . . . . . . . . . . . . . . . . . . .  16
                  Bicycle Congestion. . . . . . . . . . . . . . . . . . . . . . . . . . . . . . . . . . . . . . . . . . . . . . . . . . . . . . . . . . . . .  18
           Bicycle Theft. . . . . . . . . . . . . . . . . . . . . . . . . . . . . . . . . . . . . . . . . . . . . . . . . . . . . . . . . . . . . . . . . . . . . . .  18

Supporting Actions. .  .  .  .  .  .  .  .  .  .  .  .  .  .  .  .  .  .  .  .  .  .  .  .  .  .  .  .  .  .  .  .  .  .  .  .  .  .  .  .  .  .  .  .  .  .  .  .  .  .  .  .  . 19
           Introduction. . . . . . . . . . . . . . . . . . . . . . . . . . . . . . . . . . . . . . . . . . . . . . . . . . . . . . . . . . . . . . . . . . . . . . .  19
           Building an organization in (local) government. . . . . . . . . . . . . . . . . . . . . . . . . . . . . . . . . . . . . . . . . . . . . . .  19
           Working with stakeholders . . . . . . . . . . . . . . . . . . . . . . . . . . . . . . . . . . . . . . . . . . . . . . . . . . . . . . . . . . . .  20
                  Cycling Association . . . . . . . . . . . . . . . . . . . . . . . . . . . . . . . . . . . . . . . . . . . . . . . . . . . . . . . . . . . .  20
                  Employers: Bicycle to work . . . . . . . . . . . . . . . . . . . . . . . . . . . . . . . . . . . . . . . . . . . . . . . . . . . . . . .  20
                  Cycle Marketing. . . . . . . . . . . . . . . . . . . . . . . . . . . . . . . . . . . . . . . . . . . . . . . . . . . . . . . . . . . . . . .  20
           Education . . . . . . . . . . . . . . . . . . . . . . . . . . . . . . . . . . . . . . . . . . . . . . . . . . . . . . . . . . . . . . . . . . . . . . . .  21
                  Insights in cycling behaviour . . . . . . . . . . . . . . . . . . . . . . . . . . . . . . . . . . . . . . . . . . . . . . . . . . . . . .  21
                  Gathering data . . . . . . . . . . . . . . . . . . . . . . . . . . . . . . . . . . . . . . . . . . . . . . . . . . . . . . . . . . . . . . .  21
                  Cycling in traffic models . . . . . . . . . . . . . . . . . . . . . . . . . . . . . . . . . . . . . . . . . . . . . . . . . . . . . . . . .  21

From ideas to policy: Recommendations for approaching investments in cycling.. .  .  .  .  .  .  . 22
Bibliography. .  .  .  .  .  .  .  .  .  .  .  .  .  .  .  .  .  .  .  .  .  .  .  .  .  .  .  .  .  .  .  .  .  .  .  .  .  .  .  .  .  .  .  .  .  .  .  .  .  .  .  .  .  .  .  .  .  . 24
Notes. .  .  .  .  .  .  .  .  .  .  .  .  .  .  .  .  .  .  .  .  .  .  .  .  .  .  .  .  .  .  .  .  .  .  .  .  .  .  .  .  .  .  .  .  .  .  .  .  .  .  .  .  .  .  .  .  .  .  .  .  .  .  . 26

                                                                                                 3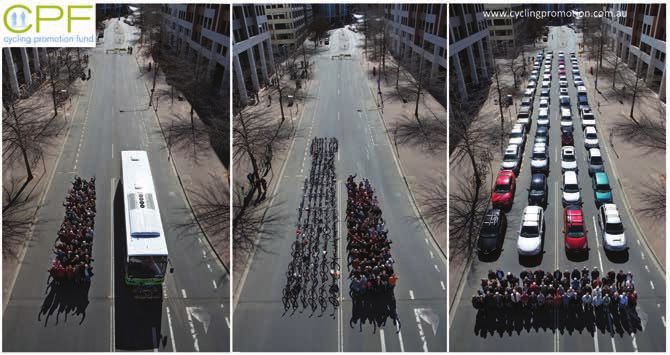
Smart choices for cities
                                                                               Cycling in the City

Preface

Thank you for reading the eighth and final policy analysis of              Over 70% of all Europeans live in cities and cities are
the CIVITAS WIKI Policy Analysis Series.                                   becoming increasingly congested. Citizens suffer from poor
                                                                           air quality and noise, which makes the cities less liveable.
The mission of the CIVITAS WIKI project was to provide                     This document provides information about measures that can
information on clean urban transport and the CIVITAS                       be taken in order to increase the use of cycling as a transport
Initiative to EU city planners, decision-makers and citizens.              mode in the urban environment. The authors are aware of
With its policy documents, WIKI wants to inform people                     the fact that cities differ in their infrastructural developments.
in cities about a number of topics that currently play an                  The ease of implementing the measures might therefore differ
important role in urban mobility.                                          from one city to another.

This final policy analysis focuses on the topic of cycling in              We hope you will enjoy the read,
the city.
                                                                           The CIVITAS WIKI team

This publication was produced by the CIVITAS WIKI consortium. This policy note was compiled by Kerry Malone (TNO, the Netherlands). The author
of this policy note would like to thank Steven Puylaert (StudioBereikbaar) for his research, Stefan Talen (TNO) for his support, and Mike McDonald
(Emeritus Professor of Transportation Engineering, University of Southampton) and Tariq van Rooijen (TNO) for the review of the manuscript.

                                                                       4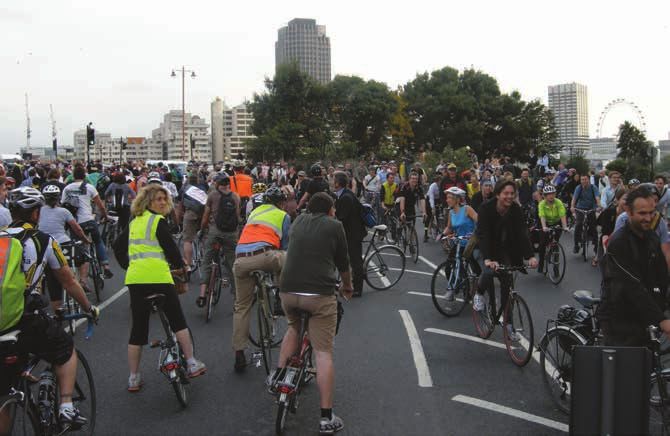
Smart choices for cities
                                                                         Cycling in the City

Introduction

THE CITY IS CHANGING

Currently, 72% of Europeans live in cities or suburbs (PBL            the elderly. The growth in the electric bicycle (e-bike) fleet
Netherlands Environmental Assessment Agency, 2016) and                has resulted in more and longer bicycle trips being made by
this percentage is increasing. As a result, cities are becoming       the latter group. Finally, this growth has resulted in increased
more congested, suffer from increasingly poor air quality,            congestion on bicycle paths in cities such as Amsterdam and
more noise and are generally less liveable. Increasing the            Utrecht (Harms, 2015).
number of people who cycle can be an important step
towards more sustainable and liveable cities. Cycling also            However, there are differences between European cities
brings personal health benefits.                                      and even between cities in the same country in terms of
                                                                      modal split and the share of cycling as a mode. The large
Many successful European cities view a vibrant cycling                capital cities of Amsterdam and Copenhagen are viewed as
culture as providing a competitive advantage over other               examples of world-leading cycling cities, and many other
cities in attracting new businesses, tourists and key workers,        smaller European cities have substantial proportions of
and therefore, have adopted world leading approaches                  people cycling regularly. In Copenhagen (DK) and Zwolle
to encouraging and supporting cycling. Cycling projects               (NL), 30% or more of all trips are made by cycle (EPOMM,
an image of health and prosperity and has replaced the                2016). Large national and city differences in levels of
automobile “as the engine of urban economic growth and                cycling persist despite the substantial evidence to support
public health” (Oldenziel & de la Bruhèze, 2016). European            the benefits of cycling and of the factors which lead to its
cycling policies have been copied, for example, in New York           increase. Figure 1 shows the modal split (walking, cycling,
under Mayor Bloomberg in his 2006 revitalisation plan for             Public Transport (PT) and car) for a selection of European
sustainable economic growth after the 9/11 terrorist attack           cities. The range of the cycling modal split varies from 0% in
(Oldenziel & de la Bruhèze, 2016).                                    Madrid to 30% in Copenhagen and Zwolle. It is important to
                                                                      note that the modal split of cycling has not always been as it
The Netherlands, a country in which cycling is already very           is portrayed in Figure 1; measures have been taken to bring
popular, shows clear cycling trends. In general, there is an          the cycling share up to the levels of Figure 1 from the lows in
increase in the percentage of trips made by bicycle in the            the 1950’s and 1960’s.
urban environment. The share of trips made by bicycle within
the city of Amsterdam increased to 53% in 2012 from 33%               This policy note distils evidence to encourage cities to
in 1989. Social differences emerge among the Dutch cyclists.          develop effective ways of increasing cycling and reducing
The largest growth in the number and length of bicycle trips          the modal share of motorised vehicles.
have been among the young adults aged 18-30 and among

 MODAL SPLIT PER CITY                                                                                   Car   PT        Cycling      Walk

                                                                         17
                               28                        31                                        24                              29
     33                                     38                                        40                           37
                  51
                                                                         33
     20                        26                        26
                                            20                            3                        54                              42
                   8                                                                  37                           37
     30                        27                        13
                                            22                                                                                      0
                  30                                                     47            2            1              1

     17                        19           20           30                           21           21              25              29
                  11
 Copenhagen      Zwolle      Odense      Amsterdam      Berlin          Paris       London      Warszawa       Zagreb             Madrid
Figure 1: Modal Split by a selection of European Cities for (combined data from 2010 - 2013). (EPOMM, 2016).

                                                                  5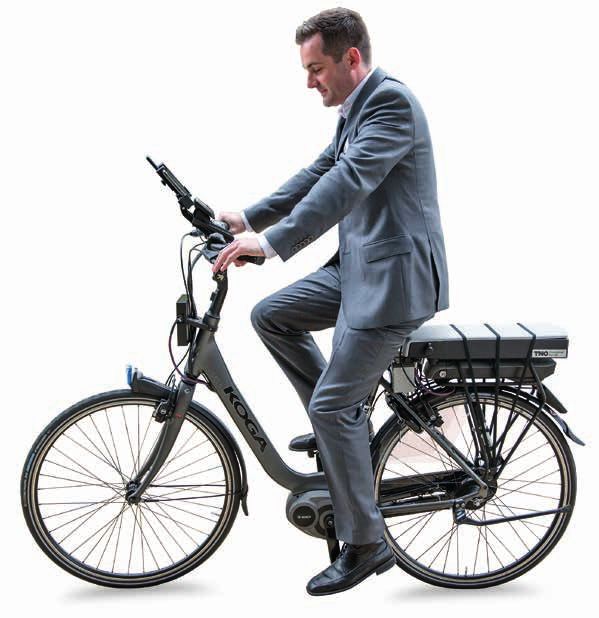
Smart choices for cities
                                                                    Cycling in the City

                                                         E-BIKES

Electric bicycles (e-bikes) are gaining ground in the city. These bicycles have a battery and an engine to support the
cyclist, resulting in longer trips being made. Typically, 7.5 kilometres is seen as the maximum range for cyclists. The
e-bike doubles the range. This makes the e-bike not only relevant for inner city travel, but also for travel between cities.
The main target groups for the e-bikes are commuters and the elderly. For commuters the e-bike is often an alternative for
the car, for the elderly it is a way to stay mobile. In general, the e-bike is more flexible and faster in cities than the car
or public transport.

Two types of electric bicycles are considered. The lower electronically-powered version includes all e-bikes that have an
engine, producing up to 250 watts with support up to 25 km/h. These are commonly called “e-bikes”. All other electric
bicycles, typically up to 45 km/h and supplying 500-1000 watts of power, are commonly called “speed pedelecs”
and are actually considered two-wheeled mopeds (see Figure 2). These speed pedelecs require more rigorous testing
and type-approval testing procedures. Speed pedelecs bring new design and policy questions: should speed pedelec
users cycle on the road or on the cycling path, and should a speed limit be introduced on cycling paths? In 2017, the
Netherlands will introduce new regulations regarding speed pedelecs in which they will be treated as mopeds. This
means that the driver of the speed pedelec needs to be at least 16 years of age, have a driver’s licence and not be
allowed to drive on all cycling lanes (Rijksoverheid, 2016).

Figure 2: Left the E-bike (max speed 25 km/h), on the right the speed pedelec (max speed 45 km/h).
(Photo by Sparta and ABUS).

                                                             6
Smart choices for cities
                                                                  Cycling in the City

                                              FREIGHT TRANSPORT

The bicycle can also be used to transport goods. In some countries parcel delivery in highly urbanised regions takes
place by cycling messengers. These bicycles can be a cheap alternative for a car and possibly provide a faster way of
delivering goods in inner cities. Another type of bike is the cargo bike where one or more people cycle a heavier load.
The Ikea in Delft, in the Netherlands, rents these bikes to customers who want to move their furniture to their homes.
Examples of the freight bikes can be seen in Figure 3. In an average European city, half of all motorised trips related to
goods transport could be shifted to bicycle or cargo bike (Intelligent Energy Programme of the European Union).

Figure 3: Freight transport by bike in different forms. From small parcels to ikea furniture. .
(Photos by SnapItaly, Albert Heijn and AutoKiosk).

                                                           7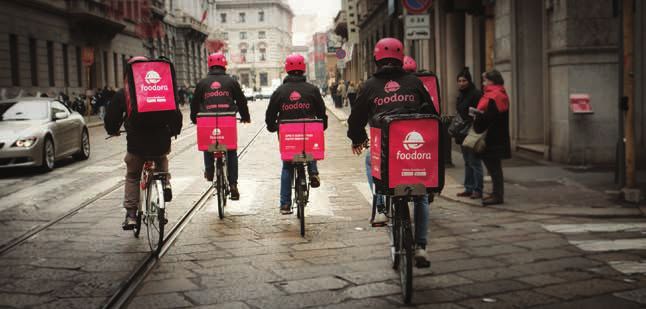
Smart choices for cities
                                                                    Cycling in the City

                                                WHY CYCLING?

                          Why is cycling making a resurgence in popularity? Why has it become a hot
                          topic in European cities, demonstrated by the growth in the modal share of
                          cycling and by the proliferation of bicycle sharing plans in Europe? Cycling
                          improves the livability of a city and the health of citizens in several ways.

      Mobility and space
                                                        Emissions                                Affordability
        on the road
Bicycles use less space on the road        Cyclists do not emit any air pollutants   Cycling is a more affordable transport
than cars and increased cycle use          while most other engine driven            mode than a car. The purchase price
with modal change from cars can            transport modes emit, for example,        and usage costs (euros per kilometre)
lead to less congestion. Also, parked      PM and NOx. Cities are faced with         of a cycle are lower than other modes
cycles use less space than parked          the challenge to reduce the amount        of transport, making it accessible to a
cars and allows valuable space in the      of emitted air pollutants since           wide range of citizens.
city environment to be used more           long-term exposure to PM is estimated
efficiently and for other activities.      to be responsible for over 400,000
Figure 4 shows the space demands           deaths in 2012 for all EU-28
for 72 people traveling by car, bus        countries (European Environment
and bicycle in a playful way.              Agency, 2015).

                                                                                                     Health
                        Cycling makes the city a more
                        pleasant place to live, and more                             Regular physical activity reduces the
                                                                                     risk of diabetes, some sorts of cancer,
A healthier, safer and less polluted city makes it more livable. Furthermore, the    obesity and many other diseases (de
social interaction of cyclists is different from other motorised road users.         Hartog, Boogaard, Nijland, & Hoek,
Cyclists communicate differently from car drivers in their body language and         2010). Their research has shown that
social interaction, as they are less physically separated from their immediate       the health advantages of cycling
environment than those enclosed in a motorised vehicle. Cyclists also have a         outweigh the accident and environ-
positive economic impact. The average cyclist spends more shopping than the          mental pollution risks of cycling. For
average motorised customer and there is strong evidence that well-designed           every half a million people in the
bicycle facilities reduce the accident risks for cyclists and increase road safety   Netherlands using a bike instead of a
when they substitute car kilometres (Wegman, Zhang, & Dijkstra, 2012). Due           car, the life expectancy increases by
to these reasons, investing in cycling can lead to positive secondary effects on     3-14 months due to the physical
the economy or safety in the city. According to the World Health Organisa-           activity while the inhaled air pollution
                 tion’s report (World Health Organisation Europe, 2014), if          and accident risks cause an average
                    cities increased their cycling shares to the level of Copenha-   decrease of 0.8-14 days and 5-9
                     gen, 76,600 new jobs would be created and 10,000                days, respectively (de Hartog,
                     deaths would be avoided per year.                               Boogaard, Nijland, & Hoek, 2010).

                                                              8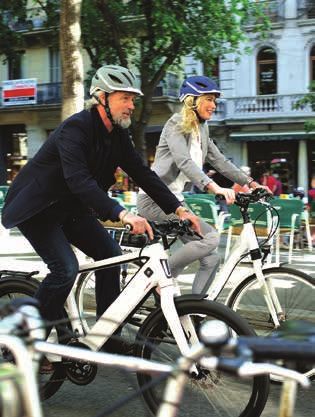
Smart choices for cities
                                                                        Cycling in the City

Figure 4: Recreation of the Munster iconic photograph from 1991 that shows the space required for .
72 people traveling by car, bus or bicycle. (Picture: Cycling Promotion Fund).

AN INTEGRATED APPROACH TO CYCLING
PROVISION IN THE URBAN ENVIRONMENT

Increasing levels of cycling is not a goal in and of itself.         high quality public transport projects, as a single cycling
Rather, it is a means to improve accessibility, livability and       project often has only a small effect, but in combination it
overall attractiveness of the city for citizens, business and        can bring about a bigger change. Often cities are biased
perhaps tourism. Therefore, it should be developed in the            towards the hardware of cycling, meaning the cycling paths,
context of a long-term vision for the city. Cycling should           bridges and traffic lights. However, the support actions,
not be a single measure. Rather, it should go hand in hand           including the behavioural, cultural and legislative aspects
with other measures, all of which should fit into the long           as well as the creation of cycling organisations are at least
term vision.                                                         equally important for the success (Loendersloot, Embassy, &
                                                                     Groep).
Encouraging cycling in the urban environment cannot be
achieved only by a top-down measure such as the investment           This policy note provides information about the types of
in a bicycle path. A cultural change is needed to encourage          measures that can be taken in order to increase cycling
road users to leave their cars and switch to cycling or to           in the urban environment. What is needed in a particular
make new types of trips by bicycle (See Figure 4). Several           environment is custom work; it depends on the city’s goals, the
stakeholders have roles in implementing a set of measures            existing situation, the population, the physical infrastructure,
covering different types of areas, both infrastructure and           the budget, etc. Measures can be infrastructural, which tend
support actions, in order to bring about this cultural change.       to mean a relatively large investment, and support actions
Cycling projects are often more successful if they are               covering developing a cycling organization, working with
undertaken in combination with urban renewal projects or             stakeholders, marketing, and education programs.

                                                                 9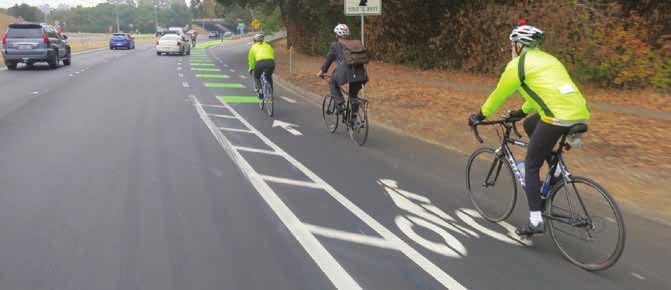
Smart choices for cities
                                                                           Cycling in the City

Infrastructure and equipment

INTRODUCTION

Infrastructure and equipment focuses primarily on keeping               road user behaviour, road infrastructure and vehicles using
cyclists safe. Secondly, the infrastructure enables the smooth          the infrastructure. This section focuses on infrastructure and
and uninterrupted mobility of cyclists. Both issues are                 equipment, whilst more focus will be given to the behavioural
addressed in this section.                                              side in the supporting measures section. As safety is one of
                                                                        the most important aspects, the note starts with information
Cycling infrastructure is generally the most visible aspect             about key cycling safety statistics and information, and
of a city’s cycling policy and is often the most expensive              draws lessons from this to other policy measures.
element. As cyclists value continuous, safe and segregated
cycling paths, a network of cycling infrastructure is important.
Thus, one single cycling facility or street is unlikely to make         CYCLING SAFETY
a major difference to cycling in a city. Cyclists must feel safe
and secure from the start to finish of their cycle trips, and           Traffic is getting safer. However, cyclist deaths and injuries in
the bicycle paths should form a comprehensive network.                  Europe have not been decreasing at the same rates as those
Practically, cyclists also need infrastructure to store their           for other road users. Figure 5 shows that the decrease in
bicycle and also to keep them safe.                                     cyclist fatalities is relatively low compared to other modes. In
                                                                        recent decades, most safety improvements have focused on
Equipment refers to equipment for the vehicle and the cyclist,          the protection of motorised vehicle occupants. Policy makers
in order to prevent accidents from occurring or, when they              recognize that number of vulnerable road users killed and
do, to mitigate the effects.                                            severely injured is not decreasing as much as motorised
                                                                        vehicle occupants, and safety policies are beginning to
Infrastructure and equipment, or the lack thereof, can lead             focus more on cyclists. At the European level, priority area
to unsafe situations for cyclists. Safe cycling in the urban            III (f) 4.2 of the ITS Directive (ITS Directive, 2010) focuses
environment is influenced by interaction among road users,              attention on the need to address cycling safety.

25000                               TRAFFIC DEATHS IN THE EU PER MODE                                                   Car (-53%)
                                                                                                                        Moped (-59%)
                                                                                                                        Motorcycle (-43%)
20000                                                                                                                   Bike (-32%)
                                                                                                                        Pedestrian (-38%)
                                                                                                                        Other (-17%)
15000

10000

 5000

    0
           2004        2005        2006        2007         2008            2009        2010         2011        2012           2013

Figure 5: Number of traffic deaths in the EU per year per mode, excluding Lithuania. From the CARE-
database. (European Road Safety Observatory, 2015).

                                                                   10
Smart choices for cities
Cycling in the City
WHERE DO MOST ACCIDENTS HAPPEN?
Cyclists are involved in two types of accidents: single-vehicle struck from behind (Op den Camp, Ranjbar, Uittenbogaard,
or multi-vehicle accidents. The single vehicle accidents are Rosen, & Buijssen, 2014). Collisions with a speeds higher
situations in which a cyclist has an accident in which no than 30 km/hour lead to serious injury or death of the cyclist.
other participant is involved, for example, the cyclist slips In collisions between a cyclist and a motorised vehicle, every
and falls in a curve. A multiple-vehicle accident involves additional km/hour above 30 km/hour significantly increases
other road users. the risk of death for the cyclist. Figure 6 shows the cumulative
probability distribution of a pedestrian fatality in a collision
The InDev project found that in the seven countries studied with a car. A similar result for cyclists is expected.
(Belgium, Germany, Denmark, Spain, the Netherlands, Po-
land and Sweden), most fatal accidents involving cyclists oc- Whilst collisions with another vehicle is a major factor in
curred in built-up areas (German Federal Highway Research unsafe cycling situations, accidents involving only a single
Institute (BASt), 2016). These areas had the most cycling trips cyclist were found to be underreported in both the CARE
and most interactions with other road users (SWOV, 2013). and national datasets. No other vehicles were directly
The VRUITS project showed that the majority of European cy- involved in these single vehicle accidents and the rider either
cling accidents occurred at intersections (Bell, Chaloupka, & collided with objects in their traffic environment or fell on
Ohg, 2015), and involved collisions with a motorised vehicle. the roadway or footpath for a variety of reasons. Methorst
The CATS project found that almost all collisions between cy- (Methorst, 2010) found that of 220 fatal cycle accidents,
clists and motorised vehicles result in death or serious injury 50 (23%) were accidents not involving another road-user.
when a cyclist crossed the trajectory of a motorised vehicle in However, when the data on non-fatal ’hospitalised’ cyclists
a perpendicular direction, or when the motorised vehicle and was examined, 600/7,600 (79%) were accidents not
cyclist are traveling in the same direction and the cyclist was involving another road-user.
Probability of pedestrian fatality
100
80
60
40
20
0
0 10 20 30 40 50 60 70 80 90 100
Collision speed (km/h)
Figure 6: cumulative distribution of the change a pedestrian will die in a collision with a car. (SWOV, 2006).
11Smart choices for cities
Cycling in the City
SENIOR CYCLISTS AND SAFETY
In the Netherlands, both the number of seniors and Emergency Braking (AEB) part of their test protocol and star
the percentage of cycling seniors is increasing, due rating. EuroNCAP intends to include Cyclist-AEB systems in
to demographics, the increase in leisure time and the the safety assessment from 2018 (TNO, 2016).
introduction of the e-bike. Increased mobility among seniors
improves their health, so increased cycling is considered
to be positive. However, in the Netherlands, the number of Cycle-based solutions
cyclists over 75 who die as a result of a cycling accident
is increasing. Most of these accidents are single-vehicle Helmets
accidents. Therefore, whilst the introduction of the e-bike
encourages seniors to cycle more, it also increases the Most European countries do not require cyclists to use helmets.
number of accidents. Although research has shown that helmets lead to 1.72 times
fewer head injuries (SWOV, 2012), their protective role for
In 2013, SWOV stated that it lacked information to identify internal head injuries needs further investigation (Joseph,
effective countermeasures for these types of accidents. et al., 2014). Most countries do not require helmets to be
Research has shown that most accidents happen when seniors used as they fear a decrease in the amount of cycling. As
are getting on and off a cycle or when they get scared by helmets do not prevent accidents, but only have an effect
other traffic (De Hair, et al., 2013). Elderly themselves report on the seriousness of an accident, most cities and countries
that they would feel safer cycling if the construction of more do not have restrictive policies. However, it remains a topic
new cycle tracks, the widening existing cycle tracks, and for debate.
better maintenance of these tracks would take place. Other
measures that can be taken to increase road safety for senior For children some European countries have helmet policies,
cyclists are a more predictable straightforward road and the mostly because their risk of falling is higher. Discussions about
removal of obstacles like bollards. If obstacles cannot be helmet policy have started around e-bikes: the introduction
removed, they should be made more noticeable. of speed pedelecs, electric bicycles that provide support to
45 km/hour, have led the Netherlands to develop the legal
requirement to wear a helmet.
EQUIPMENT
Vehicle-based safety solutions IMPLICATIONS FOR INFRASTRUCTURE
In addition to infrastructure, vehicle-based solutions can help To ensure the safety of cyclists, a safe, well-maintained
cycling to become safer. Automobile manufacturers already and connected infrastructure free of obstacles is needed.
have taken measures to mitigate the effects of vehicle–cyclist Interactions with other traffic determine how the infrastructure
collisions. Volvo’s Collision warning (Pedestrian and cyclist should be designed. Even careful consideration should be
detection with Full Auto Brake) is already on the market. Cam- given to whether cyclists and pedestrians should share the
paigns for Blind Spot mirrors on heavy goods vehicles exist. same infrastructure. From a traffic safety perspective, the
London’s “Safer Lorry Scheme” (Transport for London) requires Dutch Institute for Road Safety Research (SWOV) developed
vehicles over 3.5 tonnes to be fitted with mirrors giving the guiding principles (SWOV, 2012). These are
driver a better view of cyclists and pedestrians around their ve-
hicles, and to be fitted with side guards to prevent cyclists from ■■ Homogeneity in mass, speed and direction
being dragged under the wheels in the event of a collision.
■■ Recognisability of infrastructure
Vehicles equipped with an airbag that covers a larger
part of the windscreen to protect pedestrians and cyclists ■■ Road design that is consistent with its function
in an accident, and automatic braking systems are in
development. In 2016, EuroNCAP (European New Car These principles, and the translation into, practice, are
Assessment Program) will make Pedestrian- Autonomous presented below.
12Smart choices for cities
Cycling in the City
The Intelligent Bicycle
Looking to the future, intelligence will be added to the cycle the bicycle can detect hazards in front of the cyclist using a
itself to increase the safety and comfort of cyclists. TNO has radar, whilst situations behind the bicycle can be detected
developed a prototype cycle to improve safety. Figure 7 with a camera. Integrated hardware and software of the
shows this bike in development. This cycle warns the cyclist intelligent cycle are being tested (Engbers, 2013).
of hazards from behind and in front of the cycle. Sensors on
VIBRATING SADDLE
Saddle vibrates if danger is
detected and the vibrations
indicate the direction of the
danger.
COMPUTER
TABLET AS HMI A computer receives
You can see more details information and passes it
about the imminent danger on to the screen and/or
on a tablet screen. activates the vibrating handle
bars or saddle.
VIBRATING.
HANDLE BARS CAMERA
Handle bars vibrate if The camera detects traffic
danger is detected and approaching from behind
the vibrations indicate the such bicycles, motorcycles,
direction of the danger. cars or truck and measures
their approaching speed.
RADAR
Radar scans for obstacles in
front of the bicycle.
HAPTIC PEDAL ASSISTANCE
Optional automatic braking.
Figure 7: Intelligent bike from TNO, in development at this moment. (Picture: TNO).
13Smart choices for cities
Cycling in the City
BUILDING BLOCKS FOR SAFE
INFRASTRUCTURE
Cyclists make use of roads that have different characteristics traffic intensities and high vehicle mass, mean that collisions
such as traffic volume, maximum speed, other road users, between cyclists and cars or truck are almost always lethal
quality of the road, etc. These characteristics can make it (see Figure 9). The preferred infrastructure for cyclists in this
more or less safe for cyclists. For example, in Cambridge, case is to have a separate bicycle path from the motorised
three levels are defined: primary roads, secondary roads vehicle road. Roundabouts or signalised intersections guide
and local roads. The primary roads and secondary roads the intersecting traffic, because the high speeds, mass and
are of a higher standard, with separate cycle paths to handle intensities reduce the cyclist safety.
larger cycling flows. The local roads connect the main roads
to all the trip origins and destinations of the inhabitants. Roads with combinations of lower motorised vehicle speeds
Figure 8 shows the lay-out of these three types of roads. and moderate vehicle intensity, or higher vehicle speeds but
low motorised vehicle intensity are sufficiently safe by means
The SWOV applies the guiding principle of homogeneity of of a visually separated infrastructure. The motorised vehicles
mass, speed and direction to road types to preserve cyclist and the cyclists each have their own designated area.
safety. These guiding principles are the ideal situation, which This solution is less expensive than a physically separated
is not always possible in older urban settlements. cycling path.
Roads with maximum speeds over 30 km/hour are used Finally, local roads where both the speeds and motorised
by cars and cyclists, if the cyclists are not prohibited such vehicle intensity are low do not need physical or visual
as on motorways. On roads with high vehicle speeds, high separation.
Primary roads Secondary roads Local roads
On streets with low vehicle intensity,
When speeds are higher, a physically No cyling path needed, speeds and the
visually seperated cyling paths
separated cycling path is needed. vehicle intensities are low
are advised
Figure 8: the intensities of cycles and cars, and the speeds of the car determine the lay-out of the
infrastructure.
14Smart choices for cities
Cycling in the City
Figure 9: Poor example:
Cycling along a highway. Large
differences in mass and speeds
lead to unsafe situations.
(Picture: Streetsblog.org).
ALMERE
In the Dutch city of Almere, the cycling infrastructure is almost completely separated from the car infrastructure. This
means that large distances can be travelled by cyclists without encountering obstacles (Gemeente Almere, 2013). Cars
and cycles use different infrastructure networks, and cycle paths are often next to train tracks, waterways or bus lanes.
This makes cycling comfortable, safe and fast (See Figure 10).
Figure 10: Separated traffic flows. Cycling path is parallel to the bus lane and cyclists have priority over
the car traffic. (Picture: Shutterstock, 2016)
15Smart choices for cities
Cycling in the City
RECOGNISABILITY
Another principle from the SWOV Dutch Sustainable Safe Cycling boulevards
guidelines is recognisability in design. This means that the
same types of roads should have the same types of layout. In the Netherlands, Germany, Spain and Belgium the first
This makes traffic regulations more natural and intuitive. The bicycle boulevards have been introduced (see Figure 12).
infrastructure elicits the desired road user behavior. For cycle These are cycling paths where cars are allowed. This
paths, this means that the color and design of paths should concept works only if traffic intensities and speeds are
be similar throughout the country or city. This is especially very low. Cars are not allowed to overtake cycles and are
important at special constructions such as roundabouts or “guests” on the bicycle boulevard. The streets are essentially
bicycle boulevards (see Figure 11). designed for cyclists, with small adaptations made for cars.
Non-local car traffic is discouraged by low speed limits and
other measures.
SPECIFIC INFRASTRUCTURAL SITUATIONS
Intersections and roundabouts
The number of road casualties decreases considerably
when an intersection is replaced by a roundabout. In the
Netherlands, roundabouts often have separate cycling
lanes (especially on 50 km/hour roads). The roundabouts
are designed such that in cities, cyclists have priority and in
rural areas, the cars have priority. There is no consensus on
whether the safety on roundabouts is higher when cyclists
have priority or not.
Figure 12: Example of a cycling street in Utrecht
(Photo: Cornutus)
MULTI-MODAL TRANSPORT
Cycling trips are mostly between the 2.5 and 7.5 kilometres
Figure 11: Roundabout with priority for cyclists. . on regular bikes and up to 15 km on e-bikes. For longer trips,
(Photo: Omroep Castricum) the combination of cycling and train, or cycling and metro is
appropriate. In the Netherlands, 47% (KIM, 2014) of all trips
to a train station are made by bike. Therefore, investing in
cycling infrastructure can also encourage modal shift as more
people will use the train.
16Smart choices for cities
Cycling in the City
There are factors which can increase the popularity of
the train-bicycle combination. The first is that the cycling
infrastructure from and to the station should be of high
quality. These are often busy roads which provide access to
the train station. They are difficult to design well for cyclists,
as other modes of transport such as buses or cars also need
access to the train station. 13A
Secondly, cycle parkings near stations should have sufficient
capacity, feel comfortable and be very near the station.
Figure 13 shows a crowded and chaotic parking situation
and a new neatly-organised cycle parking situation. In
almost all newly-built stations in the Netherlands, the cycle
parkings are neatly organised and located within a 3-minute
walk to the platforms. The downside of cycle parking places
is that they also introduce problems as they can get crowded
and chaotic. Double layered, well-designed parking places
with enforcement of incorrectly-parked cycles is a solution. To
help users find a free spot, new signage systems can indicate
13B
how many free parking spots are left, similar to car parking
systems. In Utrecht, such a system has already been put into
place (Figure 14).
A third way to include bicycles in multi-modal transport can
be found in several European cities. Paris is an example
where cycling is a public transport mode. The rental prices
are attractive (i.e. free up to 30 minutes) and bicycles can
be picked-up and dropped off at over 1800 locations across
the city (Figure 15).
14
Figure 13: A) a crowded cycle parking at
Amsterdam Muiderpoort, B) the new cycle parking
at Utrecht Central Station. (Pictures from Mapio and
Wikimedia).
Figure 14: Smart signage displays available
cycle parking places by location in Utrecht, the
Netherlands. (Picture: De Utrechtse Internet courant).
Figure 15: Velib station in Paris. In the city of Paris
there are 1800 stations like these. (Picture: Wikimedia).
15
17Smart choices for cities
Cycling in the City
BICYCLE THEFT
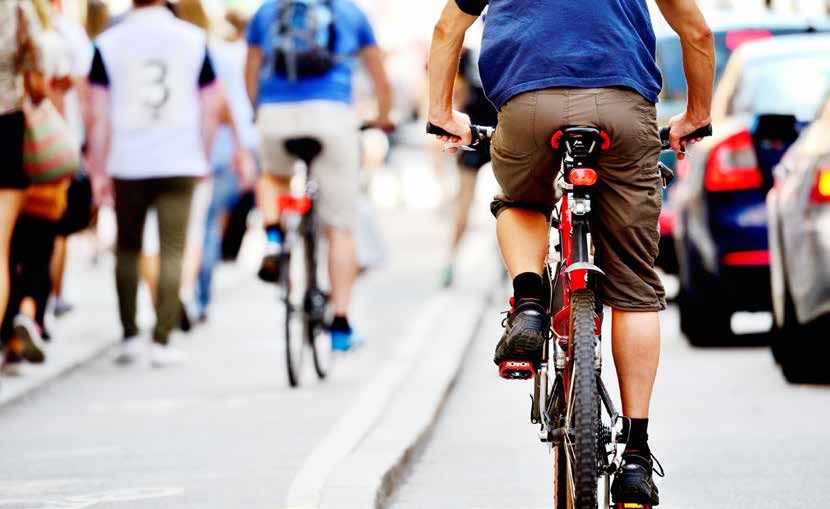
BICYCLE CONGESTION In many European countries, especially in cities, cycle theft
is a growing problem. An important aspect in reducing
The Dutch cities of Utrecht, Nijmegen, Amsterdam and bicycle theft is to involve multiple actors to decrease the theft
Wageningen are encountering problems with too much cycle of cycles. Municipalities should make safer parking places
traffic. Inner cities with many traffic signals, and cycle paths available. Parking locations should be in sight of people
near universities, have to cope with bicycle congestion. passing by, lit at night, easy to reach and convey a feeling
The presence of too many cyclists leads to unsafe situations of safety.
for the cyclists, but also causes problems for the car traffic.
At locations where cars are required to give priority to In addition to infrastructure measures, support measures
cyclists, waiting times for cars increase (see Figure 16). can be taken to reduce bicycle theft. Campaigns to inform
cycle owners to improve the locks on their cycles or store
Wider cycle paths are a partial solution, but do not solve them in safer places can be launched. As stolen bicycles are
the problems at intersections in cities. Developing alternative often sold in other cities, the national government and police
routes to access busy locations is a necessary part of the can set up a registration system for bicycles. Furthermore,
solution. In this way the streams are less dense and there are the local police can improve surveillance at places where
more gaps for cars. bicycles are most frequently stolen. More advanced solutions
such as chips in bikes can also be used.
Figure 16: A traffic jam of cyclists. (Picture: fietsbult).
18Smart choices for cities
Cycling in the City
Supporting Actions
INTRODUCTION BUILDING AN ORGANIZATION IN (LOCAL)
GOVERNMENT
As already mentioned, an investment in infrastructure alone
may not always bring about the desired increase in cycling. Cycling policies start with a solid local governmental
A cultural change is also needed. A change in culture can be organization which is knowledgeable in the area of cycling.
realised when coordinated actions by stakeholders are set in As soon as the city decides that cycling in the city should
motion. This section provides examples of these supporting be improved, the internal organization should be organised.
actions, although this list is incomplete. This means that civil servants should become knowledgeable
on cycling, if they are not already, and should link cycling
to other policy areas. As cycling is not a goal on itself, but
a mean to reach other goals, cycling should be linked to the
mobility plan or urban renewal plan of the city.
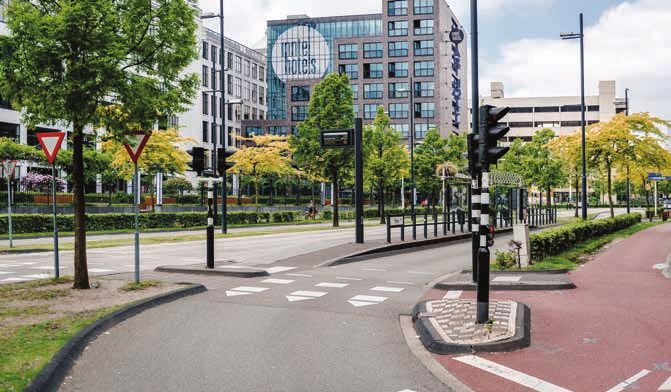
PROTESTS FOR MORE CYCLING INFRASTRUCTURE AND POLICIES
Cycling seems normal in countries as Denmark and the Netherlands, but even there the cycling space in the city was
earned through struggle. In the 70’s and 80’s, many groups protested for more and safer bike infrastructure. “Even
in Copenhagen – as indeed in Amsterdam and Utrecht – it took politicians, engineers, and cycling activists to defend
cycling’s share and increase its scope in their cities urban transit” (The Local DK). There are many things possible in the
world of cycling, but they (the dreams) do not come to fruition without struggles (see Figure 17).
Figure 17: Protest of cyclist in London to widen cycle paths. (Picture: aseasyasridingabike).
19Smart choices for cities
Cycling in the City
WORKING WITH STAKEHOLDERS
CYCLING ASSOCIATION CYCLE MARKETING
A knowledgeable partner for support in lobbying and making Marketing can be an effective instrument to support
cycling plans and policy are national cycling associations. infrastructural measures. Often one part of the marketing
The Fietsersbond is the Dutch Cyclists’ Union that campaigns is focussed on changing attitudes towards cycling, and
for better cycling conditions in the Netherlands (Fiestersbond, another part is concerned with giving information on new
2016). With a network of 35,000 members and 150 local cycling infrastructure. The image of cycling plays a key role
organisations, the Dutch Cyclists’ Untion can also provide in stimulating cycling. In some countries cycling is seen as
grass-roots support to increase cycling enthusiasm in a city. something for the sport freaks and daredevils, whereas in
In general, these organizations can also help to organise Denmark or the Netherlands it is more common to cycle.
marketing or events to promote cycling. Member input can The city of Munich (Sassen, 2011) launched a successful
be valuable in generating new plans. campaign to promote cycling in their city, with cycling
events, posters and merchandise. Cycling was marketed
as trendy and as being typically something essential to
EMPLOYERS: BICYCLE TO WORK Munich. The campaign events received substantial and
positive media coverage. An example of a poster is shown
A large proportion of the trips made on a daily basis are work- in Figure 18.
related. Employers can influence the way their employees
come to work. In 2010, TNO (Hendriksen, Fekkes, Butter, & Urban cycling has become a tool for city branding in other
Hildebrandt, 2010) researched what employers could do, cities, such as the Copenhagenize project does. Cycle
in order work best. For example by car-curbing measures chic or bicycle chic, a phrase coined by Mikael Colville-
such as paying for parking or providing a lower mileage Andersen, refers to cycling in fashionable everyday clothes.
allowance. Cycle lease plans or e-bike plans had a positive This branding has inspired the city council to mobilize
effect on the modal split of those commuting. Marketing Copenhagen’s cycling reputation as an effective branding
cycling worked as stimulating measure only in combination tool and has marketed it as the way forward in the global
with other measures. pursuit for liveable cities.
Figure 18: Cycle branding in München Germany.
Cycle is framed as typically München.
20Smart choices for cities
Cycling in the City
EDUCATION
In many countries, cycling is not yet common. Providing GATHERING DATA
cycling or traffic lessons at a young age can help to
decrease the number of accidents but can also lead to a There are many ways to gather data: cycle counts, GPS
change in culture (see Figure 19). It is important that cycling tracking, (ad hoc) surveys, general mobility surveys (which
lessons have a mandatory place in the curriculum at primary can be used to generate modal split, etc.), information from
schools. In some countries, non-obligatory traffic lessons for interest groups such as a cycling union, and location-specific
immigrants are offered. The city of Utrecht, for instance, surveys. To develop policies, information about cyclist
has a program to improve traffic safety among immigrants behaviour is needed: who cycles, use of the network, where
(Walker, 2016). cyclists travel from and to, where do they park their bikes,
and what is the perceived and actual quality of the cyclist
network?
INSIGHTS IN CYCLING BEHAVIOUR
Often data from multiple sources are used and combined.
Cycling counts were once common in European cities. More high-tech solutions have recently been developed.
However, the automated counting methods introduced in Quantitative data from the roadside such as loops or sensors
the 1970’s omitted counting pedestrians and bicyclists. (Bluetooth, WiFi) on separate bicycle tracks, also at traffic
This means that the data on which to base investment deci- lights, provide counts of cyclists. This data can be enriched
sions and for making policy -- analogous to analyses for with GPS data and can also be collected from the user’s
motorised vehicles – is missing. However, we live in the age smartphone or by equipping the bicycle with GPS. Often this
of big data and sensor technology. These technologies and is done by an app on a smartphone. An example of this is
methods can help to provide a foundation for cycling policy the Dutch National Bicycle Counting Week (Holland Cycling.
and decision-making. com, 2016). With this dataset, they hoped to get more insight
in the behaviour of cyclists and their travel patterns.
Background data can help to support policies in the future.
Such data relates to questions about those who currently or Sometimes the measuring activities are combined with other
potentially cycle, where and when they cycle, and how this projects. This occurred in the B-riders project in the Province
may change in the future. This data can be used to formulate Brabant in the Netherlands. Here, the car users were given
and evaluate measures. This data can also be used to feed a subsidised e-bike to travel to work. In addition, the B-riders
models to consider overall mobility patterns and options for received an app to prove their cycle use and to gather data
a city. for further research.
CYCLING IN TRAFFIC MODELS
Most traffic models are car and sometimes public transport-
oriented. Modelling cyclists is rare. In the Netherlands, initia-
tives have been taken by the Province of Brabant and others to
develop a cycling model. The model will use available cycling
data (cycle counts and data from the network of the Dutch Cy-
cling Federation) to determine how current multi-modal traffic
models can incorporate cycling so that new cycling infrastruc-
ture can be most effectively planned. The model will allow
new combinations of initiatives to be examined. For instance,
how well will a train-bike combination work? The traffic model
can be used to assess the increase in cycle traffic as a result
Figure 19: Traffic education can start at an early of an upgrade in cycling infrastructure to a train station and to
age. (Photo: unicoz). determine which infrastructural measures work best.
21Smart choices for cities
Cycling in the City
From ideas to policy: Recommendations for approaching investments
in cycling.
Cycling in the city should be seen as a means to reach cycling associations and consultants should be developed to
a goal. Goals, for example, can be to give part of city a build cycling knowledge. A good way to start is with pilot
new economic impulse or to make a neighbourhood more projects as new knowledge can be generated. Finally, collect
livable, without negative effects to the others. Cycling is not cycling data on which to base policies,
the only mode which can reach such goals, and the other
way around, integration is key to success in cycling policies. The creation of a Sustainable Urban Mobility Plan, or SUMP,
Integration of cycling projects can be with other projects such offers is an opportunity to integrate and foster cycling in the
as urban renewal, economic investment in neighbourhoods, urban environment. Cities are currently not obligated by the
or with policies for other modes (car or public transport). It is European Commission to create a SUMP, although this is
important that the right infrastructure or equipment is in place encouraged.
and the supporting actions are taken.
A SUMP is more than a traditional traffic and transport plan.
A successful cycling policy can only be developed and It aims to engage different stakeholders to cooperate on the
achieved by an organisation which has knowledge and data development of a sustainable urban mobility plan. One of
about cycling and has contacts with other organisations on the main elements of a SUMP is the balanced and integrated
cycling issues. Working within a municipality to develop development of all modes, including cycling, consistent
cycling knowledge, and linking plans to those of other with the approach described in this note. The European
government policies, with the aim to generate recognition Commission offers support to European cities to tackle urban
and funding for cycling, is important. In addition to mobility challenges. For more information, see http://www.
municipal employees, contacts with external stakeholders eltis.org/mobility-plans.
are important. Relationships with engineering firms, schools,
22Smart choices for cities
Cycling in the City
ODENSE
Odense, one of the five cities in the CIVITAS II MOBILIS project, implemented ambitious plans for a cycle and pedestrian
bridge and other measures which created space for alternative modes. The MOBILIS project ran from 2005-2009. The
Odense effort focused on modal shift and influencing habits in personal travel choice, and focused on 4 zones in the
city. Groups of stakeholders cooperated to implement the measures. The approach integrated three dimensions in order
to promote change in the use of the physical environment (CIVITAS MOBILIS , 2009). The three dimensions are:
■■ Transport site: spatial and infrastructural
■■ Transport form (modes)
■■ Transport users (interpersonal)
Integration took place at different levels. When planning included 30 km/hour zones, infrastructure such as street
the measures, existing and diverse plans and policies bumps and in some cases access restrictions for cars,
were brought together in the project. The Odense MOBILIS and road narrowing. The environmental zone measures
project depended upon cooperation between Public and were achieved through cooperation between the resident
private organizations in the area of transport. Odense and housing associations, public transport operation, the
piloted measures in “priority zones”, to test and learn from cyclist federation and public services.
the pilots before expanding the application area.
In terms of transport effects, a drop of 35% in the volume
The ring road and bridge (1997) completed the outer of car traffic was measured in the pilot area with access
ring road around Odense, and offered the Odense City restrictions by street closing. The volume of car traffic
Council the opportunity to move transit car and lorry traffic increased by 6% in the other pilot area, without access
away from the city centre, foster further local modal shift, restrictions. The average car speed dropped by 12%
improve the quality of the physical environment, improve and 22% in the two areas. Green waves, interactive
traffic safety and improve conditions for public transport information, countdown signals and cycle lotteries were
services. useful for promoting cycling and walking in the area.
Cycling increased by 62% in one of the areas, with the
Five measures taken by Odense were reported on. number of cyclists and pedestrians holding steady. The
One measure, called “Environmental zones”, aimed to residents of the areas indicated in an internet-based
increase the quality of life in the pilot area for residents survey that before the measures, 24% thought that the
and road users, and to reduce the negative impacts of possibility to cross the street was good or very good; after
motor vehicles on residential environments. The measures the measures, the share increased to 61%.
focused on encouraging mobility by active modes, by
implementing countdown signals, interactive information In summary, Odense successfully showed that cycling can
systems providing information for pedestrians and be promoted by implementing a combination of measures
cyclists about cycle lanes, cultural information and safety in the urban environment, deploying both infrastructure
recommendations, and implemented 4 cycle scanners and supporting measures.
to encourage and reward cyclists. Flanking measures
23Smart choices for cities
Cycling in the City
Bibliography
■■ Bell, D., Chaloupka, F., & Ohg, R. (2015). Technol- ■■ German Federal Highway Research Institute
ogy Potential of ITS Addressing the Needs of Vulner- (BASt). (2016, May 1). In-DeV Project. Retrieved
able Road Users. from http://www.indev-project.eu/InDeV/EN/
News/Newsletter/download/newsletter-01.pdf?__
■■ Boone, A. (2013, December 6). Streetsblog. Retrieved blob=publicationFile&v=1
from http://sf.streetsblog.org/2013/12/06/three-
years-later-san-mateo-county-adds-bike-lanes-to-dead- ■■ Harms, L. (2015, September 3). Trends in fietsge-
ly-interchange/ bruik (presentation Masterclass).
■■ CIVITAS MOBILIS . (2009). Evaluation Report, Deliver- ■■ Hendriksen, I., Fekkes, M., Butter, M., & Hildebrandt,
able 3.2. http://www.civitas.eu/sites/default/files/ V. (2010). Beleidsadvies Stimuleren van fietsen naar het
civitas20mobilis20final20evaluation20report.pdf. werk. TNO.
■■ de Hair, S., Versmissen, T., de Goede, M., Kwakker- ■■ Holland-Cycling. (2016, 8 26). National Bike Counting
naat, M., Engbers, C., Dubbeldam, R., Buurke, J., Week . Retrieved from National Bike Counting Week
Schaake, L., van Steenhoven, H., Zeegers, T., Dogter- : http://www.holland-cycling.com/blog/256-nation-
om, N. (2013). Veilig & Bewust op de fiets, Specificatie al-bike-counting-week
van een feedforward-systeem. Rapportage TNO 2013
R11959. ■■ Intelligent Energy Programme of the European Union.
(n.d.). www.cyclelogistics.eu. Retrieved from http://
■■ de Hartog, J., Boogaard, H., Nijland, H., & Hoek, G. www.cyclelogistics.eu/docs/111/D6_9_FPR_Cyclel-
(2010). Do the health benefits of Cycling Outweigh ogistics_print_single_pages_final.pdf
the Risks? Health Environmental Perspectives, 1109-16.
■■ ITS Directive. (2010, July 7). Directive 2010/40/EU of
■■ Engbers, C. R.-B. (2013). Needs and wishes of older the European Parliament and of the Council on the frame-
cyclists regarding a feed-forward system to support work for the deployment of Intelligent Transport Systems
cycling. International Cycling Safety Conference. in the field of road transport and for interfaces with other
modes of transport .
■■ EPOMM. (2016, July 14). Retrieved from European
Platform on Mobility Management: http://www. ■■ Joseph, B., Pandig, V., Zangbar, B., Amman, M.,
epomm.eu/tems/index.phtml Khalil, M., O’keeffe, T., & Friese, R. (2014). Rethink-
ing bicycle helmets as a preventive tool: a 4-year re-
■■ European Environment Agency. (2015). Air quality in view. European journal of trauma and emergency surgery,
Europe - 2015 report. 729-732.
■■ European Road Safety Observatory. (2015). Traffic ■■ KIM. (2014). Mobiliteitsbeeld . Den Haag: Ministerie
Safety Basic Facts. European Commission. van Infrastructuur en MIlieu.
■■ Fiestersbond. (2016, August 30). Retrieved from ■■ KIM. (2016). Mobiliteitsbeeld . Den Haag: Ministerie
http://www.fietsersbond.nl/english-info#.V8WLe- van Infrastructuur en MIlieu.
OOLnIU
■■ Loendersloot, R., Embassy, D., & Groep, L. (n.d.). Cy-
■■ Gemeente Almere. (2013). Almere Bike City de duur- cling is for everyone !
zame fietsstad. Almere.
24Smart choices for cities
Cycling in the City
■■ Methorst, R. (2010). Identification of Quality Needs. ■■ The Local DK. (n.d.). Retrieved from http://www.the-
COST 358 Pedestrian’s Quality Needs, PQN Final local.dk/20150603/copenhagen-claims-its-spot-on-
Report - Part B5 Documentation. top-of-bicycling-world
■■ Oldenziel, R., & de la Bruhèze, A. A. (2016). “Eu- ■■ TNO. (2016). Retrieved from https://www.tno.
rope: A century of Urban Cycling”, in ”. In “Cycling nl/en/focus-area/urbanisation/mobility-logistics/
Cities: The European Experience (p. 7). Foundation for safe-mobility/cats-cyclist-aeb-testing-system-develop-
the History of Technology. ment/, consulted 4 July 2016
■■ Op den Camp, O., Ranjbar, A., Uittenbogaard, J., ■■ TNO. (2016, 8 26). CATS: Cyclist-AEB Testing System
Rosen, E., & Buijssen, S. (2014). Overview of main development. Retrieved from TNO: https://www.tno.
accident sceanrios in car-to-cyclist accdicents for use nl/en/focus-area/urbanisation/mobility-logistics/
in AEB-system test protocol. Proceedings, International safe-mobility/cats-cyclist-aeb-testing-system-develop-
Cycling Conference. Goteborg, Sweden. ment/
■■ PBL Netherlands Environmental Assessment Agency. ■■ TNS Opinon & Social. (2013, June). ATTITUDES OF
(2016). Cities in Europe Facts and Figures on Cities and EUROPEANS TOWARDS URBAN MOBILITY - Special Eu-
Urban Areas. robarometer 406. Spec Eurobarom 406. Retrieved from
http://ec.europa.eu/public_opinion/archives/ebs/
■■ Rijksoverheid. (2016, August 25). Wanneer mag ik op ebs_406_en.pdf\nhttp://ec.europa.eu/public_opin-
een speed-pedelec rijden. Retrieved from Bijzondere ion/index_en.htm.
voertuigen: https://www.rijksoverheid.nl/onderw-
erpen/bijzondere-voertuigen/vraag-en-antwoord/ ■■ Transport for London. (n.d.). Retrieved from https://
welke-regels-gelden-er-voor-een-elektrische-fiets-met- tfl.gov.uk/info-for/deliveries-in-london/delivering-
trapondersteuning safely/safer-lorry-scheme, consulted 4 July 2016.
■■ Sassen, W. v. (2011). The communication- and market- ■■ Walker, P. (2016, April 28). Utrecht’s cycling lessons
ing campaign to promote cycling in the City of Munchen. for migrants. The Guardian.
Munchen.
■■ Wegman, F., Zhang, F., & Dijkstra, A. (2012). How
■■ SWOV. (2006). Advancing Sustainable Safe. Leidschen- to make more cycling good for road safety? Accident
dam. Analysis & Prevention, 19-29.
■■ SWOV. (2012). Factsheet: Achtergronden bij de vijf Du- ■■ World Health Organisation Europe. (2014). Cy-
urzaam Veilig-principes. Leidschendam. cling Can Create at Least 76 600 Jobs and Save 10 000
Lives Every Year in Major European Cities. Retrieved
■■ SWOV. (2012). SWOV-Factsheet Fietshelmen. Retrieved from http://www.euro.who.int/__data/assets/
from https://www.swov.nl/rapport/Factsheets/NL/ pdf_file/0004/247423/Cycling-can-create-at-least-
Factsheet_Fietshelmen.pdf 76-600-jobs-and-save-10-000-lives-every-year-in-ma-
jor-European-cities-Eng.pdf
■■ SWOV. (2013). SWOV-Factsheet Fietsers. Retrieved
from http://www.swov.nl/rapport/Factsheets/NL/
Factsheet_Fietsers.pdf
25Smart choices for cities
Cycling in the City
NOTES
26Smart choices for cities
Cycling in the City
NOTES
27Smart choices for cities Cycling in the City
You can also read