Cycling in the Netherlands
←
→
Page content transcription
If your browser does not render page correctly, please read the page content below
Cycling in the Netherlands
                                                       Cycling in
                                                       the Netherlands

With special thanks to:
Cycling in
the Netherlands
Index
Preface 7 Chapter 4: Practical measures 53
4.1 Spatial policy: nearby destinations 55
Chapter 1: Cycling in the Netherland 9 Example N Houten: spatial structure aimed at slow traffic 54
1.1 Bicycle use in the Netherlands 11 4.2 R
oad infrastructure for cyclists 55
1.2 Dutch bicycle use in a European perspective 12 Example O Zwolle: Independent bicycle network 56
1.3 Bicycle ownership and theft 15 Example P Veenendaal: Systematic 300 metre mesh width 58
1.4 Bicycles and traffic safety 15 Example Q Innovative bicycle bridges 60
1.5 Bicycle policy works 17 Example R Zwolle: the city of bicycle lanes 62
1.6 Bicycle and traffic safety 19 Example S Bicycle highway between Breda and Etten-Leur 64
1.7 Bicycle policy works 19 Example T Bicycle street Oss municipality 65
1.8 Cycling and health 23 4.3 Good bicycle parking facilities 67
1.9 International dissemination of cycling expertise and experience 23 Example U Bicycle parking in Utrecht 66
Example V Free guarded parking in Apeldoorn 66
4.4 Tackling bicycle theft 69
Chapter 2: The Dutch approach in brief 25 Example W Winterswijk: winner of the best approach to bicycle theft 68
2.1 Objectives of bicycle policy 26 Example X Innovative approach in Amsterdam 68
2.2 Municipal bicycle policy: traditionally at the core 26 4.5. E ducation, information and enforcement 71
Example A Groningen: consistent policy 29 Example Y Province of Brabant Traffic Safety Label 70
Example B Amsterdam: complex organisation and comprehensive bicycle policy 31
4 5
2.3 Provinces and urban areas: decentralised directors 33 Appendix: Other English-language information about cycling in the Netherlands 73
Example C Zeeland: bicycle Action Plan 32
Example D Gelderland: broad and progressive bicycle policy 32
2.4 The state: support for decentralised policy 33
Chapter 3: Facilities for all target groups 37
3.1 Shopping by bicycle 39
Example E Houten and Veenendaal: bicycle traffic and flourishing retail trade 38
3.2 Cycling to work 41
Example F Company bicycle: effective employer measure 40
Example G Trappers: Innovation in mobility management 40
3.3 Cycling to school 45
Example H Safer passage for children through Delft 43
Example I The Hague: Guarded parking in secondary schools 44
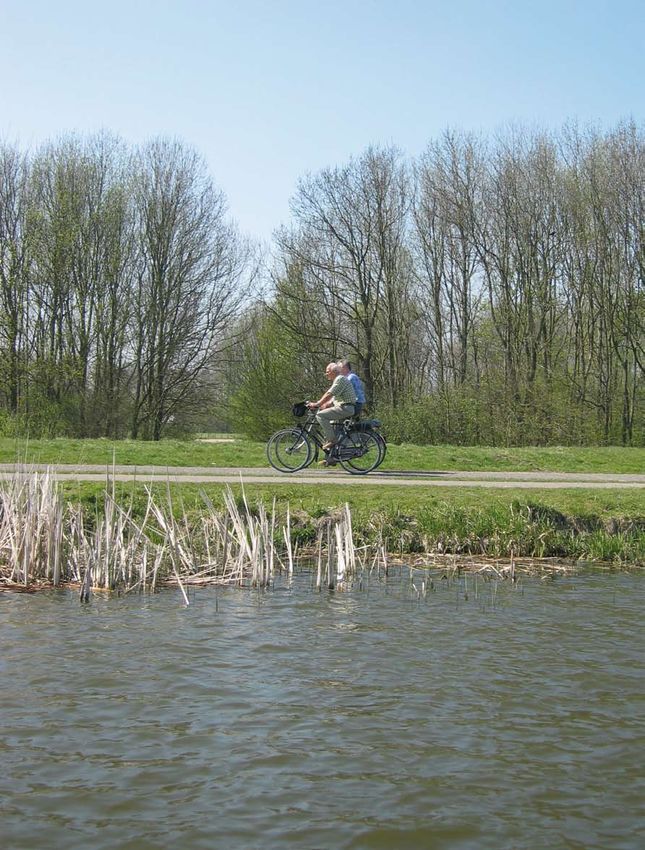
3.4 Cycling and recreation 47
Example J Recreational cycling Zeeland 46
3.5 Cycling in the chain – the combination with public transport 48
Example K The Public Transport Bicycle 51
Example L The storeroom in Leiden and the bicycle flat in Amsterdam 51
Example M Park and Bike Amsterdam 51
Index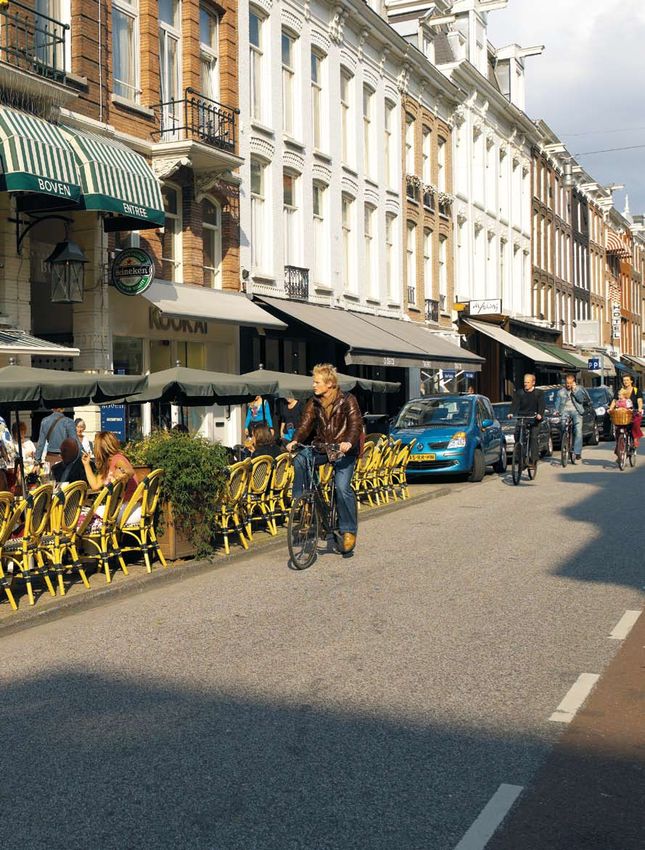
Preface
    ‘I want to ride my bicycle, I want to ride my bike’. Queen’s ‘Bicycle race’ could easily be the
    Dutch national anthem. That’s how much and how often we use our bicycles.

    Why? Because cycling means arriving at work, school or the gym in a more alert frame of
    mind, feeling creative and positive. So I hope that this brochure will help boost the number of
    kilometres cycled worldwide.

    The Netherlands has a great cycling reputation, but cycling is currently trendy all over the world.
    In many countries, the bicycle is becoming more and more important, in traffic as well as in
    transport policy.

    Here are some very good reasons why:
    One: it improves the flow of traffic in towns. The bicycle does not take up much room, either on
    the road or when parked and travels flexibly from door to door. The bicycle oils the wheels of the
    municipal traffic system. Two: cycling and walking are by far the most sustainable way of getting
    around. No emissions, no noise. Three: cycling is healthy, making it easy to get your vital daily
6                                                                                                         7
    exercise. If you cycle, you not only combat obesity, you also help prevent heart disease, diabetes
    and cancer. It makes people fitter and more alert.

    Other countries regularly ask the Netherlands to help them shape their own bicycle policy.
    We welcome such requests, because we want to contribute to a more sustainable, cleaner,
    healthier and more efficient transport system. With this brochure, for example, which introduces
    you to cycling in the Netherlands.

    After the successful last edition, we now present the new, updated edition. We also invite you
    to visit the website www.fietsberaad.org or www.bicyclecouncil.org where you will find lots of
    information about cycling in the Netherlands and experiences in other countries, presented in a
    clear and well organised way.

    Keep cycling!

    Tineke Huizinga,
    State Secretary of Transport, Public Works and Water Management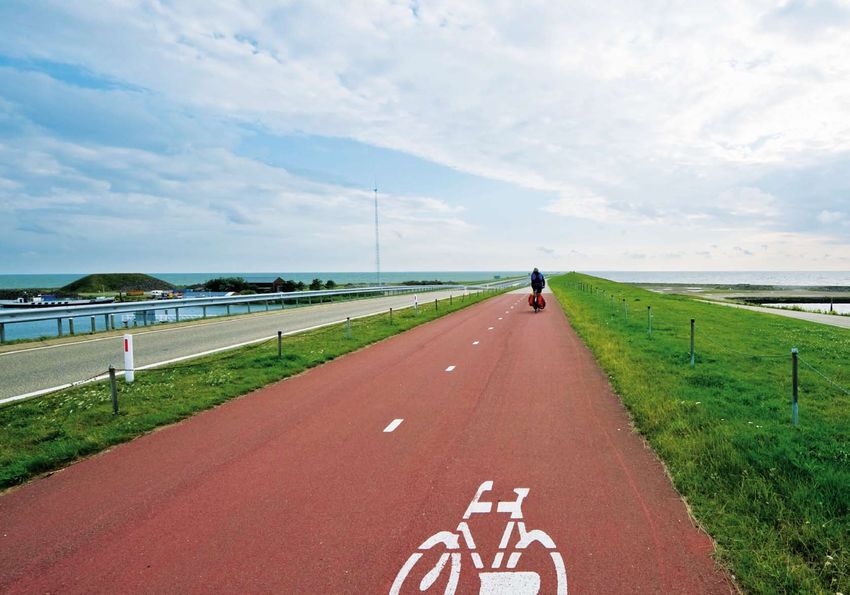
Cycling in the
Netherlands
The Netherlands and cycling have been synonymous for years. In this
chapter we list a number of statistics and facts about the past and present
of cycling in the Netherlands.
100% Car driver or passenger 1.1 Bicycle use in the Netherlands
90% Train
80% 36% Bus/Tram/Metro
48%
70% Walking
60% Transportation methods and distances
2% 76% 81% Bicycle
50% Despite the increasing distances covered by the Dutch, the bicycle has retained its popularity.
2%
27%
40% 3% The bicycle is used for more than a quarter of all journeys. In fact for distances up to 7.5 km, the
30% 19% bicycle is the most popular means of transport. In 2007, 34% of all trips up to 7.5 km were made
20% by bicycle. (Figure 1)
34%
26% 6%
10% 11%
15% 4%
0% 2% Bicycle use very much depends on the distance covered. As 70% of all journeys in the Netherlands
Total Up to 7,5km 7,5km to 15 km 15km or more are still shorter than 7.5 km, the strong position of the bicycle over short distances (35%) also
70% 11% 18% Proportions of all journeys extends into the total modality split (27% bicycle). At the same time, it is interesting to note that
the bicycle is regularly chosen above 7.5 km: 15% of journeys in the category 7.5-15 km.
Figure 1: Journeys according to main transportation means and distance category in 2007
(Source: Mobiliteitsonderzoek [Mobility Study] Nederland 2007, AVV
Motives
In the Netherlands, the use of bicycles is not restricted solely to school-going children. Certainly,
Proportion of motives
in all journeys bicycle use among those involved in ‘education/study’ is the highest (50%), but this only relates to
a limited percentage of all journeys (9%). (Figure2)
16% 59% 11% 6%
Touring, hiking 11%
Social-recreational 31% 14% 50% 6% 12% The high overall cycling proportion (26%) is far more due to the fact that the bicycle achieves a
21% 14% 60% 5% more or less comparable share in all travel motives – and particularly in the most important motives
Visit 14%
in terms of scope, such as commuter travel and shopping.
10 Education 50% 18% 18% 14% 9% 11
Shopping 28% 18% 49% 5% 20% Bicycle In the Netherlands, many people do not make absolute choices between using the car or the bicy-
Walking cle over shorter distances. The image of ‘sometimes the bike and sometimes the car’ is dominant.
Services, personal care 18% 18% 55% 9% 4%
Car driver (Figure 3)
Business trips 11% 3% 79% 7% 3% and Passenger
Commuter travel 25% 4% 62% 10% 17% Other People who do have a choice between using the car or bicycle for their short trips tend to alternate
in their respective use.
0% 20% 40% 60% 80% 100%
Figure 2: Journeys by main means of transport and motive in 2007 (Source: Mobiliteitsonderzoek [Mobility Study] Nederland 2007, AVV) Urban bicycle share
Cycling is a very popular activity in the Netherlands, but this does not mean that cycling is preva-
lent all over the country. Table 1 shows the top five cities with the biggest cycling percentages and
Municipality Cycle share
the five cities with the lowest cycling percentages in 2003.
Commuter Groningen 38%
29% 40% 31% On average, the Dutch chose the bicycle for 26% of their journeys in 2007.
travel Zwolle 37%
In the cities with the highest bicycle use such as Groningen and Zwolle, the cycling percentage
Going out Leiden 33%
12% 48% 39% is about 50% above the dutch average. In the cities with the lowest bicycle use, it is about 50%
Ede 32%
Sports or under the national average.
Clubs visit 28% 41% 30% Veenendaal 32%
Lelystad 19%
Transporting
6% 70% 24% Capelle aan den IJssel 18%
children
Sittard-Geleen 17%
Shopping 12% 59% 30% Rotterdam 16%
Heerlen 10%
0% 20% 40% 60% 80% 100%
Never car, always bike Table 1. Percentage of bicycle use in 2003 in a number of
Dutch cities with more than 50,000 inhabitants
Sometimes car, sometimes bicycle
(Source: CBS)
Never bicycle, always car
Figure 3: Choice of car or bicycle for journeys up to 7.5 km
per travel reason. (Source: Study on Short Trip Relocation
Repertoire, citizens with a car)
Cycling in the Netherlands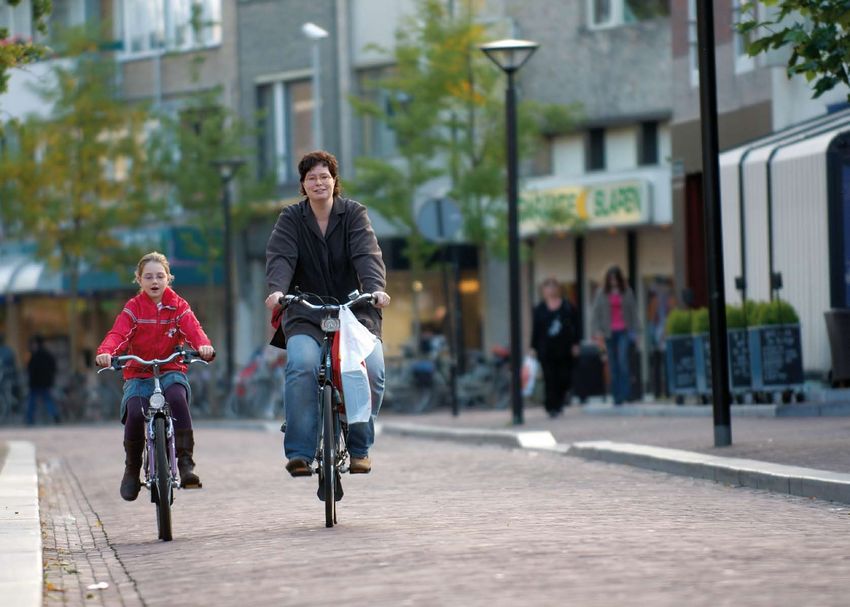
1.2 Dutch bicycle use in a
Thus outside the Netherlands there are other European cities with a high level of bicycle use (above
20% in the modal split).
European perspective Historical developments
If we consider the historical developments in bicycle use, there are clear differences between Dutch
cities and other European cities. There are also striking similarities. Figure 5 shows the development
of bicycle use in nine European cities. The overall trend at the start of last century shows an enormous
There are no reliable international/European statistics showing comparable figures per country for increase in bicycle use in most European cities. Between 1950 and 1970, bicycle use declined dramati-
bicycle use. In 2006, largely through searching on the Internet, a number of figures relating to the cally with the rise of the car. Ultimately bicycle use rose slightly again in most cities.
use of bicycles in European cities and countries were compiled. The statistics below (Table 2, Figure
100 Amsterdam
4) always start from figures that are known to relate to the bicycle share in all journeys (by inhabi-
Eindhoven
tants of the city or country concerned). These figures originate from many sources; at least two per
80 Enschede
city (minor differences have been erased).
South East Limburg
60 Antwerp
National figures Picture at the municipal level
Approx Manchester
(recent years) 40 Copenhagen
The Netherlands 26% The top municipalities score between 35% and 40%; cities with
Hannover
the lowest bicycle use rate between 15% and 20% 20 Basel
Denmark 19% The differences among the larger cities are relatively small: in
general at the level of 20% of all trips 0
Germany 10% The western federal states have a higher average bicycle use, 1920 1930 1940 1950 1960 1970 1980 1990
especially Nordrhein-Westfalen. Several cities with bicycle shares
Figure 5: Historical development in bicycle share in 9 European cities Source: A.A.ALbert de la Bruheze
between 20% and 30% and F.C.A. Vervaart. Bicyle traffic in practice and policy in the twentieth century, 1999
Austria 9% Top: Graz (14%) and Salzburg (19%)
12 Apart from the general parallels in the trend lines, we immediately find very striking differences. 13
Switzerland 9% Several cities at a higher level, like Bern (15%), Basel (17%) and
Differences in the level on which this general continuous movement takes place, and differences in
especially Winterthur (approx. 20%)
strength of the rise and fall of the bicycle use share:
Belgium 8% Many cities in Flanders approach 15%. Top: Bruges - almost 20%
• A high bicycle share (more than 30%) for Amsterdam, Eindhoven, Enschede and Copenhagen - ci-
Sweden 7% Cities: 10%. Extremes: Lund and Malmö 20%. The small city of
ties that never saw the arrival of a ‘bicycle use-devouring’ public transport system and where bicycle
Västerås: 33%
traffic had always been a regular component of traffic policy. Accepting the cyclist as a ‘normal’
Italy 5% A few striking exceptions, especially in the Po Plains, with places
traffic participant with equal rights in the ’50s and ’60s has been a crucial factor in these cities.
like Parma (over 15%) and Ferrara (around 30%). Another top
• An average bicycle share (approx. 20%) for South-East Limburg and Hanover. Here, the rise of the
city: Florence (over 20%)
car coincided with a more manifest pro-car policy and a spatial structure which was more in line
France 5% Top: Strasbourg 12% and Avignon 10%
with the car.
Ireland 3% Virtually no upward extremes (Dublin 5% at most)
• A low bicycle share (approx. 10% or below) for Antwerp, Manchester and Basel. Here it is espe-
Czech Republic 3% A few cities with some degree of bicycle use (Ostrava,
cially the car-oriented traffic policy that explains matters, and the manifest influence of an early,
Olomouc and Ceské Budejovice, between 5% and 10%) and
properly functioning public transport system (Manchester). The decline which was the result of the
some with an even higher bicycle use (Prostejov 20%)
arrival of the motor car continues uninterrupted and without ‘brakes’, because all relevant influen-
Great Britain 2% Some isolated cities with a much higher degree of bicycle use (York
cing factors are pointing in the same direction: a negative collective picture on cycling, a strong
and Hull 11%, Oxford and especially Cambridge nearing 20%)
car-oriented policy, realisation of a large-scale car infrastructure, strong suburbanisation.
Table 2: Bicycle share in all journeys in some other European countries and cities
The differences occuring in the 90’s can mainly be explained from the view of local policy on the role
and value of the bicycle occurring between cities in the ’90s can in the first place be explained from
30% 27%
Figure 4: Bicycle share in the view of local spatial and traffic policy and the resulting ‘local picture’ of the role and value of
25% all journeys in some other
European countries bicycle use. However, as this explanation is a long-term one it must be considered over decades. With
20% regard to spatial policy and picture-forming this conclusion is not surprising, as by their very nature
19%
15% they will only very gradually result in changes. All this left aside, traffic policy also appears to have a
10%
10% 9% 9% relevant, continuous influence. Political choices made in the ’50s and ’60s still resound in our present
8% 7%
time. In various foreign cities a negative image and the ensuing concrete ‘anti-bicycle’ measures were
5% 5% 5%
2% intense to a degree that is hard to imagine for the present-day people of the Netherlands.
0%
her The
s
k
y
tria
land
ium
den
Italy
ce
Brit t
ain
a
land
mar
man
Gre
Fran
Aus
Belg
Swe
tzer
Den
Ger
Swi
Net
Cycling in the Netherlands
1.3 Bicycle ownership
1.2 8.0
1.1
1.0 7.0
0.83 6.0
0.8 0.77
0.67 5.0
0.63
0.6 4.0
0.50 The Netherlands is the only European nation with more bicycles than people. (Figure 6). On aver-
0.45
0.4 0.40 0.40 3.0 age, the Dutch own 1.11 bicycles per person and the number of bicycles sold in the Netherlands is
0.34
2.0 also high: 1.2 million bicycles in 2005, for 16 million residents. In absolute terms, more bicycles are
0.2 0.18
1.0 only sold in various European countries with considerably higher populations: 4.9 million bicycles
0 0.0 in Germany (for 82 million inhabitants), 3.2 million bicycles sold in France and 2.5 million in Great
3
4
5
6
7
8
9
0
1
2
3
4
5
6
7
s
k
y
den
and
i um
Italy
land
tri a
ce
in
Britain (both 60 million inhabitants). In the Netherlands, by far the most bicycles are sold by speci-
199
199
199
199
199
199
199
200
200
200
200
200
200
200
200
land
mar
man
Spa
Fran
Aus
Swe
Finl
Belg
Eng
alist dealers: 77% in 2005. These shops specialise in the sale of bicycles and bicycle accessories and
Den
her
Ger
Net
generally have a workshop for maintenance and repair. The share in bicycle sales of other trading
The
outlets (department stores, discount stores, mail order etc.) is rising however: from 10% in 2000 to
Number of cycles per inhabitant Number of thefts per 100 bicycles
Figure 6: Bicycle ownership in a number of European coun- Figure 7: No. of stolen bicycles per year 23% in 2005. The average price of a new bicycle is 579 Euros.
tries in 2004 (Source: European Commission) (source: Police Monitor until 2008, since 2005: Safety Monitor)
1980 2001 2005
Passenger km by bicycles
Passenger km by car
9,9 billion
107,1 billion
13,1 billion
141,6 billion
14,4 billion
148,8 billion
1.4 Bicycle use by population
No. of deceased cyclists
No. of deceased car occupants
426
910
195
477
181
371
groups
Table 3: Number of passenger kilometres and number of deceased cyclists and car occupants in
14 15
1980 and 2001 (Source: CBS-OVG and AVV-BG
In some countries, cycling has a bad image and represents low social status: the cyclist is appa-
rently not able to buy a car. This is not the case in the Netherlands, where bicycle use is the same
for almost every population group. In the Netherlands, cycling reflects a sporty, environmentally
aware lifestyle. Figure 9 shows that the population groups with the highest and lowest educational
Killed cyclists
level are the ones which cycle most. The groups with higher incomes tend to cycle somewhat less
per 100 million km
than those with lower incomes (Figure 10).
12
Italy
10 1.0
0.9
8 Austria 0.8
Great Britain 0.7
6 Finland 0.6 Number of trips per day per
0.5 person by bicycle
Switzerland
4 0.4
Germany Denmark
0.3 Figure 9: bicycle use according
Sweden
2 Norway 0.2 to educational level (2007)
The Netherlands 0.1 Source: Mobiliteitsonderzoek
Cycling km
per person per day 0.0 Nederland
0 1 2 3
ars
ary
seco lower
ry
seco igher
ry
rsy
nda
nda
2 ye
e
prim
univ
Figure 8: Relation between accidents and bicycle usage
h
Number of trips per day per
        1.2
                                                                                             person by bicycle (yearly
        1.0
                                                                                             income)
        0.8
        0.6
                                                                                             Figure 10: bicycle use
        0.4
                                                                                             according to income (2007).
        0.2
                                                                                             Source: Mobiliteitsonderzoek
        0.0
                                                                                             Nederland

                     ars

                           incown
                               me

                                      eur

                                             150 eur to
                                                    eur

                                                               225 eur to
                                                                       eur

                                                               300 eur to
                                                                       eur

                                                                       eur
                 2 ye

                              o

                                    500

                                                 00

                                                                    00

                                                                    00

                                                                  000
                           No

                                             500

                                                                  0

                                                                  0
1.6 Bicycles and traffic safety

        In the Netherlands cyclists are fairly vulnerable, given the chance of injury per kilometre covered.
        However, in recent decades, the safety of cyclists has steadily improved. The annual number
        of road accident victims has halved since 1980, both in terms of cyclists and those in cars. (Table
        3, page 14). This decline must also be set against the enormous rise in car and bicycle use. (In total
        both cars and cyclists covered 32% more distance in 2001 than in 1980). Statistically, the number
        of potential confrontations between cars and bicycles should thus increase exponentially.
        Consequently, the decline in danger is spectacular. More traffic and a high bicycle use do not
        therefore automatically mean more traffic danger. Besides making a comparison over time, this
        can also be demonstrated by comparing countries and even Dutch municipalities. Figure 8 (page 14)
        clearly shows that the risks for cyclists are lower in countries with a hihger bicycle use. The same
        pattern is visible when Dutch municipalities are compared. In municipalities with high bicycle use,
        the risk of a cyclist being injured in a traffic accident is on average 35% lower than in municipali-
        ties with fewer cyclists.

        The same pattern recurs in various studies: the higher the bicycle use, the safer it is for cyclists.
        There are a number of explanations for this, involving the conduct of road users and the attention
        that policy-makers pay to the bicycle. Firstly, higher bicycle use leads to modified conduct on the
        part of all traffic participants, because cyclists are more dominant in the overall road picture and
        because more traffic participants have cycling experience. Secondly, higher bicycle use often goes
18                                                                                                                             19
        together with lower car use, thus reducing the chance of conflict with car traffic. Thirdly, almost
        every car driver is also a bicyclist (60% of the Dutch cycle at least three times a week, 80% at least
        once a week), which implies that car drivers know how cyclists behave.Finally the policy
        explanation: high bicycle use creates more support for bicycle policy, so that more is invested in a
        safer cycling infrastructure.

        Something that should not be overlooked in the safety section: Liability. In some countries,
        bicycling is seen as causing danger, which sometimes ends up in an anti-cycling policy. The Dutch
        philosophy is: Cyclists are not dangerous; cars and car drivers are: so car drivers should take the
        responsibility for avoiding collisions with cyclists. This implies that car drivers are almost always
        liable when a collision with a bicycle occurs and should adapt their speed when bicycles share the
        roads with cyclists

     1.7 Bicycle policy works

        It is regularly asked why there is so much cycling in the Netherlands. A difficult question – although
        the answer clearly lies in a combination of factors. Morphological and spatial factors are obviously
        involved: cycling is easier on a flat polder than in a hilly area. And in the compact Dutch
        cities, many trips can more easily be covered by bicycle because of the short distance. Historical-
        cultural factors also play a major role. Cycling is so embedded in the Netherlands that virtually
        every child gets the first bicycle around the fourth birthday – and learns to use it.

        The arguments pro-cycling are overwhelming: it is sustainable, healthy, has zero emissions of
        everything, is silent and clean, cheap both in purchase as in providing infrastructure, is space and

                                                                                                       Cycling in the Netherlands
traffic efficient, enhances urban traffic circulation and provides more livability to residential areas.
From this perspective, the harsh anti-cycle policy of some foreign towns (see section 1.2) even
more regrettable. Despite all this evidence, none of these are the reason for the Dutch to cycle.
They just enjoy it, find it relaxing. (Figure 11)
80%
70%
60%
50%
40%
30%
20%
10%
0 joy fear anger sadness aversion
Car Bicycle Public transport
Figure 11: Emotions linked with varoius modes of transport. Source: Knowledge Institute Mobility, 2007
Obviously, to make all the advantages of cycling for society work, it is essential to have people
cycle. And to have people cycle, therefore, it should be enjoyable, relaxing and safe. This can be
achieved by what is usually called good ‘bicycle policy’. Policy works, bicycle policy works in
the Netherlands – that much is abundantly clear. Something has already been said about this in
section 1.2: the relationship between bicycle use and improving traffic safety is inherently related
20 21
to policy.
The results of the benchmarking ‘Fietsbalans’ project conducted by the Fietsersbond (cycling
association) reveal a clear link for example between bicycle use in a municipality and the quality
of the cycling infrastructure. The quality of the infrastructure has been recorded objectively with
measuring equipment and is expressed in the so called bicycle Balance Score.
In Dutch municipalities with a high bicycle Balance Score, bicycle use is on average 14% higher
than in municipalities with a low bicycle Balance Score.
In 2005 a study was completed, giving a very well-founded answer to the question of how
to explain municipal differences in bicycle use, and what role (elements of) cycling policy and
(wider) traffic policy play in this respect. Research involved 44 factors in its analysis. Very diverse
by nature, these factors were selected on the basis of existing knowledge about possible factors
influencing bicycle use. The resulting explanation model contains eleven factors – a composition of
traffic, spatial-economic, demographic, cultural and geographical factors. About one-third of the
explanatory power of this model lays in the four factors denoting something like ‘integral traffic
policy’. Almost 73% of the variance in bicycle use among municipalities is explained by these
factors. This is considerable, and we can therefore say that this model has great explanatory power.
Cycling in the Netherlands1.8 Cycling and health
As in every other Western country, lack of physical exercise and obesity caused by this and by a
poor diet are a major problem in the Netherlands. Around 11% of the population are medically
obese. But also a lot of other diseases go together with lack of physical activities like coronary and
vascular diseases, diabetes etc. According to medical experts, people are designed to move, but far
too many people lead a sedentary life, even choosing seated transportation (e.g. in cars or public
transport). Scientists agree that the bicycle is the ideal form of commuter travel and that it is an
excellent way to tackle the exercise problem. Half an hour of moderate exercise a day is sufficient
(besides a healthy diet), and this can be achieved in commuter travel: cycling all the way (up to
15 km) or in combination with public transport. Research has shown that absenteeism among
employees who cycle is clearly lower than among other employees. Measures to promote cycling
to work will easily recoup any investment.
1.9 International dissemination of
cycling expertise and experience
22 23
Sustainable mobility is a ‘hot topic’ at a time when climate change is also a matter of concern.
And the bicycle is the cleanest, most sustainable, healthiest and fastest mode of urban transport.
In terms of greenhouse gas emissions, the bicycle is than 100 times more sustainable than the car
and much more sustainable than public transport too. Furthermore, a bicycle friendly town (e.g.
Houten, Groningen and Zwolle) results in a better quality of urban life.
This is why many countries and towns are showing more interest in cycling and promoting bicycle
use, looking to the Netherlands as the birthplace and utopia for cycling. It is also the reason for
the planned coordination aimed at sharing Dutch knowledge and experiences with cycling. An
international version of the fietsberaad-website (www.bicyclecouncil.org) has been created which
(initially mainly in English) provides translations of publications and examples of Dutch and inter-
national cycling policy. There is also a desk for questions from and presentations for foreign parties.
Assist can be offered through the website for visiting excursions and other meetings. This desk is
also accessible via www.bicyclecouncil.org.
Cycling in the NetherlandsThe Dutch approach in brief The previous chapter shows that a consistent approach by Dutch policy makers to the bicycle has had a demonstrable effect. Municipalities which have had a focused bicycle policy for some time have a higher bicycle share than other cities. Traffic safety has also benefited from the bicycle policy. This chapter outlines the Dutch approach. How does the bicycle policy come about? Which parties are involved in it and what is the link between the funding of policy and its implementation? Involvement at various governmental levels (state, provinces, city areas, water boards and munici- palities) is also considered. Firstly, however, the objectives of bicycle policy are reviewed. Why do the Dutch authorities invest money and manpower in bicycle policy?
2.1 Objectives of bicycle policy Where something needs to be done about bicycle traffic in a municipality and what measures need
to be taken is generally based on accident figures and traffic counts. Municipalities often also carry
out pragmatic research into bottlenecks, from which conclusions are drawn. Input from the cycling
association is also an important basis for measures.
Encouraging bicycle use is not an isolated objective. Stimulating bicycle use and providing cycling
facilities serve a broad range of social objectives. By way of illustration, here are the objectives of Funding
the Amstelveen bicycle Policy Memorandum 2006-2015: Bicycle policy obviously costs money. To fund the bicycle policy, most municipalities have specific
budget allocations. These are used to ensure continuity in bicycle policy implementation.
• Increasing the accessibility of companies and facilities. Directly by improving the cycling facilities Municipalities also use external funding sources. Bicycle projects can often ride on the back of
for clients and employees arriving by bicycle. And indirectly, by stimulating clients and employees larger infrastructural projects, construction projects, traffic safety projects or spatial developments.
arriving by car to switch to the bicycle or to a combination of bicycle and public transport. Municipalities can also call on subsidies, which are administered by provinces and city areas (see
This improves accessibility for other car traffic. 2.2). For infrastructure in business parks, there are often individual arrangements, and EU funding
• Improvement in the quality of the living environment. Directly, because many inhabitants value is increasingly being used for bicycle projects. In some municipalities, bicycle parking is financed
safe and comfortable cycling facilities. And indirectly, because the bicycle replaces short car from parking incomes (car), while they may also be financed by private companies or through
journeys which produce a relatively large amount of (noise) disturbance. public-private ventures.
• Increasing social safety and traffic safety. Both objectively (reducing the number of traffic
accident victims) and subjectively (reducing feelings of danger). In the municipalities with the most intensive bicycle policy, the issue is often one of substantial
• Improvement of public health. Directly, as bicycle use contributes to a daily exercise regime. And sums allocated on an annual basis to (infrastructural) bicycle policy. At the same time there are
indirectly, the air quality improves if people use the bicycle for short journeys instead of the car. marked differences which, while not exactly implying that a municipality with a low budget is
• Increase development opportunities. Many inhabitants in Amstelveen do not have access to a ‘doing little’, more often mean that these municipalities fund their bicycle measures by letting them
car. Good and safe bicycle facilities may allow them to participate in activities independently. hitch a (free) ride on the back of other policy. See the examples in Table 4:
Disable people may also depend on the bicycle infrastructure. Indirectly, to promote indepen-
dence and the development of children, it is important that they can move independently from a Inhabitants Budget (not just Years Euros per
26 own funds: inhabitant per 27
young age. also subsidies) year
• Reducing the number of bicycle thefts. Amsterdam 742,000 100,000,000 2006 - 2010 26.95
Raalte 28,000 10,436,945 1990 - 2004 24.41
Nijmegen 159,000 10,000,000 2002 - 2005 15.66
2.2 Municipal bicycle policy: Tilburg
s Gravenhage
200,000
475,000
11,200,000
24,000,000
2006 - 2009
2002 - 2005
13.98
12.62
traditionally at the core Groningen
s Hertogenbosch
181,000
135,000
22,800,000
8,976,000
1989 - 1999
2000 - 2005
12.60
11.09
Zwolle 113,000 4,500,000 1995 - 1998 9.95
Deventer 69,000 1,361,341 1989 - 1994 3.29
Traditionally, bicycle policy has primarily been the responsibility of municipalities. Municipalities Table 4: Some details of municipal bicycle budgets, as examples.
are responsible for the majority of the facilities used by cyclists. This not only involves the road
infrastructure, but also bicycle parking facilities at shops and schools. The local cycle path network Water boards
is also a municipal responsibility. Cycle routes outside built-up areas may be the responsibility of three types of governmental
organisations. Most bicycle routes in country areas run on or alongside municipal roads. A smaller
Each municipality has a different approach to cycling. Some municipalities implement an indepen- proportion of bicycle paths run alongside provincial roads. And in the third category, there are also
dent bicycle policy, while others integrate bicycle policy in the general traffic and transport policy. bicycle routes on roads which are administered by water boards. Eight water boards, in the western
There is seldom an independent implementation programme for cycling measures; it generally coastal provinces, administer such roads in the outskirts. Alongside all the municipalities, they also
hitches a ride with other traffic and spatial measures. In implementing bicycle policy it is important implement bicycle policy, where necessary providing specific facilities for cyclists at dangerous
that the various departments are aware of each other and that projects are carried out integrally to intersections and stretches of road, and particularly by keeping vehicular traffic out of the outskirts
ensure inclusion of bicycle facilities. as far as possible.
The promotion of bicycle use and increasing traffic safety is often the main objective within the
bicycle policy. The aim is to make choosing to bicycle as attractive as possible. The construction of
good cycling networks and parking facilities are the main components. Combating bicycle theft is
a major component of the bicycle policy in large municipalities. Besides physical and spatial measu-
res to stimulate bicycle use, education and information are vital.
The Dutch approach in briefExample A Groningen: consistent policy
In terms of bicycle use the city of Groningen (180,000 inhabitants) has held the top ranking
amongst Dutch bicycle cities for many years: the share of bicycle use is around 40%. In 2002 the
‘Fietsersbond’ awarded the city of Groningen ‘City of the year’. How does Groningen do it?
The answer is in three key words: policy, coherence and continuity. The municipality executes a
broad-shouldered policy, which is solidly interpolated within the total traffic and transport policy.
Alongside this, spatial planning is focused decades ahead with vision and persistence on a compact
city, so that many activities are easily reachable by bicycle.
In Groningen the spatial policy is focused strongly on a compact city. The spatial structure exhibited
strong compression around 2000, and the 1980 outline of the city is maintained. The municipality
has worked on its policy with clear vision and persistence over some two or three decades. As a
consequence, amongst other things, most travelling distances are easily covered by bicycle. Some
78% of the inhabitants live within a radius of 3 km from the city centre, and 90% of all jobs are
located here; almost all major buildings are within 5 km radius.
During the seventies the management perceived that, apart from economic development, at-
tention also needed to be devoted to an enduring, low-scale inner city as a central point for a host
of activities, with a blend of living, working and shopping functions and favouring pedestrians,
cyclists and public transport. In 1977 this perception produced the traffic circulation plan which
divided the inner city into four sectors. It was not possible to travel between sectors by car, but it
was possible by bicycle and bus. Passing car traffic was kept outside the inner city and motorists
28 29
whose destinations were in the inner city were led via the shortest route to parking areas close to
the centre. During the eighties and nineties the parking policy was strictly implemented. Parking
with time restrictions was introduced in a broad radius around the inner city.
The Dutch approach in brief1.1 1.1B
Example Amsterdam: extensive bicycle
policy and complex organisation
In Amsterdam (with around 744,000 inhabitants) promoting bicycle use is the responsibility of the
Infrastructuur Verkeer en Vervoer (dIVV) (Traffic and Transport Infrastructure) department. A team
of bicycle policy officers works within the Strategy and Policy department (60 employees). DIVV
advises, coordinates and harmonises the bicycle policy with city areas and other relevant munici-
pal organs and organisations. Responsibility for the bicycle policy lies with the 14 city areas which
implement their own policy. This creates differences in implementation, producing problems in
coordinating the bicycle network. To achieve good policy, the policy officers must spend considera-
ble time in negotiation. A brief selection from the coordinating meetings:
• harmonisation discussions with other departments within dIVV and other city departments
• harmonisation discussions with the city districts,
• discussions in the urban ‘Platform Fiets’ (cycle platform), in which the dIVV, the ‘Dienst Ruimtelijke
Ontwikkeling’ (DRO, or spatial development department) and the ‘Fietsersbond’ (cycling associ-
ation) update each other on developments concerning bicycle policy and infrastructural measure-
ments.
Amsterdam’s ambitions:
To stimulate the use of bicycles for transportation, Amsterdam has drawn up a Long-Term Policy
Plan for Bicycles (Meerjarenbeleidsplan Fiets –MJP). This plan details the following goals for the
30 31
year 2010:
• In 2010, at least 37% of the residents of Amsterdam will use bicycles for each trip.
• In that same year, Amsterdam must achieve a score of at least 7.5 out of 10 in the Cyclists Satis-
faction Survey.
• In 2010, the number of bicycle thefts will be reduced by 40%.
The following spearheads are distinguished in the Long-Term Policy Plan for Bicycles (2007-2010):
1. Creating more and better bicycle parking facilities.
2. Constructing the three main missing links in the ‘Hoofdnet Fiets’ bicycle network.
3. Reinforcing weak links in the ‘Hoofdnet Fiets’ bicycle network.
4. Proper management and maintenance of the ‘Hoofdnet Fiets’ bicycle network.
5. Persistently combating bicycle theft.
6. Promoting traffic safety for cyclists.
7. More non cyclists on bicycles
8. Monitoring developments in bicycle use
The improvements of the ‘Hoofdnet Fiets’ bicycle network will cost an estimated € 43 million in
four years. The three most expensive projects (missing links in the form of bridges and tunnels)
constitute as much as € 24 million. Funding must largely come from regional subsidies, contributi-
ons from city sectors, the municipal MobilityFund and through the central city’s own budget.
The assumed total spending including organisation expenses will be almost € 70 million in the
period 2007 -2010.for Amsterdam’s bicycle policy - excluding specific traffic safety projects.
The Dutch approach in briefExample C Zeeland: bicycle Action Plan 2.3 Provinces and city areas:
In the province of Zeeland, the Bicycle Action Plan has been set up by the ‘Zeeuws Coördinatie- decentralised directors
punt Fiets’, or Zeeland Bicycle Coordination Point. The purpose of the bicycle Action Plan is to
stimulate cycling and thus at least maintain the current number of cyclists or even increase it.
To this end, the goal is the construction of a complete and safe bicycle network, so that the
bicycle is an attractive transport alternative. Funding has been released to provide cycling facilities Besides 12 provinces, in the Dutch agglomerations of the country’s largest cities there are 7 city
alongside provincial roads. The province implements the policy itself to a degree, but its greatest areas which, specifically in terms of traffic, have the same duties as provinces (except that they
contribution is to exercise a directorial role towards the municipalities and water boards. It is speci- do not administer their own roads). The 19 ‘middle managements’ have been allocated a central
fically expected that the province will stimulate the conduct component, for example encouraging role in traffic policy by the state in recent years, through far-reaching decentralisation from the
the use of bicycles on the school run. state level. Provinces and city areas have now acquired responsibilities to ensure policy cohesion at
regional level – in other words to promote a stronger collaboration between municipalities. In this
context, they are responsible for the division of the substantial annual subsidy funding which was
Gelderland: broad and
formerly administered by the state: infrastructure subsidies and contributions to public transport
Example D operations, together some 1,600 million Euros a year for all decentralised authorities. Of the infra-
progressive bicycle policy
structural subsidies, in practice almost all middle managements allocate a substantial part to bicycle
projects – partly at the urging of the municipalities.
The province of Gelderland implements a strong bicycle policy in areas where the province does More intrinsically, provinces and city areas often play a leading role in determining and bringing
have actual influence. Its own cycle paths are checked with a measuring bicycle to determine about a regional/inter-local bicycle network. In this context they devote attention to the inter-local
where (comfort) improvements are needed. In two years Gelderland will spend 21 million Euros on character of these bicycle networks: a bicycle path does not end at the border of a municipality
laying and improving provincial cycle paths. There is also a subsidy budget for sustainable munici- but continues on into the next one. With city areas, the issue is of relatively compact networks in
pal bicycle projects. adjoining built-up areas – therefore strongly comparable to municipal bicycle networks.
32 33
Bicycle parking facilities at bus stops are being improved and expanded – while Gelderland is also Province-wide bicycle networks place a much stronger emphasis on inter-local routes through the
working towards an extension of the Public Transport Bicycle (see page 21/example K) to small outskirts – and therefore often on recreational bicycle use. Utilitarian (intended for the focused
stations and bus terminals. Amongst other things, this would involve the innovative ‘cycle box’: an journey from A to B) and recreational cycle paths (intended as relaxation, through an attractive
automatic bicycle ‘safe’ providing locked storage for 10 and 16 Public Transport Bicycles. environment or as a route to recreational facilities) are often integrated in one provincial network.
Elsewhere, route marking has recently been highly improved on the Veluwe, the Netherlands’
largest recreational and nature reserve, with the arrival of a ‘junction network’. Finally, a striking
2.4 The state: support for
new development involves the long-distance bicycle routes through Gelderland which have been
and are being incorporated into regional planning. These routes will be protected through the
decentralised policy
spatial policy: if the routes are infringed by new spatial developments, the province will only agree
if the national cycling platform, the organisation behind the long-distance routes, agrees to an
alternative route.
The national policy on space and mobility is established in a number of national plans. These plans
set out frameworks, while decentralised authorities work out the policy in broad outline in their
own plans. Compared with other European countries, bicycle policy in the Netherlands is strongly
decentralised – intrinsically decentralised traditionally when it comes to the municipalities and
policy decentralised since the recent decentralisation from the state to provinces and city areas.
The role of the state in bicycle policy is currently a supporting one. Bicycle policy must and can be
decentralised - the state is there for the issues which require a national approach.
Four types of activities can be distinguished:
1. Setting intrinsic frameworks for the decentralised authorities
2. Looking after intrinsic issues which can only be arranged at a national level
3. Funding of decentralised bicycle policy
4. Support of decentralised bicycle policy with knowledge development and distribution.
The Dutch approach in briefThe state established the intrinsic frameworks in a general sense in the recent Mobility Memoran- of the cycling climate based on ten criteria. With the results in hand, the local department of the
dum. This contains an agreement that: ‘All authorities will stimulate walking and the use of the Fietsersbond asked the municipal management for concrete improvements for cyclists. From 2006
bicycle as the main means of transportation and as a link in the journey chain from door to door. a slightly revised methodology (Fietsbalans 2) will be applied.
Municipalities, water boards, provinces and city areas will do this, amongst other things, by ensu-
ring a bicycle network which complies with the main traffic requirements of cohesion, directness, The Stichting Landelijk Fietsplatform, or national cycling platform association, is the independent
attractiveness, safety and comfort. The authorities will also ensure parking facilities for cyclists coordination point for recreational cycling in the Netherlands. National and regional authorities and
which meet their demands in terms of quality, quantity and location.’ interest groups are represented in the platform. The Fietsplatform promotes opportunities for recre-
ational cycling in the Netherlands. To this end, it develops and manages the national recreational
Intrinsic issues which only the state can deal with are naturally legal issues surrounding traffic bicycle routes, supported by government funding (Ministry of Agriculture, Nature Management
regulations and the building decisions (bicycle parking facilities!). It is also important that bicycle and Food Quality). Besides the SLF, the ANWB, or Automobile Association, the major interest
parking facilities at stations are regarded as part of the station, as part of the transfer function group in terms of holidays, leisure time and mobility, is also relevant when it comes to the know-
– and that they are thus regarded as an issue which, just like rail transport itself, lies with the state. ledge function in bicycle policy. It is the ANWB, for example, which is responsible for much of the
For expanding the capacity (largely unguarded), so that capacity at all 380 stations will be suf- road signage, and more generally it is strongly involved in recreational bicycle use.
ficient, a total of 350 million Euros is available.
Finally SenterNovem, the organisation (‘agency’) allied to the state for subsidising innovations ai-
The third and fourth points, funding and knowledge support, are issues which the state has now med at the environment and sustainability, has a number of programmes or subsidy arrangements
emphatically ‘outsourced’ for the first time. Relatively little will now occur within the Ministry of through which, in principle, sustainable bicycle-related projects can also be supported. Substantial
Transport and Public Works itself. But conversely more will occur with other national organisations budgets are often at issue here (Regulation of CO2 reduction in personal transportation: 3 million
in terms of the knowledge function. Euros; Mobility Management programme: 2 million Euros) and in practice a number of cycling
projects are supported, particularly involving bicycle parking and rental.
Knowledge development and distribution
The knowledge function in Dutch bicycle policy is strongly developed, but also somewhat
fragmented. At least six organisations, all operating nationally, play an important role.
34 35
The Fietsberaad, or bicycle consultancy, funded by the Ministry of Transport, Public Works and
Water Management, supports the bicycle policy of decentralised authorities with knowledge and
information. The objective is to strengthen the position of bicycle traffic on the street and in policy.
The Fietsberaad, comprising some 20 experts (largely from municipalities), assists its target groups
through the collection and distribution of knowledge, statistical data, experiences and other
information – mainly through a quarterly magazine and a website. Fietsberaad has also extended
the website with a version in English language with a lot of information, experience, examples a
glossary for bicycle words and a possibility to pay a virtual visit the Dutch bicycle towns :
www.fietsberaad.org or www.bicyclecounclil.org
The KpVV (Kennisplatform Verkeer en Vervoer, or transport and traffic knowledge platform) sup-
ports the decentralised authorities with practical knowledge. In this it operates within five themes:
policy, mobility, safety, infrastructure and public transport. Attention is paid to bicycle traffic on
various fronts within these themes.
The CROW is the national knowledge platform for infrastructure, traffic, transportation and
public spaces. It makes knowledge applicable in practice – in particular through broadly supported
recommendations, guidelines and regulations, established in a large number of publications. There
are also a number of guideline publications for bicycle traffic, mainly the ‘Leidraad Fietsparkeren’
(bicycle parking guideline) and the recently reviewed ‘Ontwerpwijzer Fietsverkeer, (bicycle traffic
design manual - see Chapter 4).
The Fietsersbond (cycling association) is the interest group for cyclists in the Netherlands, with a
national office and 120 local departments. Financed by the Ministry of Transport, Public Works and
Water Management, the Fietsersbond implements the Fietsbalans benchmarking project, aimed at
stimulating municipal bicycle policy. The Fietsbalans, which actually measures the cycling climate
in municipalities (the conditions for cyclists), was conducted in 125 municipalities during 2000-
2004. Each municipality surveyed received an extensive report providing a relative assessment
The Dutch approach in briefFacilities for all target groups Chapter 1 described how bicycle use in the Netherlands affects everyone and everything. In virtually all important travel motives, the bicycle plays a serious role. Travel motives are also good connection points for stimulating bicycle use: why do people choose the bicycle, and how can this be promo- ted? Various types of bicycle use provide pretexts for focused policy. In particular, there is considerable experience in bicycle policy which focuses on commuter travel, cycling to shops and shopping centres and school traffic. These travel objectives are indicated together as utilitarian traffic. Then there is also the travel motive where the travel objective is not the journey’s final objective: if the bicycle is used, for example, to get to the station. For these chain journeys, there are also plenty of opportunities for successful bicycle policy. And finally there is recreational cycling, where cycling itself is often the travel objective.
Example E            Houten and Veenendaal:                                                                                         3.1 Shopping by bicycle
                          bicycle traffic and flourishing
                          retail trade                                                                                                      Background
                                                                                                                                            Even in the Netherlands, there are some misconceptions: cyclists don’t contribute much to the till,
                          Most of the shops in Houten (around 43,000 inhabitants) are in the centre of this municipality                    so accessibility by car is very important for shopkeepers. However, this is not the case.
                          which is oriented towards cyclists. The residents appear to do virtually all their food shopping and              Cyclists spend less per visit, but they do come more often. Naturally this varies per city centre,
                          half of their non-food shopping in their own municipality. The turnover per square metre of shop-                 but both older research in Utrecht and newer studies in Breda (where on average a cyclist spends
                          floor space was considerably higher than the average in the Netherlands when measured some                        one and a half times as much as a motorist) and Groningen have demonstrated this. Groningen’s
                          years ago.                                                                                                        statistics speak for themselves. (Table 5)
                          Veenendaal (around 60,000 inhabitants) is a real bicycle city when it comes to its bicycle use and                Table 5 shows the profit that the Groningen city centre receives per individual mode of transport.
                          bicycle policy. A volume which led to it being rated ‘the best shopping town in the province of                   In total, considering all visitors and the complete turnover, the bicycle is of major economic interest
                          Utrecht’ in 2004 and an unprecedented purchasing power amongst its residents. A paradise for                      as well: 31% of visitors and 34% of the turnover. This obviously concerns mainly Groningen
                          retailers, it appears - and in Veenendaal this was matched by considerable attention to the bicycle               citizens: 46% of Groningen citizens cycle to the city centre, realising 56% of sales to citizens.
                          policy.                                                                                                           Visitors from the region and further afield in the Netherlands have a slight preference for public
                                                                                                                                            transport instead of their cars, but visitors who come by car spend far larger amounts.
                                                                                                                                            In addition there is an interesting paradox which appears to address commerce in particular:
                                                                                                                                            The more local shoppers who switch from the car to the bicycle, the less parking space is available
                                                                                                                                            for (the cars of) shoppers from further afield. It is precisely for this reason that the ‘Hoofdbedrijf-
                                                                                                                                            schap Detailhandel’ (trades council) suggested in 2004 that retailers might do well to take their
                                                                                                                                            own supplementary initiatives: ‘Consider creating bicycle sheds in private premises in a shopping
                                                                                                                                            centre or town centre.’ Because, this organisation of retailers also reasoned: more cyclists from the
38                                                                                                                                                                                                                                                                   39
                                                                                                                                            city itself means that more scarce parking spaces are freed up for the cars of regional visitors.

                                                                                                                                            Measures
                                                                                                                                            Suitable bicycle policies for city centres must therefore be focused in particular on encouraging
                                                                                                                                            local visitors to visit the centre by bicycle. This requires a broader approach than simply providing
                                                                                                                                            or improving bicycle facilities; it needs a more integrated vision. This also needs a concentrated
                                                                                                                                            parking policy (how much car capacity must be offered and how close to the centre?) and specific
                                                                                                                                            choices in traffic circulation.

                                                                                                                                            Bicycle parking facilities are very important as part of an integrated plan for a city centre. The con-
                                                                                                                                            sumer wants to be able to park his or her bicycle safely, and especially near the destination. In fact
                                                                                                                                            this appears to be an important consideration in the choice of transportation. In many municipa-
                                                                                                                                            lities, the capacity of bicycle parking areas is much too small for the peak periods. In recent years
                                                                                                                                            it has become clear that free and guarded parking on the periphery of a pedestrian zone tempts
                                                                                                                                            many cyclists to leave their bicycles there - rather further from their destination - so that there is
                                                                                                                                            less hindrance from bicycles parked at random around the shops.

                        Share in visitors                                       Share in turnovers
                        walking        bicycle   public transport     car       walking       bicycle     public transport       car
       local visitors     32%          46%            13%            9%          19%           56%              14%             25%
       regional           1%           22%            41%            36%          0%           21%              32%             40%
       visitors
       superregio-        5%            7%            48%            39%          4%            5%              39%             37%
       nal visitors
       total              20%          31%            27%            21%         11%           34%              25%             35%

       Table 5: 2004 survey amongst visitors in Groningen city centre; shares of the main modes of transport in the number of visitors
       and realised turnovers (in %)

                                                                                                                                                                                                                                        Facilities for all target groups
Example F Company bicycle: 3.2 Cycling to work
effective employer measure
Many employers have provided their workers with company bicycles in a ‘tax-friendly’ way. Background
A simple measure which even in the Netherlands - where bicycle ownership is already very high - Traffic problems occur primarily in the rush hours, when workers travel to or from work by car.
appears to have some effect. Employees appear to feel themselves morally stimulated to bicycle So it is particularly attractive to encourage cycling for commuter traffic. This certainly applies to
more when they have accepted a free bicycle from the boss. companies and establishments which have to cope with a dire shortage of parking spaces.
The bicycle currently remains popular in commuter traffic – the major increase in car use plays out
Use of bicycle by employees particularly over the longer distances. Most people believe half an hour’s travelling time to and
bicycle use before after difference from work is acceptable. Cyclists can certainly cover some 7.5 km in this time. This is an interesting
always 42,2 47,3 + 5,1 figure, because of all those working in the Netherlands, half live within 7.5 km from work. 45%
often 11,3 17,5 + 6,2 of them already opt for the bicycle – but more is certainly possible. Those who cycle to work no
regularly 18,3 24,2 + 5,9 longer actually need to go to the gym – even if you only live 15 minutes away from work. Some-
occasionally 13,2 7,5 - 5,7 one who is fairly unfit can improve their performance capacity by 10% if they cycle a distance of
never 15 3,5 - 11,5 three kilometres each way three times a week. This produces almost the same results as a training
programme.
Table 6: Use of bicycle by employees, before and after obtaining a bicycle from the business / employer (in%)
(source: Van de Ven & Partners / Nationale Fiets Projecten (National Bike Projects) 2002 )
Measures
A wide range of measures can be considered to encourage the use of bicycles successfully in
commuter traffic. The chance of success appears to increase if municipalities and commerce work
Trappers: Innovation in
together. Good bicycle routes and cycle paths - generally necessary to serve cyclists well - are and
Example G remain the most important factor. This is generally an issue for the authorities. But bicycle use can
40 41
mobility management
be further encouraged by companies themselves, for example if employers provide bicycles for
employees who live within cycling distance. Facilities for encouraging the bicycle in the commu-
ter traffic do not need to be extensive to achieve an effect. An evaluation of around a hundred
‘Trappers’ (pedals in English) is a system to get employees on their bicycles. A recording sensor at transportation plans from major companies showed that the introduction of fairly simple measures
the workplace records the bicycle whenever it is in the vicinity. encouraged an average 3% rise in bicycle use (Table 6). The measures included offering good bicy-
Every time the employee cycles to work, he gets a number of points. The employee can use these cle parking, a shower or a company bicycle, for example.
points to acquire products and outings in the ‘Trappershop’ on the Internet. This system is free of
charge for the employer. More cyclists in commuter traffic.
Until recently, a maximum cycling distance of 7.5 km was considered realistic. However, more and
more interlocal commuter routes are being designed with few obstacles and sometimes even real
bicycle motorways. In the framework of the Fileproof project, five such routes were constructed.
All over the country, there is interest in cycle routes for longer distances. As a result, distances
of up to 15 km are achievable, with cyclists able to reach speeds of 25-30 km/hour. This means
that cyclists are not much slower than other modes of transport and in congested areas they may
be much faster. There is therefore a huge opportunity here to use bicycles for better accessibility
and less congestion. Employers are also starting to promote bicycle use more, also with regard to
improving health. In accordance with the Environmental Management Act, businesses are obliged
to minimise emissions caused by transport to and from the company. This means that bicycle use
(0 emissions) must also be stimulated. In autumn 2008, the Mobility Management Task Force, in
which employers and government are working together to stimulate alternatives to car use, will
introduce employers’ measures to stimulate bicycle use, such as bicycle compensation and the
introduction of a mobility budget. The latter is an exceptionally powerful method for stimulating
bicycle use. The system, which is already in use at various companies, means that employees
receive a fixed budget for their commuter travel. From this amount they pay all the actual costs of
commuter travel, such as car costs, on-site parking costs, season tickets for public transport, etc.
Any money left over is income for the employee. Because the bicycle is by far the cheapest mode
of transport, employees who cycle to work will have a great financial advantage.
Facilities for all target groupsYou can also read