Dammed If You Do: How Sunk Costs Are Dragging Canadian Electricity Ratepayers Underwater - CD Howe Institute
←
→
Page content transcription
If your browser does not render page correctly, please read the page content below

In s t i t u t    C.D. HOWE                              In stitute

                              commentary
                                            NO. 528

        Dammed If You Do:
       How Sunk Costs Are
        Dragging Canadian
       Electricity Ratepayers
            Underwater

Canada has three mega-projects underway to generate hydroelectricity. But a comparison of their
costs relative to the alternatives raises the question of whether it’s time to pull the plug on them.

                      A.J. Goulding
        with research support from Jarome Leslie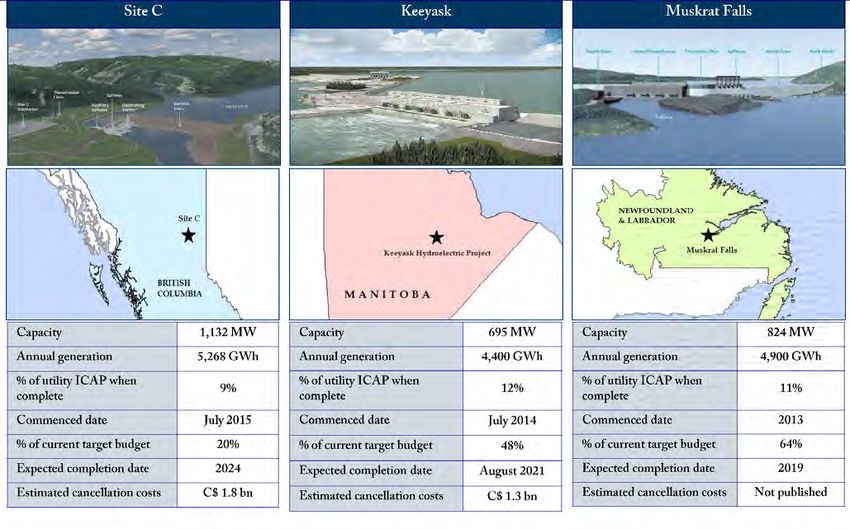
The C.D. Howe Institute’s Commitment
                              to Quality, Independence and
                              Nonpartisanship

A bout The                    The C.D. Howe Institute’s reputation for quality, integrity and
Author s                      nonpartisanship is its chief asset.

A.J. Goulding                 Its books, Commentaries and E-Briefs undergo a rigorous two-stage
is President of London        review by internal staff, and by outside academics and independent
Economics International       experts. The Institute publishes only studies that meet its standards for
LLC (“LEI”). He has           analytical soundness, factual accuracy and policy relevance. It subjects its
advised provincially owned    review and publication process to an annual audit by external experts.
hydro companies, IPP
associations, and consumer    As a registered Canadian charity, the C.D. Howe Institute accepts
groups on Canadian and        donations to further its mission from individuals, private and public
international electricity     organizations, and charitable foundations. It accepts no donation
market related issues.        that stipulates a predetermined result or otherwise inhibits the
                              independence of its staff and authors. The Institute requires that its
Jarome Leslie                 authors disclose any actual or potential conflicts of interest of which
is a Senior Consultant        they are aware. Institute staff members are subject to a strict conflict
with LEI.                     of interest policy.

                              C.D. Howe Institute staff and authors provide policy research and
                              commentary on a non-exclusive basis. No Institute publication or
                              statement will endorse any political party, elected official or candidate
                              for elected office. The views expressed are those of the author(s). The
                              Institute does not take corporate positions on policy matters.

Commentary No. 528
                                              D. HOWE
January 2019                                 .
                             C

Energy and Natural
                                                                                                                  IN
                                    T

Resources
                             INSTITU

                                                                                                                     S
                                                                                                                   T IT
                                                                                                                    uesUT E
                             E sse

                                                                                                                              Daniel Schwanen
                                                                                                                   iti q
                              n ti

                                                                                                                  pol
                                al

                                                                                                                              Vice President, Research
                                                                                                              les
                                  Po

$ 12.00                                 yI                                                                    s
                                     lic

                                                                                                        ur

                                             nt
                                                  elli                                                  les
                                                         ge n                                     sab
                                                                                         s pe n
isbn 978-1-987983-87-6                                          ce | C
                                                                       o n seils i n d i

issn 0824-8001 (print);
issn 1703-0765 (online)
The Study In Brief

The push towards renewable energy sources has prompted major investments in mega-projects to generate
hydroelectricity. However, government decisions to make such large investments in generating capacity
must be scrutinized for economic soundness – particularly relative to the costs of alternatives for producing
this power.
   Canada has several large hydroelectricity projects presently under construction including three that
are the subject of this paper: Site C on the Peace River in northern British Columbia, Keeyask on the
Nelson River in Manitoba, and Muskrat Falls on the Churchill River in Labrador. Each of these projects
represents a multi-billion dollar upfront investment by public entities in long-lived generation capacity.
   This study examines the cost-effectiveness of these hydro projects by comparing the costs of
equivalent generation from carbon cost adjusted combined cycle natural gas turbines (CCGT). The
analysis demonstrates that the levelized costs from the Site C and Keeyask projects may exceed the costs
of alternative CCGT generation. The study notes that risks of building large generation capacity in
anticipation of uncertain future demand for electricity and contends that, relative to large hydro projects,
the roll-out of CCGT generation can be more flexibly timed (and paired with environmental initiatives) to
meet demand as it materializes.
   Even building-in the likely costs of cancellation, the author concludes that present economics would
favour cancelling Site C and Keeyask and replacing the respective capacity with equivalent dispatchable
CCGT generation capacity. The study shows that replacing Site C or Keeyask with equivalent CCGT
capacity is cost effective even when applying a lower discount rate.
   While an emphasis on renewables generation has motivated these major hydroelectric projects, the
analysis shows that Site C exceeds the levelized cost of a CCGT alternative that faces a $50/tonne carbon
price. Moreover, drawing from results in recent renewable energy procurement, the study observes that
wind generation can provide a much lower levelized cost of zero-emission electricity than such large-scale
hydro projects.
   This study concludes by recommending that provinces re-examine the economics of these projects and
consider cancelling projects which have more cost effective alternatives. To avoid uneconomic projects
in the future, the report also recommends strengthening institutional independence – in particular, by
ensuring independent regulatory review for mega-projects and leveraging greater private-sector discipline
for the design and delivery of major electricity projects.

C.D. Howe Institute Commentary© is a periodic analysis of, and commentary on, current public policy issues. Michael Benedict
and James Fleming edited the manuscript; Yang Zhao prepared it for publication. As with all Institute publications, the
views expressed here are those of the authors and do not necessarily reflect the opinions of the Institute’s members or Board
of Directors. Quotation with appropriate credit is permissible.

To order this publication please contact: the C.D. Howe Institute, 67 Yonge St., Suite 300, Toronto, Ontario M5E 1J8. The
full text of this publication is also available on the Institute’s website at www.cdhowe.org.

2

Several large-scale Canadian hydro projects now under
construction face significant cost overruns and will potentially
be uneconomic for decades if completed.

While cancellation of one or more of these projects                  Se v er a l Potenti a lly
may be the best choice economically, political                       Uneconomic Projects a r e
calculations make termination difficult. To prevent                  Cur r ently under Construction
such mistakes in the future, provinces need to
strengthen independent, apolitical regulatory and                    Three large-scale Canadian power-sector projects
market institutions, adopt a more rigorous analytical                currently under construction stand out for their
process in evaluating such large-scale projects and                  potentially poor economic prospects. These include
expand the role of the private sector in risk-sharing,               the Site C project in British Columbia, the
project ownership and delivery. This Commentary                      Keeyask project in Manitoba, and Muskrat Falls
demonstrates that a combination of dispatchable                      in Newfoundland and Labrador. Others under
(on demand) and non-dispatchable energy sources                      construction or proposed projects may face financial
procured in smaller sizes closer to the period of                    challenges as well.
demonstrated need, would be more cost-effective.                     Site C: The Site C Clean Energy Project, owned
   We begin with an overview of the current                          and operated by BC Hydro, will include a dam and
status of three large hydro projects, then describe                  a 1,132 megawatt (MW) hydroelectric generating
how sunk costs need to be a major factor in                          station on the Peace River in the northeast of the
decisionmaking. This discussion is followed by an                    province.2 The project will join an existing river
examination of the project-completion levelized                      system consisting of the W.A.C. Bennett Dam
cost of energy (LCOE)1 vis-à-vis replacement                         and Peace Canyon Dam. Construction on Site C
with natural-gas fired resources. It also examines                   commenced in July 2015, with total expenditures
the case for project deferral due to delays in actual                amounting to $2.1 billion, approximately 25 percent
power needs. Finally, we address the common                          of the original budget as of December 2017.3
arguments of project proponents and make policy                      However, latest estimates place projected total costs
recommendations to prevent these costly mistakes.                    at $10.7 billion with an expected completion date of

    The authors would like to thank Grant Bishop, Marcel Boyer, Rick Jennings, Pierre-Olivier Pineau, Grant Sprague and
    anonymous reviewers for helpful comments on an earlier draft. The authors retain responsibility for any errors and the views
    expressed. Due to the time required for the C.D. Howe Institute’s rigorous peer review process, data in the paper are as of
    May 2018. For an updated version of the analysis using data as of October 2018, please see the accompanying addendum.
    The author regularly provides expert testimony in regulatory proceedings for electricity rates and policy advice on electricity
    market design in Canadian provinces, including having worked on behalf of Clean Energy BC and testified on behalf of
    small industrial electricity consumers in Manitoba. The author has not acted in any regulatory proceedings concerning
    approvals for the projects discussed in this paper.
1   The LCOE is an industry-accepted measure for detailed analysis and decisionmaking that represents price for plant output
    that, over the plant’s life, will be sufficient to provide owners with a return on their capital while covering all operating costs.
2   BC Hydro. Reply Submission 2017. Table B-3-2“Project Overview.” Site C. https://www.sitecproject.com/about-site-c/
    project-overview.
3   BC Hydro. Site C Clean Energy Project – Annual Progress Report No. 2. March 2018.
3 Commentary 528
Table 1: List of Acronyms
Acronym Definition Acronym Definition
AEO Annual Energy Outlook IPP Independent power producer
AESO Alberta Electric System Operator ISO Independent System Operator
BC British Columbia ISO-NE ISO New England
BC Hydro British Columbia Hydro and Power Authority ITMO Internationally transferred mitigation outcome
BCUC British Columbia Utilities Commission kW Kilowatts
CAD Canadian Dollar LCOE Levelized cost of energy
Cal-ISO California Independent System Operator LEI London Economics International
CCGT Combined cycle gas turbine MB Manitoba
CEC California Energy Commission MH Manitoba Hydro
CONE Cost of New Entry MPUB Manitoba Public Utilities Board
CPCN Certificate of Public Convenience and Necessity MISO Minnesota Independent System Operator
CPUC California Public Utilities Commission MW Megawatt
EIA Energy Information Administration MWh Megawatt hour
EIM Energy Imbalance Market NL Newfoundland and Labrador
EV Electric vehicle NL Hydro Newfoundland and Labrador Hydro
GWh Gigawatt hour O&M Operations & maintenance
HVDC High Voltage Direct Current OIC Order-in-Council
ICAP Installed capacity PPA Power Purchase Agreement
IESO Independent Electricity System Operator USD US Dollar
IRENA International Renewable Energy Agency WACC Weighted average cost of capital
2024 – up from $7.9 billion and 2020, respectively, Keeyask: The Keeyask Project, a 695-MW
as initially forecasted in 2010.4, 5,6 hydroelectric generating station, will be located
Meanwhile, BC Hydro forecasts a need for on the Nelson River, 725 kilometres north of
new capacity by 2023 in tandem with a need for Winnipeg. The project is being developed by the
new energy by 2028.7 Should the project be axed, Keeyask Hydropower Limited Partnership, led
the termination and site remediation costs are by Manitoba Hydro and four Manitoba First
estimated to be $1.8 billion.8 Nations.9 Since construction commenced in July
2014, expenditures have totaled $4.2 billion, nearly
4 Ibid.
5 BC Hydro. Site C Capital Cost Estimate. 2014.
6 “Province announces Site C Clean Energy Project.”
Site C.
7 BC Hydro. BC Hydro Reply Submission. 2017. (p. 15)
8 British Columbia Utilities Commission. British Columbia Utilities Commission Inquiry Respecting Site C: Executive Summary
of the Final Report to the Government of British Columbia. November 2017. (p. 3)
9 “Keeyask Generating Station.” Manitoba Hydro.4
Figure 1: Selected Large Hydro Projects
Sources: BC Hydro, Nalcor Energy and Manitoba Hydro.
half of the target budget as of December 2017.10,11 generation for domestic load before approximately
However, the latest projected total costs are some 2033.14 Based on a 2017 Manitoba Hydro analysis,
$8.7 billion, with a completion date of August 2021, estimated cancellation costs of Keeyask were
compared to $5.6 billion and 2019, respectively, as approximately $1.35 billion.15
forecasted in 2011).12,13 Muskrat Falls: Nalcor Energy’s Muskrat Falls
Recent load forecasts indicate no need for new
10 Keeyask Hydropower Limited Partnership. Construction Begins on Keeyask Generating Station. July 2014.
11 Manitoba Hydro. Manitoba Hydro 2017/18 & 2018/19 General Rate Application: GSS-GSM/MH I-3a-c. September 2017. (p. 5)
12 Keeyask Hydropower Limited Partnership. Control Budget for Keeyask Generating Station Revised 2017. March 2017.
13 Keeyask Hydropower Limited Partnership. $5.6 Billion Keeyask Generating Station Announced. June 2011.
14 Keeyask Hydropower Limited Partnership. Control Budget for Keeyask Generating Station Revised 2017.
15 Cancellation costs include Manitoba Hydro costs associated with managing the ramifications resulting from cancelling the
project such as demobilization and salvage, short-term employee contract buyouts, breakage fees from various contracts,
site and environmental remediation, long term environmental monitoring, interest and escalation. See Manitoba Hydro.
Manitoba Hydro 2017/18 & 2018/19 General Rate Application: GSS/GSM/MH I-4. September 2017(p. 6).5 Commentary 528 Project, located in Labrador’s interior, will include monumental cost overruns, the Newfoundland and an 824-MW hydroelectric generating facility, Labrador government commissioned an inquiry approximately 1,600 kilometres of transmission in November 2017 but did not explicitly state lines across the province and an additional cancellation costs as an item to be considered in transmission line connecting Newfoundland and their Terms of Reference. At time of writing this Labrador.16 While construction on the project Commentary, the inquiry was set to be completed began in 2013, it was 88 percent complete as of on or before December 31, 2019.23 For our part, November 2017, at which point total expenditures we have calculated cancellation costs for Muskrat amounted to $8.1 billion or approximately at $1.47 billion, based on the estimated average 64 percent of the target budget.17 Following cancellation cost per kW of Site C and Keeyask. numerous budget revisions, the latest projected (Details of these calculations are provided in online total cost is $12.7 billion, with the project expected Appendix 3.) to generate first power by 2019, compared to $6.2 billion and 2017, respectively, as predicted in Sound decisionm a k ing depends 2012.18,19,20 on a proper under sta nding of Newfoundland and Labrador Hydro load sunk costs. projections have deteriorated substantially since the project was approved in 2012. In that year, To determine whether to proceed with each of the load expectations in 2020 were in excess of seven aforementioned projects, the going-forward costs terawatt hours (TWh) but, as of May 2016, that need to be compared on a levelized basis against level is not expected until 2036.21 alternatives.24 Such an analysis, properly performed, To date, termination costs have not been requires ignoring expenditures to date, or sunk quantified. According to Nalcor CEO Stan costs, that are irreversible. Policymakers often justify Marshall, “the costs were so high, and the proceeding with uneconomic projects due to the consequences so painful, that such an undertaking significant amount of money that has already been wasn’t even worth” his time.22 Concerned about the spent. However, the decision whether to proceed 16 “Project Overview.” Nalcor Energy. 17 Nalcor Energy. Muskrat Falls Project Update. November 2017. January 16, 2018. (p. 4, 11) 18 For fuller discussion, see Nalcor Energy. Muskrat Falls Project Update. June 2017. (p. 11); “Muskrat Falls Generating Project,” Nalcor Energy. https://muskratfalls.nalcorenergy.com/project-overview/muskrat-falls-hydroelectric-generation- facility/; and “Lower Churchill Project to Become a Reality” Government of Newfoundland and Labrador. http://www. releases.gov.nl.ca/releases/2010/exec/1118n06.htm. 19 “Muskrat Falls Generating Project.” Nalcor Energy. . 20 “Lower Churchill Project to Become a Reality.” Government of Newfoundland and Labrador. 21 Nalcor Energy. Muskrat Falls Project Update. July 24, 2016. 22 “NDP calls for study into cost of halting work on Muskrat Falls powerhouse.” Nalcor Energy. 2016. http://www.cbc.ca/ news/canada/newfoundland-labrador/muskrat-falls-ndp-1.3659518. 23 Newfoundland and Labrador Regulation 101/17. Commission of Inquiry Respecting the Muskrat Falls Project Order. November 20, 2017. 24 While this Commentary focuses on comparing completion costs with the costs of gas turbines, imports and renewables with storage, the analysis should also take a broad view of variables, including demand response, energy efficiency and distributed energy resources, using an integrated resource-planning process. In the case of BC imports, while these may violate the “self-sufficiency” requirement of the province’s Clean Energy Act, this self-imposed restriction could be amended.
6

  Box 1: Exploring the Concept of Sunk Costs

  A simple example, Investment A, may be helpful. Suppose someone has invested $100 and their cost of
  funds is 5 percent. Now, assume that they have been told that they can either abandon the investment
  and receive nothing, or they can invest an additional $100 and receive $2 per year in income in
  perpetuity. Clearly, to recover at least the cost of the incremental funds, the follow-on investment
  would need to yield $5 per year; the investor should decline to make any further investments in the
  venture and take the loss.
                                                                  Investment Investment
                                                                      A          B
                                Initial investment                    $100          $100

                                New investment                        $100          $100

                                Return                                  $2            $8

                                Write down                              $0          $100

                                New investment return                   2%            8%

                                Initial investment return               0%            0%

  Let us extend the example further with Investment B. Suppose simultaneously the investor was offered
  a different opportunity – to invest $100 in a new venture that would yield $8 per year in perpetuity.
  While this second investment is evidently higher yielding than continuing in the first, and should be
  the obvious choice, many investors might wrongly choose Investment A and shun Investment B to
  avoid admitting the loss. Yet by choosing Investment B, they would have an extra
  $6 in perpetuity to spend.

with a project should be determined by the yet-                  perceive project terminations as an admission of
to-be-spent costs, instead of costs already spent.25             failure. Alongside the funds spent, politicians invest
Factoring sunk costs into decisionmaking results in              their reputation and electability. BC Premier John
a phenomenon known as the “sunk-cost fallacy.”                   Horgan has justified completing Site C by saying,
   Politics make the decision to cancel (or defer)               “We will not ask British Columbians to take on $4
a project even more difficult as some politicians                billion in debt with nothing in return for the people

25 Regulators in similar circumstances have allowed amortization of cancellation costs to avoid rate shock, and regulators
   who do not currently allow such practices should adjust them accordingly. The benefits of the cancellation accrue to future
   ratepayers in the same way that the costs would have, had it been built. Immediate expensing of cancellation costs leads to
   intergenerational equity issues. For example, the Public Utilities Board of Manitoba approved the recovery of $380 million
   of sunk costs related to the cancelled Conawapa Generating Station in a regulatory deferral account with amortization of
   the costs on a straight-line basis over a 30-year-period beginning on April 1, 2018. See Public Utilities Board of Manitoba.
   Order No. 59-18. May 1, 2018. p.22.
7 Commentary 528
of this province.”26 However, careful economic
Table 2: Go-forward Costs for Each Project and
analysis suggests that BC ratepayers may, in fact,
Date of Assessment
end up paying more by the project continuing than
they would if they simply paid off the debt already Values in C$ billion Site C Keeyask
Muskrat
incurred and pursued an alternative path. As we Falls
will see, continuing with construction on some of Current budget 10.7 8.7 12.7
Canada’s large-scale hydro projects may result in a Current expenditures 2.1 4.2 8.2
similar loss of welfare for the ratepayers who will
Go forward costs 8.6 4.5 4.5
ultimately pay the bill.
Date of assessment 31-Dec-17 31-Dec-17 28-Feb-18
Le v elized Costs for the
Subject Projects a r e Dr i v en by Sources: BC Hydro. Site C Clean Energy Project – Annual
Progress Report No. 2. March 2018; Manitoba Hydro.
Substa nti a l C a pita l costs Undertaking #57. February 2018; Nalcor Energy. Muskrat Falls
Project, Monthly Report – February 2018. April 20, 2018. p. 8.
To determine whether the decision to continue
construction is rational, we first calculated the
LCOE for each of the three plants examined will make it more difficult to cancel the projects,
here based solely on so-called “go-forward” costs. the costs remaining are based on the most recent
We then compared these go-forward LCOEs to data available.27 Assumed go-forward costs appear
alternative approaches to meeting current needs, in Table 2. We include the costs of transmission
factoring in the cost of negative externalities. In because of the location-constrained nature of these
addition to the go-forward costs, key assumptions specific hydroelectric resources.
for calculating the LCOE include the amortization Amortization: A key component of the LCOE is
period, the cost of capital, fixed and variable the length of the period over which capital costs
operating and maintenance costs, and expected are recovered. We have used a 60-year amortization
annual production. While point estimates are period, which is consistent with the longest power
provided below, they are tested against a range of purchase agreement (PPA) offered to hydroelectric
possible outcomes in a subsequent section. independent power producers (IPP) in Canada.28
Go-forward capital costs: These costs (Figure 1) While hydro assets are long lived, components
are based on recent announcements regarding require periodic maintenance and replacement, and
amounts remaining to be spent on each of the experience suggests that parts of civil works may need
projects, although it is likely that pressure for to be replaced as well after several decades of use.
ongoing expenditure to create “facts on the ground”
26 “Government will complete Site C construction, will not burden taxpayers or BC Hydro customers with previous
government’s debt”. BC Gov News. December 11, 2017.
27 This Commentary is based on the most recent data available at the time of drafting (May 2018). Due to the nature of this
analysis, the economics of these projects improves as more capital is sunk. However, if we assume significant additional
expenditure at Site C, our calculations suggest it would still be unfavourable. As noted previously, analysis using more recent
data appears in the addendum.
28 BC Hydro issued a 61-year PPA to Capstone Infrastructure Corporation for its 16-MW Sechelt hydro project. See BC
Hydro. Independent Power Producers (IPPs) currently supplying power to BC Hydro. November 2012. In Ontario, PPAs
for hydroelectric power were signed for up to 50 years under its Hydroelectric Energy Supply Agreement procurement
program. See IESO. Progress report on contracted supply. June 2015.8
Cost of capital: A fundamental principle of Fixed and variable O&M costs: We used the US
corporate finance is that the cost of capital should Energy Information Administration’s (EIA) 2018
reflect the risks of the project itself, rather than the Annual Energy Outlook (AEO) estimates for
generalized cost of funds available to the investor. fixed and variable operation and maintenance
Given that a substantial portion of the output of (O&M) costs of a new 500-MW hydropower
these three projects is earmarked for export markets project with a 2021 in-service year and located in
with the risk of volatile prices, the cost of capital, the US northwest. This resulted in $50.70/kW/year
in theory, could be as high as that for a merchant in fixed costs and $1.68/kWh in variable O&M
generator; i.e., one which has limited access to costs.32 These estimates are consistent with ranges
long-term PPAs as hedges. This position is partially provided by the World Bank’s International Finance
offset by access to a domestic retail hedge provided Corporation, which include the major equipment
by provincial load. Taking both these factors into replacement that would be required during the
account, we have assumed that the projects are lifespan of hydropower facilities.33
financed using 70 percent debt at 4.08 percent29 and Output: Assumptions for the output of each plant
30 percent equity at 7.58 percent. The cost of debt are shown in Figure 1.
was based on the yield of 30-year Canadian A-rated
Results: Using the assumptions above, we developed
corporate bonds, while the cost of equity was
a levelized cost for each of the plants, based solely on
calculated using the capital asset pricing model and
their go-forward costs. The outcome is as follows and
based on Canadian power sector comparators.30 We
is presented in more detail in online Appendix 2:
assume a tax rate of 0 percent, given that BC Hydro,
Manitoba Hydro and Nalcor Energy are exempted
from paying federal and provincial taxes.31 The cost Site C: $100.41/MWh;
of capital was calculated as 5.13 percent. Details Keeyask: $64.89/MWh; and
of the methodology are described in online Muskrat Falls: $59.25/MWh.
Appendix 1.
29 It is not appropriate to use the cost of public debt as the basis for calculating the appropriate discount rate. The province
is effectively investing on the behalf of taxpayers in an enterprise that is more risky than the province’s sovereign debt.
Assuming 100-percent debt financing at the province’s cost of funds would suggest that investing in a large-scale hydro
project was no more risky than investing in sovereign debt, which is clearly not the case. For example, the Trans Mountain
Pipeline project did not become less risky after it was acquired by the federal government, suggesting that assigning a lower
cost of capital due to public ownership would be inappropriate in valuing it.
30 For the cost of debt, we took the average coupon rate of 30-year, A-rated corporate debt bonds issued by Canadian
companies since January 1, 2017.
31 In lieu of federal and provincial income tax exemptions, the three Crown corporations make payments to provincial
governments in the form of water rentals, capital taxes, debt-guarantee fees and other taxes or grants. In 2019, BC Hydro,
Manitoba Hydro and Nalcor Energy are forecasted to make provincial payments of $433 million, $589 million and $8.2
million respectively. These amounts represent 12.2 percent, 19.3 percent and 0.3 percent of projected gross revenues. See
Manitoba Hydro. PUB-MFR-44. February 1, 2018. p.3; BC Hydro. Fiscal 2017 to Fiscal 2019 – Revenue Requirements
Applications. August 17, 2016. p.80 & 182; Newfoundland and Labrador Hydro. 2017 General Rate Application. July 28,
2017. p.206.
32 AEO cost estimates were converted to Canadian dollars at a rate of 0.79 USD = 1.00 CAD.
33 World Bank Group – International Finance Corporation. Hydroelectric Power – A Guide for Developers and Investors.
February 2015.9 Commentary 528
These projects a r e uneconomic kilometres of natural gas pipelines are located
by se v er a l metr ics within 25 kilometres of transmission lines in BC
and Manitoba.)
Replacement natural gas f ired capacity is cheaper
Heat rate: We assumed a heat rate (the amount of
To explore whether the decision to continue fuel burned per unit of output) of 6,300 Btu/kWh,
construction on the three projects is in the public consistent with the performance of the reference
interest, we considered the costs of alternatives. CCGT plant in a recent study by PJM, a regional
First, we considered the levelized cost of building transmission body for 13 US states, and the US
a combined cycle gas turbine (“CCGT”) in EIA 2018 Annual Energy Outlook.35,36
each province.34 In addition to the above key Amortization: We used a 20-year capital recovery
assumption categories, we also incorporated the period for CCGTs. This is consistent with the
cancellation costs of the current hydro projects, as capacity market assumptions of PJM and ISO New
well as natural gas plant costs and carbon costs. For England, another regional transmission network.
comparison, we also delayed the in-service date Furthermore, this time-frame is also consistent
of the replacement capacity to be consistent with with North American experience regarding the
identified needs, discounted to the present using the average CCGT retirement age, which is 21 years.
previously established cost of capital. While our shorter assumed lifespan suggests
Capital costs: We based capital costs on estimates earlier replacement than for a hydro station, we
from the US National Renewable Energy do not believe that the levelized replacement cost
Laboratory’s 2017 Annual Technology Baseline at that time would be significantly higher than
and the Alberta Electric System Operator’s 2017 that assumed for the first 20 years, given that
Proposed Gross Cost of New Entry & Net Cost technological improvements and existing site
of New Entry Calculation Approach report. benefits can be expected to offset some of the
These sources provide a range of overnight capital impact of inflation.
cost estimates from $1,270/kW to $1,950/kW. Cost of capital: We utilized the same capital
While this range may be reasonably applied to structure and cost of capital for the CCGTs as
BC and Manitoba, the development of natural for the hydro projects.37 The projects would face
gas infrastructure in Newfoundland and Labrador the same counterparty risks, and while natural gas
would be required in addition to the cost of a new plants face commodity price risk, this risk is more
CCGT. It is not necessary to include transmission hedgeable than hydrology.
costs since a new gas-fired resource can be situated
close to existing infrastructure. (A high-level Fixed and variable O&M: For fixed and
geographical analysis suggests that at least 1,000 variable O&M, we used the average of recent
34 While some have argued that it is impossible to site a CCGT in some of the provinces, we believe that a project undertaken
with appropriate consultation and unequivocal government backing would be feasible within the required time frame.
35 PJM. Cost of New Entry – Combustion Turbines and Combined-Cycle Plants with June 1, 2022 Online Date. April 19, 2018
36 EIA. Annual Energy Outlook. 2018.
37 The idea that “private” discount rates should not be used to evaluate “public” assets built for the public gives rise to a number
of poor public policy choices. Discount rates are neither public nor private; they are intended to reflect the underlying
risks of the project. Hydrology risk doesn’t disappear because the project is public, nor do cost overruns or market risks.
Governments are investing ratepayers’ and taxpayers’ money, and if higher-yielding investments exist elsewhere, both groups
will be better off if the government eschews lower-yielding options.10
determinations by various Independent System
Operators (“ISOs”) associated with the Cost of Table 3: Replacement Capacity Required for
New Entry (“CONE”). This resulted in estimates Gas Alternative if Matching Energy Output
of $31.3/kW/year in fixed costs and $5.3/MWh in Site C Keeyask
Muskrat
variable O&M costs. Falls
Hydro capacity [MW] 1,132 695 824
Output: For each province, we assumed that the
CCGT was sized to match the output of the Hydro capacity factor 53% 72% 68%
planned new hydro facility.38 Because the CCGT Annual generation
5,268 4,400 4,900
has a higher capacity factor – assumed to be [GWh]
85 percent in these calculations – than the hydro Gas capacity factor 85% 85% 85%
it replaces, the size of the facility in each province Implied gas capacity
707 591 658
would differ. (See Table 3.)39 Both hydroelectric required [MW]
and gas-fired resources provide option value. Sources: Authors’ calculations.
Spinning gas reserves are arguably nearly as nimble
as reservoir hydro in responding to changes in
demand, whereas non-spinning resources will lag LCOE for capacity matching.
by the start-up time required. Overall, the marginal Cancellation costs: To assess the costs of replacing
difference in option value is likely to be small. existing hydro projects with CCGTs, we also need
We also examine like-for-like capacity to include the cancellation costs of the existing
replacement if an equally sized CCGT were projects in the calculation. To do so, we took the
procured while maintaining the same expected level most recent estimated cancellation costs and
of output. This scenario overstates the levelized levelized them over the lifetime of the cancelled
cost of CCGTs when matched for hydro capacity, plant, using the allowed returns incorporated
as a CCGT could run at a higher capacity factor into existing rate structures.40 Matching the
than that indicated if it simply matched the energy amortization period of cancellation costs with
output of the hydro plant it replaces. Assuming the would-be lifetime of the asset maintains
a higher capacity factor would lower the overall intergenerational equity. The levelized cancellation
38 It is inappropriate to match the plants on an installed-capacity basis. The hydro facilities do not have excess capacity. The
ability to dispatch at full capacity will be dependent upon the condition of their reservoirs, which will differ annually and
seasonally. For the hydro comparators to receive full capacity credit, they will need to be able to deliver their full capacity
at any time on short notice. In Alberta, the Alberta Electric System Operator (AESO) assumes dispatchable hydro has an
unforced capacity capability of 81 percent of its installed capacity. This is also consistent with the approach taken by North
American capacity markets that derate hydroelectric resources.
39 Incremental capacity can be procured more cheaply, and is of greater value closer to the location of need. In the case of BC,
Site C’s capacity could be replaced at much lower cost.
40 Site C and Muskrat Falls cancellation costs were amortized using an approved return on rate base of 3.47 percent and
6.82 percent, respectively. Keeyask’s cancellation costs were discounted using the capital cost of 5.13 percent. See BC Hydro.
Fiscal 2017 to Fiscal 2019 – Revenue Requirements Applications. August 17, 2016. p.576; Newfoundland & Labrador
Board of Commissioners of Public Utilities. Order No. P.U. 49. Use of different discount rates for the regulatory asset
created relative to that used for the cancelled project is appropriate because the nature of the cash flows is different. While
using the weighted average cost of capital (WACC) as the basis for determining the termination costs would increase the
Site C recovered amount by $4.99/MWh, we do not believe that such an analysis is appropriate, given the different nature
of the cash flows. Furthermore, doing so would not change the fundamental conclusions.11 Commentary 528
costs of Site C, Keeyask and Muskrat Falls were
Table 4: Carbon Price Adder
calculated as $14.06/MWh, $16.56/MWh and
$20.65/MWh, respectively. The calculations BC MB NL
performed are provided in online Appendix 3. This
levelized cost is added to the cost of the CCGT. Level of administration Provincial Provincial Federal
Natural gas prices: To explore the impact of natural Carbon price [$/tonne] 50 25 40
gas prices on the LCOE, we started by taking CO2 content of natural gas
120 120 120
Henry Hub gas price projections from the EIA’s [lbs/MMBtu]
2018 AEO Reference Case41 and examining the CCGT heat rate [Btu/kWh] 6,300 6,300 6,300
price over the 2018-2037, 20-year amortization
Carbon price adder [$/MWh] 17.15 8.58 13.72
period. Then, using the same 5.13 percent discount
rate as for the CCGT itself, we determined the Source: EIA; Author analysis.
levelized natural gas price to be $4.97/MMBtu
over the 20-year period. Next, we determined
the three-year historical monthly locational price we used the 2021 carbon tax price of $50/tonne.43
differentials between Henry Hub and Kingsgate In Manitoba, we applied a carbon tax of $25/tonne,
for BC, Emerson for Manitoba and Iroquois which is assumed to be flat until 2022.44 Pending
Waddington for Newfoundland and Labrador. the announcement of a plan from Newfoundland
Kingsgate and Emerson traded at average discounts and Labrador, the province is assumed to follow the
of $0.51 and $0.11 respectively, while Iroquois federal carbon pricing backstop and is assigned the
Waddington traded at a premium of $0.72. These 2021 cost of $40/tonne.45 Given the carbon content
differentials were applied to the levelized gas of natural gas of 120 lbs/MMBtu and the thermal
price and are provided in greater detail in online efficiency of new CCGTs at 6,300 Btu/kWh, the
Appendix 4. In BC, an adder of $0.38 was included overall carbon price additions were $17.15/MWh
to account for the motor fuel tax. We assume that in BC, $8.58/MWh in Manitoba and $13.72/
CCGT facilities connect directly to existing gas MWh in Newfoundland and Labrador.46,47 In the
transmission networks. deferral case, we used a carbon tax of $50/tonne for
all three projects, the high-end of the federal carbon
Carbon costs: Carbon costs were added to the pricing backstop. This corresponds to a carbon price
variable operating costs of the CCGT coming add-on of $17.15/MWh.
online in 2021, using the announced policies of the
various provinces as described Table 4.42 In BC,
41 The AEO presents prices at Henry Hub, Louisiana, which is the location generally used as the starting point for gas
projections given its liquidity. Canadian gas has generally traded at a discount to Henry Hub in the recent past and is
expected to do so in the future.
42 2021 in-service year takes into account three years of construction lead time. See EIA. Annual Energy Outlook. 2018.
43 “British Columbia’s Carbon Tax.” Government of British Columbia. .
44 Government of Manitoba. Made-In Manitoba Climate and Green Plan. March 2018.
45 Environment and Climate Change Canada. Technical Paper on the Federal Carbon Price Backstop. May 18, 2017.
46 “How much carbon dioxide is produced when different fuels are burned?” EIA.
47 PJM. Cost of New Entry – Combustion Turbines and Combined-Cycle Plants with June 1, 2022 Online Date. April 19,
2018.12
Results: Using the assumptions above, we developed With respect to the need for Site C, the demand
a levelized cost for each of the CCGT replacement forecast in the BC Hydro Submission on the
plants: British Columbia Utilities Commission Preliminary
• British Columbia: $87.60/MWh;48 Report already assumes load from LNG Canada,
• Manitoba: $81.65/MWh; and Woodfibre LNG and FortisBC Tilbury Phase 2
• Newfoundland: $96.09/MWh. materializes.
As discussed below, while we believe replacement Results: Taking the projected need dates into
with a CCGT could be delayed in BC, even if account, we determined the discounted LCOE of a
immediate construction were chosen, Site C should replacement CCGT for comparison purposes. We
still be cancelled. did this by projecting the LCOE of the replacement
CCGT for the year of projected need, assuming
construction commences three years in advance
Del ays in need a llow costs to
and then discounted that number to the present,
be defer r ed
using the CCGT discount rate. The outcomes for
Further analysis of CCGT deferral shows that the energy replacement and capacity replacement
Keeyask should be cancelled as well. The economics scenarios are in Table 5.
of cancellation are further enhanced when taking As Figure 3 below shows, when replacement of
into account the ability to build replacements cancelled capacity is deferred, ratepayers receive
only as needed in sizes more consistent with need. greater benefit from cancelling both Site C and
In BC, Site C is not needed for domestic load Keeyask, in both the energy and capacity-matched
until three years after current target completion, scenarios We emphasize again that the capacity-
according to BC Hydro’s low-load growth scenario. matched scenario overstates the LCOE, as lower
In Manitoba, Keeyask is not needed for 13 years capacity factors are assumed to match the expected
after current target completion. Muskrat Falls,
49
output from the hydro projects.50,51
however, may be too far advanced to cancel based It is important to emphasize the value of
on relative economics. optionality, which comes with the ability to build
Figure 2 shows the projected need dates and in smaller unit sizes. The North American power
demand forecasts related to the three hydro projects. sector is changing rapidly: demand is slowing or
48 Site C’s completion could be justifiable under a carbon price of more than $100/tonne. However, higher carbon prices also
make any of the more granular zero-emission resources a more economic choice.
49 In the September 2016 Boston Consulting Group review of Bipole III, Keeyask and Tie-Line, Manitoba Hydro stated the
earliest consistent need for new generation would be 2027 and noted the need may not arise until as late as 2034. See The
Boston Consulting Group. Review of Bipole III, Keeyask, and Tie-Line Projects, p. 4. September 19, 2016.
50 While we believe the use of a lower WACC is inappropriate, WACC sensitivities do not dramatically change the
conclusions. Using a WACC of 4.13 percent and holding other input assumptions constant, Site C is still uneconomic.
While its LCOE falls from $100.41/MWh to $86.29/MWh, the LCOE of its cancellation and deferred energy
replacement is $81.40/MWh. However, in this scenario Keeyask is economic as its LCOE falls from $64.89/MWh to
$56.02/MWh, as compared to the LCOE of its cancellation and energy replacement of $60.13/MWh.
51 To examine like-for-like capacity replacement, procuring an equally sized CCGT in lieu of hydro at the same capacity
factors still shows ratepayers receive greater benefit from cancelling both Site C and Keeyask. Specifically, deferred
replacement results showed: Site C replacement LCOE of $92.98/MWh, below its completion LCOE of $100.41/MWh,
and Keeyask replacement LCOE of $62.60/MWh, below its completion LCOE of $64.89/MWh. An even more cost-
effective approach to match both capacity and energy would be to build a mix of CCGT and open-cycle gas turbines.13 Commentary 528
Figure 2: Projected Need Dates and Demand Forecasts
Sources: BC Hydro. BC Hydro Reply Submission. 2017; Manitoba Hydro. PUB/GSS-GSM-KAP-7; MPUB. NFAT. June 2014; MPUB.
Order No. 73/15; Boston Consulting Group. Review of Bipole III, Keeyask and Tie-Line Projects; Nalcor Energy. Muskrat Falls Project
Update. June 24, 2016.
Table 5: Deferred Energy and Capacity Replacement LCOEs
Energy Replacement Capacity Replacement
Province
LCOE [C$/MWh] Capacity factor LCOE [C$/MWh] Capacity factor
British Columbia 81.40 85% 92.98 53%
Manitoba 60.13 85% 62.60 72%
Newfoundland &
92.80 85% 97.60 68%
Labrador
Source: Authors’ calculations.14
Figure 3: Comparison of Hydro and Deferred CCGT LCOE
$/MWh
120 100.41
100 92.98 92.80 97.60
81.40 14.06 64.89 20.65
80 59.25 20.65
14.06 60.13 62.60
60 16.56
16.56
40 67.33 78.92 72.15 76.95
20 43.57 46.03
0
Completion
Completion
Completion
capacity replacement
capacity replacement
capacity replacement
energy replacement
energy replacement
energy replacement
Cancellation and
Cancellation and
Cancellation and
Cancellation and
Cancellation and
Cancellation and
Site C Keeyask Muskrat Falls
Hydro LCOE CCGT LCOE Levelized cancellation costs
Source: Authors’ calculations.
negative, behind the meter production and storage Ex a mination of sensiti v ities
is gradually becoming more economic. At the r einforces the conclusions
same time, decentralized power grids are becoming
more feasible. Large-scale, centralized, long lead- While it is important to recognize that each of
time investments like hydro stations run the risk the variables has a range of plausible outcomes, we
of becoming stranded assets (assets which are no believe that the best way to explore this span is to
longer able to recover their costs) before they are assess how the variables interact with one another.
even brought online, depending on the pace of To assess the sensitivity of assumptions to changes
technological change. Having the option to build in combinations of key variables, we examined
something smaller and later means that provincial the outcomes using Monte Carlo analysis, a
utilities can better tailor future investments to mathematical technique that generates random
updated power sector dynamics, while being able variables on the basis of a probability distribution
to take advantage of intervening technological to be used for modelling risk or uncertainty. Within
changes. Furthermore, the ability to spread these determined input ranges, 1,000 trials were drawn
investments across the grid may enhance reliability following a normal distribution. For each trial, we
and resiliency. compared the LCOEs of completing the hydro
project to the LCOEs of deferred gas replacement
combined with the levelized cost of cancellation.15 Commentary 528
Figure 4: Power Sector Trends Making Central Stations Less Valuable
Note: Payroll taxes are not presented since their profiles are similar to workers’ social contributions. The profiles for other taxes are identical
between male and females aged 18 and over.
Source: Authors’ calculations, using Statistics Canada’s SPSD/M and data sources in Figure 2.
For all three projects, input ranges were determined three hydro projects. We tested bounds of
for the weighted average capital cost (WACC), +10 percent and – 5 percent for each project,
levelized gas price, carbon cost and remaining resulting in a $8.1 billion to $ 9.4 billion range
for Site C, $4.3 billion to $5.0 billion for Keeyask
completion costs. The input ranges for each variable
and $4.2 billion to $4.9 billion for Muskrat Falls.
are as follows:
As seen in Figure 5, cancellation and deferred gas
• WACC: We tested values ranging from
4.13 percent to 6.13 percent within 100 basis replacement was cheaper in 96 percent of Monte
points of the calculated WACC of 5.13 percent. Carlo trials conducted for Site C, 61 percent of
LCOE comparisons in each trial apply the same trials conducted for Keeyask and 0 percent of trials
WACC to both alternatives (project completion conducted for Muskrat Falls.
versus project replacement).
• Natural gas prices: In terms of the levelized Pr ices in ex port m a r k ets a r e
gas price, we tested values ranging from $3.85/
ex pected to be depr essed
MMBtu to $7.70/MMBtu based on the high
and low-case EIA forecast from its 2018 AEO. Cross-border electricity flows between Canada and
• Carbon costs: For carbon costs, we tested values the US are almost as old as the North American
ranging from $20 per tonne to $100 per tonne to electricity grid, with the opening of the first
include ranges from provincial and federal carbon transmission line between the two countries in
pricing plans, and a significant margin.
1909.52 These flows are taken for granted to such
• Completion costs: We examined the impact of an extent that they are used to justify investment
variation in the completion capital costs for the
52 “History of electricity.” Canada Electricity Association. https://electricity.ca/learn/history-of-electricity/.16
Figure 5: Results of Monte Carlo Analysis of Sensitivities
C$/MWh
40
Keey
e ask
Keeyask
30 replacement cheaper e
in 61% of trials
20
Muskrat Falls
10 vs. alternative
max
0 Muskrat Falls
replacement cheaper 3rd quartile
-10 in no trials
Site C vs. median
-20 alternative Keeyask vs. 1st quartile
-30 alternative
Site C replacement min
cheaper in 96%
-40 of trials
-50
-60
Source: Authors’ calculations.
decisions in new hydroelectric facilities in Canada. to increase dramatically over the forecast horizon
However, North American power markets are – and of significant state (and expiring Federal)
evolving rapidly: load growth has fallen, cheap initiatives to encourage development of domestic
natural gas has reduced wholesale power prices large-scale renewable-energy assets.
substantially and targeted local renewables As Figure 6 shows, combined energy and
incentives have increased US power supplies. capacity prices54 in the target regions are expected
As a result, US export markets are likely to be to be below the levelized cost to complete Site
significantly less lucrative in the future.53 This is C. While prices in export markets are expected
a function both of the depressed price of natural to increase over the forecast period, they are not
gas – which, as discussed above, is not expected expected to reach historic levels. Essentially, this
53 Declining export profits are evident today. BC Hydro’s $643 million in 2016 gross electricity export revenues was its lowest
in over a decade with an average price of $43.65/MWh. This contrasts with $2.29 billion in 2009 at an average price of
$70.45/MWh. Manitoba Hydro earned $460 million in gross electricity export revenues in 2017, 61 percent of the $750
million earned in 2005.
54 Capacity prices are converted to $/MWh by dividing them by the total number of hours in a year. This process is necessary
to allow for calculation of capacity revenues to resources that are assumed to be derated.17 Commentary 528
Figure 6: Project LCOE and Export Market Combined Energy and Capacity Price Forecast
Comparison
C$/MWh C$/MWh C$/MWh
140 140 140
120 120 120
100 100 100
80 80 80
60 60 60
40 40 40
20 20 20
0 0 0
2018
2020
2022
2024
2026
2028
2030
2032
2034
2036
2018
2020
2022
2024
2026
2028
2030
2032
2034
2036
2018
2020
2022
2024
2026
2028
2030
2032
2034
2036
CAISO MISO ISO-NE
Site C LCOE Keeyask LCOE Muskrat Falls LCOE
Market revenue + Market revenue + Market revenue +
cancellation cost cancellation cost cancellation cost
Note: Market forecasts account for expected coal and natural gas retirements in their respective markets.
Source: LEI Continuous Modelling Initiative 2017 Q2 reports.
means that when exporting electricity, Canadian market price were sufficient transmission available,
ratepayers will be subsidizing US consumption, would make it cheaper (even accounting for
rather than profiting from it.55 transmission costs) for Canadian utilities to cancel
Furthermore, Figure 5 assumes that new the specified projects and import from the US.
Canadian hydro facilities are granted full For example, adding Site C’s cancellation cost of
production-weighted capacity credit. But capacity $14.06/MWh to the levelized price of energy and
is generally based on deliverability. Transmission capacity from the California Independent System
deliverability needs to be available for the full Operator (CAISO) is cheaper than the LCOE of
amount of claimed capacity, performance penalties finishing Site C until 2037. Importing allows for an
may apply and capacity credits may be derated.56 even more granular approach to addressing future
Indeed, in the cases of Site C and Keeyask, needs and, given the much larger market areas to
adding the levelized cancellation costs to the export which the provinces are linked, it offers a wide
55 This is already happening in Ontario, which has provided more than $57.5 million in benefits to US ratepayers since 2010
as a result of surplus baseload generation. See IESO. Hourly intertie schedule and flow data. 2010-2017; IESO. Hourly
Ontario Energy Price data. 2010-2017.
56 While export contracts are in place to cover a portion of the output of the new projects, it is important to note that these
contracts cover only a portion of the new projects’ useful lives and could be profitably unwound by meeting the obligations
with cheaper qualifying local replacement power.18
Figure 7: Timeline of Energy Storage Procurements in California
Source: CEC. Tracking Progress – Energy storage. November 2017.
diversity (including zero-emission sources) Western Energy Imbalance Market helped avoid
of supply. curtailment of renewables, by 586,277 MWh as
of the first quarter of 2018.57,58 Second, as Figure
C a lifor ni a won’t sav e us 7 shows, California is aggressively contracting
for in-state storage resources to balance existing
In the case of Site C, some have argued that the and new renewables. Third, continued growth in
unique characteristics of the California electricity behind-the-meter renewable energy resources and
market will help to justify its construction. In fact, substantial energy-efficiency efforts have resulted
the opposite may be true. Those unique aspects in reduced load growth. Recent California Energy
make it less likely that California will need energy Commission projections for peak demand are
or capacity from Site C. First, California policies increasing only 0.9 percent per year.59 Furthermore,
targeting increased renewables have resulted in an a review of relevant California dockets shows no
oversupply of power over many hours of the day. meaningful reference to Site C. Taken together,
Indeed, California’s motivation for launching the these factors suggest that the California market may
Western Energy Imbalance Market is to export, not not be nearly as robust an export destination as BC
to import. In a presentation before the California planners would wish it to be.
Energy Commission, CAISO noted that the
57 CAISO. IEPR Workshop – Renewable Integration. May 12, 2017.
58 CAISO. Western EIM Benefits Report – First Quarter 2018. April 20, 2018.
59 California Energy Commission. The California Energy Demand 2018-2030 Revised Forecast. January 22, 2018.19 Commentary 528
Figure 8: Levelized Cost of Wind Compared to Gas Turbines and Hydro
$/mwh
120
100
80
60
100.41
40 75.44
73.54
65.08 64.89 59.25
20 37.00
0
Wind REP* CCGT CCGT CCGT Site C Keeyask Muskrat Falls
(AB) (BC) (MB) (NL) completion completion completion
* Renewable Energy Program.
Source: Authors’ calculations.
Ther e a r e che a per ways to meet large-scale hydro is not the only way to obtain zero
emissions goa ls emissions power. Falling costs of large-scale wind
power, coupled with more efficient wind-power
Comparison of large Canadian hydro completion storage, are both potentially more cost effective and,
costs to the CCGT alternatives has been criticized like CCGTs, can be deferred until need is apparent
on the basis that, while CCGTs would pay carbon and sized accordingly. In fact, the first round of the
costs, they would nonetheless have actual emissions Alberta government’s Renewable Energy Program
that would make it more difficult for Canada to procured approximately 600 MW of wind power
meet its Paris climate agreement commitments. under 20-year contracts at $37/MWh, well below the
While there are other ways to accomplish this cost to complete any of the hydro stations examined,
objective when building CCGTs (for example, even when considering the need to balance the
committing to a verified offset program),60 building associated intermittency.61 Deferring investment
60 Article 6 of the Paris Agreement permits applying internationally transferred mitigation outcomes toward nationally
determined contributions. These outcomes are voluntary and are to be authorized by the participating parties. See
UNFCCC. Paris Agreement. November 2015.
61 Contract recipients receive an indexed renewable energy credit that represents the difference between the clearing price of
$37/MWh and the AESO market pool price. As such, contract recipients receive true-up payments from the government
when pool prices are low and pay the surplus when pool prices are high. See “Renewable Electricity Program.” AESO. <
https://www.aeso.ca/market/renewable-electricity-program/>20
also allows for technological improvements and this provision, Site C was exempted from BCUC
cost reductions. In its 2017 report, the International scrutiny under the province’s Clean Energy Act.64
Renewable Energy Agency predicted that the Energy Minister Bill Bennett justified this decision
installed costs of battery storage systems could fall stating: “The reason why we didn’t send it to the
by 50 percent to 66 percent by 2030.62 As such, the BCUC is back when the Clean Energy Act was
combination of wind and storage may be cheaper by passed (2010), there was a decision made that if
the time it is actually needed. government was to build Site C, it would be a
monumental decision in terms of energy policy that
Limiting the role of independent only duly elected officials have a right to make, as
regulators results in false opposed to an organization like the BCUC that is
expediency made up of bureaucrats and lawyers.”65
But monumental projects are precisely those
In each of the three provinces, limited regulatory that require additional scrutiny. Instead, Site C
authority undermined reviews of their respective was subject to a compressed nine-month long
megaprojects. Large hydroelectric generation environmental assessment conducted by a large
investments on the scale of Site C, Keeyask and team reporting to a three-person Joint Review
Muskrat Falls, which amount to multi-billion dollar Panel. This panel recommended that the project
undertakings, must be vetted with corresponding be referred to the BCUC, but this did not occur.66
due diligence. BCUC’s involvement came after the decision to
go ahead was made. Construction began in 2015,
Site C: British Columbia Utilities Commission whereas the BCUC review report was released in
November 2017.
In British Columbia, the Utilities Commission
Act (“UCA”) gives the BC Utilities Commission
(BCUC) powers to regulate public utilities. Muskrat Falls: Newfoundland and Labrador
Under Section 45 of the UCA, in most instances, Board of Commissioners of Public Utilities
construction of new electricity generating Under Newfoundland and Labrador’s Public Utilities
facilities cannot begin without the Commission Act, RSNL-1990: “A public utility shall not
issuing a Certificate of Public Convenience and proceed with the construction, purchase or lease of
Necessity, which is granted if the proposed facility improvements or additions to its property where (a)
is “necessary for the public convenience and the cost of the construction or purchase is in excess
properly conserves the public interest.”63 Despite of $50,000; or (b) the cost of the lease is in excess
62 IRENA. Electricity storage and renewables: Costs and markets to 2030. October 2017.
63 British Columbia Utilities Commission. Inquiry Respecting Site C – Final Report to the Government of British Columbia.
November 1, 2017. (p. 12)
64 Legislature of British Columbia. Clean Energy Act – Chapter 22. Section 7, Subsection 1 (Exempt projects, programs, contracts
and expenditures).
65 “Site C Dam will not be diverted to B.C. Utilities Commission” Alaska Highway News. 2015. Bennet maligns the
capabilities and purpose of an independent regulator; massive public investment undertakings putting ratepayer money at
risk need to be scrutinized outside of the political sphere by experts who can opine on need and alternatives in a fact-based
process.
66 University of British Columbia. Regulatory Process for the Site C Project. May 2016.You can also read