David Moser Institute for Renewable Energy Bolzano - Reliable and bankable solar PV: the assessment of the economic impact of failures in the field
←
→
Page content transcription
If your browser does not render page correctly, please read the page content below

Reliable and bankable solar PV: the
assessment of the economic impact of
failures in the field
David Moser
Institute for Renewable Energy
Bolzano
Italy
The Quest for Quality: towards reliable
and bankable solar PV

 2
Literature on quality

 3

Quantifying «quality»
 Derisking Impact of reliability on LCOE

 LCOE Euro/kWh
Drivers for cost-effective increase of performance and reliability:
- Digitalisation
- Common nomenclature
- Risk framework and guidelines
- A value-chain approach
 Impact of weighted average cost of capital, capital expenditure, and other parameters on future utility‐scale PV levelised cost of electricity, Eero Vartiainen, Gaëtan Masson, Christian Breyer, David Moser, Eduardo
 Román Medina, PIP 2019 https://doi.org/10.1002/pip.3189 4
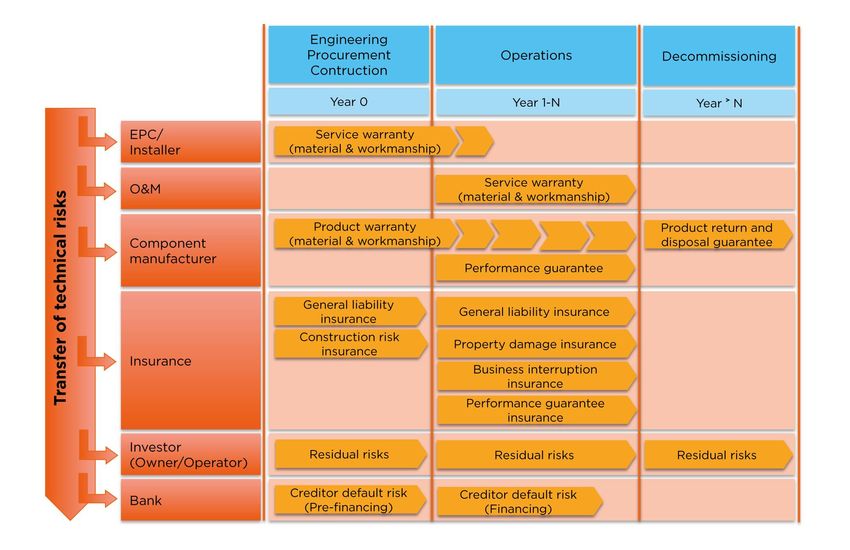
Risk ownership
Dealing with quality
 is complex

 Transfer of information / breaking SILOS

 5
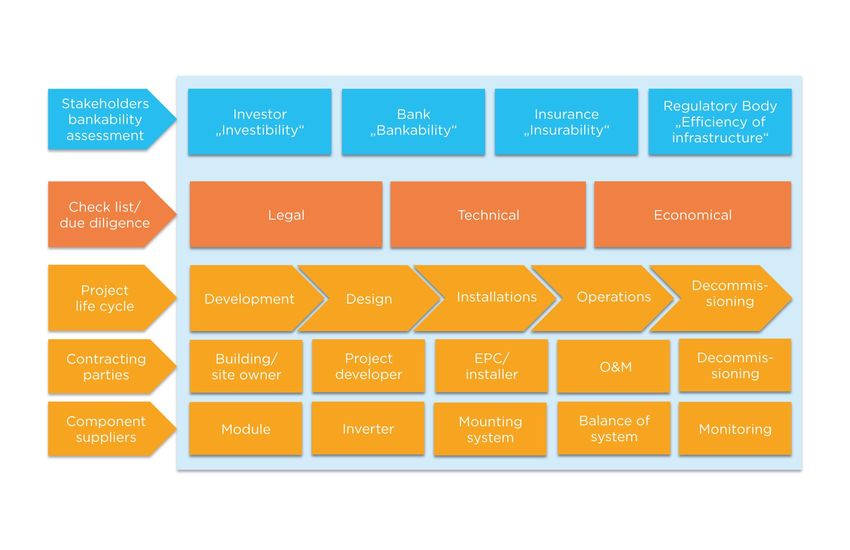
Stakeholders’ needs

short defect warranty periods, minimum of additional guarantees and warranties, high sale price with low
OPEX (short time horizon)

manage all the conflicting requirements for a long period of time. The best condition for O&M operators is
in fact in the presence of long defect warranty period and low sale price to allow for higher OPEX.

 ?

limit their liability to failures PV plants, which meet technical market standards and are maintained on a
regular basis

long defect warranty periods, performance guarantees, reasonable low CAPEX and OPEX, high long-term
plant performance and lifetime (ideally above the initial prediction).

projects with a 10-15 year financing period and PV plant performance which can also be slightly below
prediction.

 6
Bankability in PV projects

 Great definition!!

 And in practice?

 7
Bankability must be data-driven Data availability
Large datasets are available:
- Procurement / Testing
- Monitoring
- Field inspection
- Ticketing O&M
- Insurance claims
- Third party inspections

HOWEVER

These datasets are rarely:
- Organised
- Interoperable and digitalised
- Rely on interlinked digital platforms

 D. Moser et al, Identification of technical risks in the photovoltaic value chain and quantification of the economic impact, Progress in Photovoltaics, 7, 2017 8
Technical risks framework: towards a
standardised approach to quality

 9
Classification of technical risks

Impact
- on uncertainty (exceedance Probability) in Yield Assessments
- on CAPEX (mitigation measures)
- on Operational cost (CPN and other metrics, mitigation measures)
 10
Uncertainties in Yield Typical uncertainties in YA
 Assessments and PV LCOE
 https://iea-pvps.org/key-
 topics/uncertainties-
 yield-assessments/

 Uncertainty Range
Solar resource Climate variability ±4% - ±7%
 Irradiation quantification ±2% - ±5%
 Conversion to POA ±2% - ±5%
PV modeling Temperature model 1°C - 2°C
 PV array model ±1% - ±3% Best practice
 PV inverter model ±0.2% - ±0.5%
Other Soiling ±5% - ±6%
 Mismatch
 Degradation
 Cabling
 Availability…

Overall uncertainty on estimated yield ±5% - ±10%

 Typical uncertainty values (irradiance, temperature, soiling, shading, etc): ±5-10% [1]
 [1] D. Moser et al., “Technical Risks in PV Projects.” Solar Bankability Deliverable www.solarbankability.com 11
Yield and Exceedance Probability

 - Utilisation rate @P90 positively affected
 by reduction in uncertainty
 - P50 values will highly depend on the
 P50 choice of the insolation database
 P90 - Wrong assumptions can lead to
 under/overestimation of yield by >20%
 - Are YA reliable?

 Link with business models and LCOE
 calculation

 Typical uncertainty values on YA (irradiance, temperature, soiling, shading, etc): ±5-10%
N. Reich, J. Zenke, B. Muller, K. Kiefer, and B. Farnung, “On-site performance verification to reduce yield prediction uncertainties,” in Photovoltaic Specialist Conference (PVSC), 2015 IEEE 42nd, 2015, pp. 1–6.
M. Richter, T. Schmidt, J. Kalisch, A. Woyte, K. de Brabandere, and Lorenz, E, “Uncertainties in PV Modelling and Monitoring,” 31st European Photovoltaic Solar Energy Conference and Exhibition, pp. 1683–1691,
Nov. 2015.
D. Moser et al., “Technical Risks in PV Projects.” Solar Bankability Deliverable www.solarbankability.com
D Moser, M Del Buono, U Jahn, M Herz, M Richter, K De Brabandere, Identification of technical risks in the photovoltaic value chain and quantification of the economic impact, Progress in Photovoltaics: Research
and Applications 25 (7), 592-604, 2017

 12
Site Selection

 Parameter Assumption
 Location Given Latitude/Longitude, tilt angle and azimuth
 Irradiance and transposition Each independent YA used their favourite database
 Temperature Each independent YA used their favourite database
Location: Alice Springs, Australia Technology and mismatch PV module technology given (module datasheet). Mismatch and power tolerance,
 each YA applied their own consideration. Flash list with measure power was
Data available since 2009 provided

Technology: 3 crystalline technologies Inverter Given (datasheet)
 Shading Photos provided of near objects
 Soiling Each independent YA applied their own considerations
 Wind speed Each independent YA used their favourite database
 Long term insolation effects Each independent YA used their own considerations
 Degradation Each independent YA applied their own considerations
 Snow loss / snow fall Each independent YA applied their own considerations
 Availability Each independent YA applied their own considerations
 Uncertainties Please provide uncertainties for each parameter (when possible) and for the
 yield (mandatory).

 13
Comparison of initial YAs

 4%

 Problems along the modelling steps

Large spread of values
Real values within the P10-P90 range only for some YAs
Averaging YAs might not be a good strategy!
 14
Comparison of LTYPs

It appears that the annual performance
loss rate in Arid desert hot (BWh Köppen-
Geiger climate zone) is much higher than
expected, with all three systems discussed
seeing a PLR of -1.1 %/year or worse,
instead of the (historical) industry-standard
assumption of -0.5 %/year.

The significant over-performance by System
C compared to predicted values suggests
that thermal losses were over-estimated
(for example by using not validated
temperature coefficients and/or Nominal
Module Operating Temperature, NMOT),
and likely also suggests better light capture
by these modules.

 15
Risk matrix: taxonomy
 The importance of using common dictionaries

 Product Development Assessment of PV Plants
 Product Transportation
 Planning / installation
 O&M Decommissioning
 testing
 Modules …. …. …. …. ….

 • Insulation
 Inverter
 test • Soiling …. • …. ….
 Module mishandling • Hotspot …. • ….
 Undefined product
 • Incorrect cell • Shadow diagram (glass breakage) • Delamination recycling procedure
 Mounting structure• Modules….
 soldering mismatch • …. ….
 Module mishandling • ….
 Glass breakage ….
 • Undersized bypass • Modules not certified (cell breakage) • Soiling
 diodeConnection & • Flash report
 …. not • …. ….
 Module mishandling • Shading …. ….
 • Junction box
 distribution boxes available or incorrect (defective backsheet) • Snail tracks
 adhesion • Special climatic • Incorrect connection • Cell cracks
 • Delamination
 Cabling at the ….not
 conditions ….
 of modules …. • PID …. ….
 edges considered (salt • Bad wiring without • Failure bypass diode
 • Arcing ….ammonia, …. …. …. box ….
 Potential
 module
 spots on equalization
 the
 grounding, LPS
 • Visually detectable
 ...)
 &
 corrosion,

 • Incorrect assumptions
 List of failures
 fasteners
 •
 and junction
 Corrosion in the
 junction box
 Weather station,
 hot spots of module…. …. …. • ….
 Theft of modules ….
 • Incorrect
 communication,
 power rating degradation, light • Module degradation
 (flash test issue)
 monitoring induced degradation • Slow reaction time for
 • Uncertified unclear warranty claims, vague
 Infrastructure
 components or ….
 & • Module quality unclear …. …. ….
 or inappropriate ….
 environmental
 production line influence
 (lamination, soldering) definition of procedure
 • Simulation parameters for warranty claims
 Storage system ….
 (low irradiance, …. …. • ….
 Spare modules no ….
 temperature….) longer available, costly
 Miscellaneous unclear, ….
 missing PAN …. …. ….
 string reconfiguration ….
 files

www.solarbankability.org 16
Risk matrix: taxonomy
 The importance of using common dictionaries

 • An O&M ticket is characterised by 9 fields
 • Each failure in the field must have information for ”Component”, ”Subcomponent” and the
 name of the issue itself → failure_id
 • The optional field can give information of interest, for e.g. the root cause, the accountability,
 etc.
 • The used nomenclature must be standardised via ”dictionaries”

 MANDATORY OPTIONAL

failure_id Component Subcomponent failure Description Cause Origin Accountability Detection
grid.02 Grid Entire grid Limitation of deliverable power Operation Warning O&M platform
inv.11 Inverter Entire inverter Overheated inverter Ventilation issues Operation Warning inverter
mod.01 Module Backsheet Chalking Operation Insurance Visual inspection
mount.12 Mounting Structure Tracking system Tracking failure Storm Operation

 306 failures listed

 www.trust-pv.eu 17
Economic impact of failures
 CPN: metric that allows for
 New metrics

 Cost-based Failure Modes - Comparison between asset within the same
 and Effects Analysis PV plant portfolio (AM, O&M)
 (FMEA) for PV - Evaluate best strategies in EPC, O&M
 - Act as a link between the various phases of
 the value chain
a) Economic impact due to downtime and/or power loss (kWh
 to Euros)
- Failures might cause downtime or % in power loss
- Time is from failure to repair/substitution and should include: Income / savings reduction
 time to detection, response time, repair/substitution time
- Failures at component level might affect other components
 (e.g. module failure might bring down the whole string)

b) Economic impact due to repair/substitution costs (Euros)
- Cost of detection (field inspection, indoor measurements,
 etc) O&M cost increase
- Cost of transportation of component Reserves decrease
- Cost of labour (linked to downtime)
- Cost of repair/substitution

 18
CPN Results - Components and Market Segments
• PV modules - Utility scale

• Highest risk consists of a group of installation failures (mishandling, connection
 failures, missing fixation, etc. )
• Variety of failures detected by different techniques (VI, IR, EL, IV-Curves)

 19 19
CPN Results - Components and Market Segments
• Inverters

 20 20
Economic impact of failures
 Treaceability

 Digitalisation becomes a necessity
OPTIMIZATION OF THE COST PRIORITY NUMBER (CPN) METHODOLOGY TO THE NEEDS OF A LARGE O&M OPERATOR, G. Oviedo Hernandez et al, EUPVSEC 2019,
 21
Process digitalisation
 Full integration of monitoring platforms and ticketing systems

 - Creation of standardised metadata (PV passport)
 - Development of an automated and therefore time-efficient
 solution for extracting key parameters from maintenance tickets
 to gain statistical insights from a large number of PV plants.
 - Development of a software tool for field technicians that would
 allow the precise and error-free recording of standardised
 parameters for the calculation of the O&M contractors KPIs
 necessary for an efficient implementation of the methodology
 - The O&M field practices must definitely move away from a
 manual input of tickets in text format and adopt a more
 standardised approach when human intervention is limited

OPTIMIZATION OF THE COST PRIORITY NUMBER (CPN) METHODOLOGY TO THE NEEDS OF A LARGE O&M OPERATOR, G. Oviedo Hernandez et al, EUPVSEC 2019,
 22
A value-chain approach
 Breaking silos
 Virtual construction of a
 facility prior to its actual
 physical construction
 (reduce uncertainty, improve safety, Conceptual
 Detailed design
 design
work out problems, and simulate and
 analyze potential impacts)

 Bridge the information loss
 Decision associated with handling a
 project from design team, to
 Support construction team and to asset
 Modification Construction
 owner/operator
 System BIModel

 Dynamic information about
 the asset Operation
 (Configuration changes, sensor &
 measurements, control signals) Maintenance

 23
When we have data….

 24
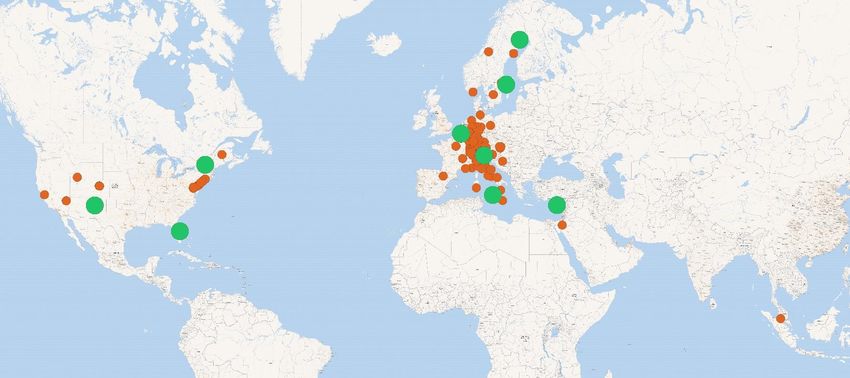
Benchmarking in IEA-PVPS Task 13

 14 PV systems: high
 quality data
 130 PV systems: low
 quality data

 25
Benchmarking in IEA-PVPS Task 13
 Performance Loss Rate

 Technology Climate

 Temperate Continental
Performance Loss Rates of PV systems of Task 13 database, Sascha Lindig, David Moser, Alan Curran and Roger French, IEEE PVSC Chicago 2019 26
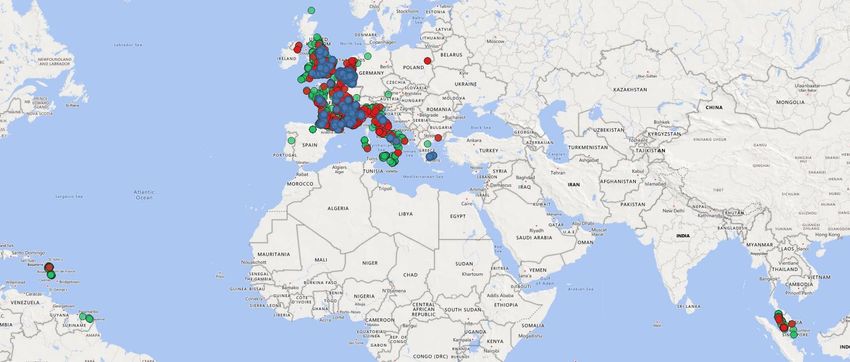
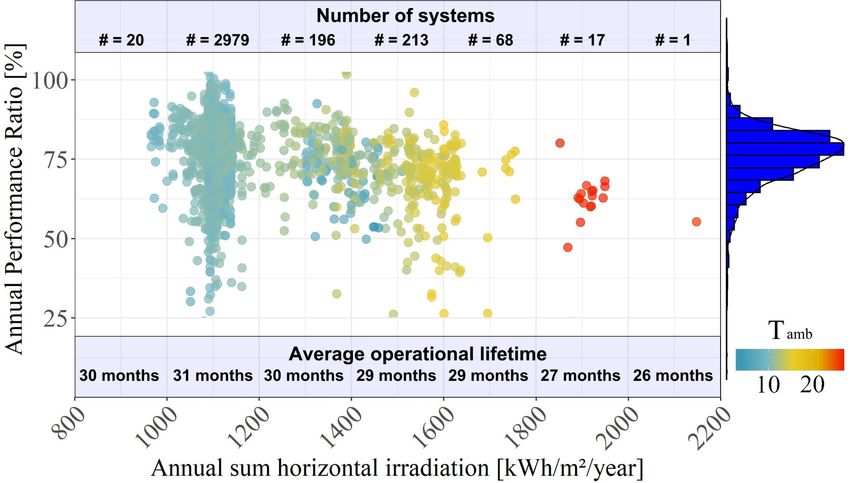
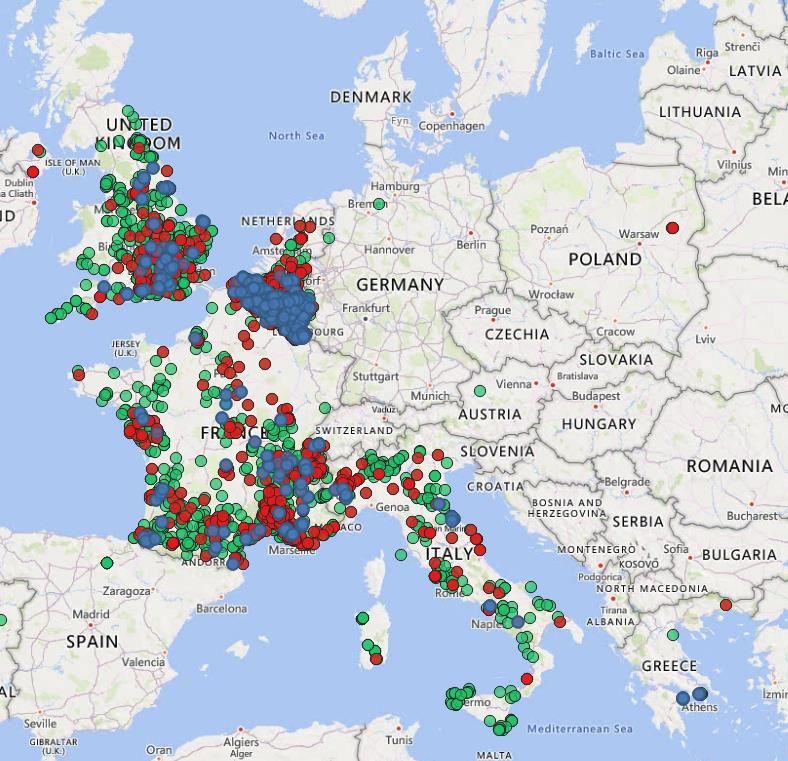
Benchmarking in PEARL-PV
https://www.pearlpv-cost.eu/

 Performance analysis and degradation of a large fleet of PV systems, S. Lindig et al, IEEE Journal of Photovoltaics, accepted, 2021 27
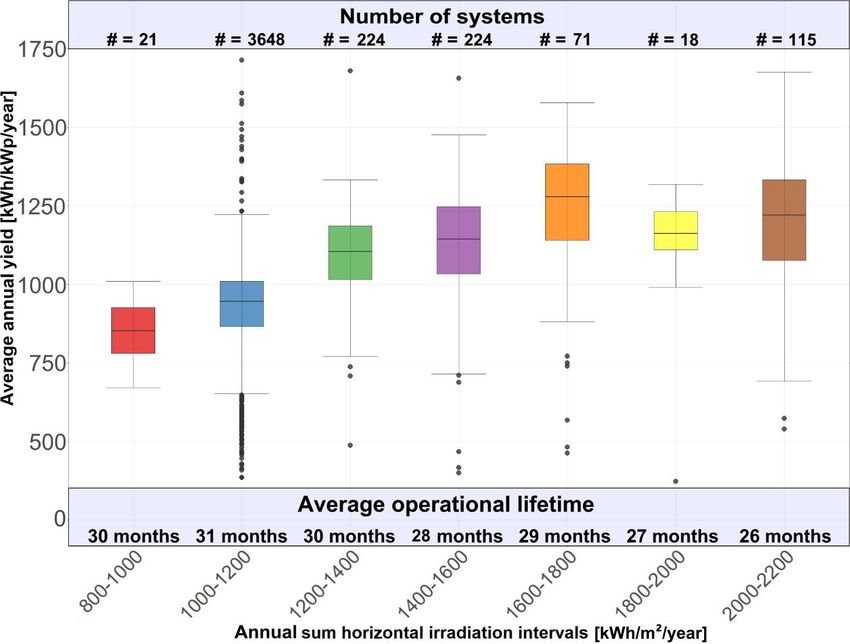
Energy Yield

 = . per year

 ෫ = . per year

 ഥ = . °

 ഥ = . °

 ഥ = . °

Performance analysis and degradation of a large fleet of PV systems, S. Lindig et al, IEEE Journal of Photovoltaics, accepted, 2021 28
Performance Ratio

 = . %

 ෪ = . %

Performance analysis and degradation of a large fleet of PV systems, S. Lindig et al, IEEE Journal of Photovoltaics, accepted, 2021 29
Performance Loss Rates

 Jordan1 Kiefer2
 -0.8 to -0.9 %/a -0.7 %/a
 ෫
 -0.5 to -0.6 %/a

[1] D. C. Jordan, et al, "Compendium of photovoltaic degradation rates," Progress in Photovoltaics Research and Application, vol. 24, no. 7, pp. 978-980, 2016.
 30
[2] K. Kiefer, et al, "Degradation in PV Power Plants: Theory and Practice," in 36th EU PVSEC, Marseille, 2019.
PV Component-Benchmarking

 Big data techniques applied on one of the largest PV portfolio (+16GW) including metadata, operational data
 and ticketing data to evaluate the performance and reliability of PV components

• Identify main performance and degradation losses factors

• Modelling Climate Stressors and Reliability Indicators (time-to-fail,
 lifetime,…)
 Extending the datasets to Until now, data mainly on
• Improve manufacturing processes, system designs, and O&M activities Desert Climates would Temperate Climates
 enable…
• Establish the needs of new labels
 Based on operational
 data
 KG Climate Zone Steppe
 • A (Tropical)
 • B (Arid)
 • C (Temperate)
 • D (Continental)
 PV systems in desert
 • E (Polar) areas present the
 Desert highest climate stresses
 reflected in lower PR
 (and higher PLRs)

 www.trust-pv.eu 31
Conclusions

- The PV sector must establish approaches to ensure and measure quality of components, systems and projects
- Each PV project must ensure the presence of a reliability plan which is constantly updated and passed along the
 value chain
- New metrics must be introduced to quantify the impact of decisions taken over the lifetime of a PV project
- Silos culture between stakeholders must change. Decision taken during a phase have an impact on the next
 phases
- Information must be carried along the value chain
- Standardisation of data format and collected data (metadata / PV plant passport, product data, monitoring data,
 ticketing, etc)
- Digital platforms must be interoperable

 Bankability must be based on hard facts / data
 Solar Bankability is an approach that heavily relies on data / quantification of quality
 Projects in underrepresented climates are particularly affected by lack of data
 Digitalisation is the driver that can finally ensure cost-effective increase of quality and reliability

 32
Thank you for your attention

www.eurac.edu/
David.moser@eurac.edu

 33
Risk
Year-0
 Phase/field
 Procurement/
 product selection
 Identified critical technical gaps
 1. Insufficient EPC technical specifications to ensure that selected components
 are suitable for use in the specific PV plant environment of application.
 Gap analysis
 and testing 2. Inadequate component testing to check for product manufacturing Impact on
 deviations.
 3. Absence of adequate independent product delivery acceptance test and quality of
 criteria.
 Planning/ 4. The effect of long-term trends in the solar resource is not fully accounted
 installation
 lifetime energy for.
 yield estimation 5. Exceedance probabilities (e.g. P90) are often calculated for risk assessment
 assuming a normal distribution for all elements contributing to the overall
 uncertainty. Impact on cash
 6. Incorrect degradation rate and behavior over time assumed in the yield
 estimation. flow model
 7. Incorrect availability assumption to calculate the initial yield for project
 investment financial model (vs O&M plant availability guarantee).
 Transportation 8. Absence of standardized transportation and handling protocol.
 Installation/ 9. Inadequate quality procedures in component un-packaging and handling
 construction during construction by workers. Impact on quality
 10. Missing intermediate construction monitoring.
 Installation/ 11. Inadequate protocol or equipment for plant acceptance visual inspection.
 of installation
 provisional and 12. Missing short-term performance (e.g. PR) check at provisional acceptance
 final acceptance test, including proper correction for temperature and other losses.
 13. Missing final performance check and guaranteed performance.
 14. Incorrect or missing specification for collecting data for PR or availability
 Impact on risk/cost
 evaluations: incorrect measurement sensor specification, incorrect
 irradiance threshold to define time window of PV operation for
 ownership
 PR/availability calculation.
Risks Operation 15. Selected monitoring system is not capable of advanced fault detection and
during identification.
operation 16. Inadequate or absence of devices for visual inspection to catch invisible Impact on risk/cost
 defects/faults.
 17. Missing guaranteed key performance indicators (PR, availability or energy ownership and on
 yield).
 18. Incorrect or missing specification for collecting data for PR or availability O&M stratgy
 evaluations: incorrect measurement sensor specification, incorrect
 irradiance threshold to define time window of PV operation for
 PR/availability calculation.
 Maintenance 19. Missing or inadequate maintenance of the monitoring system.
 20. Module cleaning missing or frequency too low.

 34
Process digitalisation
 Workflow
 App
 Measured PV 3D Vis
Measured Digital
 plant electrical
meteo-data Twin
 parameters
 Maintenance
 Monitoring System
 Ticket

 Priority +
 Fault
O&M KPIs Ticketing System Decision Support
 Detection

 Cost of repair/sub
 Energy Loss CPN
 Cost of downtime

 Cost parameters PV system asset
 (FIT, PPA, labor, data and
 components) metadata
 35
Process digitalisation

Component geolocalised
History / logging at component level
Integration in digital platforms
Common nomenclature: statistics
Suggestions on actions
H&S / skills management
 36
You can also read