DC Resists Economic Woes - Spring 2020 - MULTIFAMILY REPORT - Yardi Matrix
←
→
Page content transcription
If your browser does not render page correctly, please read the page content below

MULTIFAMILY REPORT

DC Resists
Economic
Woes
Spring 2020

Rent Growth Shrinks Considerably

Sturdy Economy Favors Quicker Recovery

Development, Transactions Expected to Slow

WASHINGTON, D.C. MULTIFAMILY
                                                                               Recent Washington, D.C.
                                                                               Transactions
                                                                               The Cosmopolitan at Reston
                                                                               Town Center

DC Stumbles,
But Does Not Fall
While the COVID-19 pandemic and ensuing downturn are sure to
take their toll on the rental sector, metro D.C. multifamily entered           City: Reston, Va.
the storm relatively well prepared thanks to a sturdy economy                  Buyer: Cherner Development
                                                                               Purchase Price: $120 MM
and an employment composition that favors quicker recoveries
                                                                               Price per Unit: $416,667
compared to other large U.S. markets. That said, the metro’s av-
erage rent contracted by 70 basis points month-over-month and
10 basis points on a trailing three-month basis as of April, as the            Inigo’s Crossing
first effects of the health crisis began to emerge.

The District’s unemployment rate jumped to 6.0% as of March
and more than 1.3 million unemployment claims had been filed
across D.C., Virginia and Maryland through mid-May, but the
area’s economy carries a key silver lining for the long run. Although
coastal gateway metros were the first to feel the swift shock of
the pandemic, D.C.’s economy is relatively sturdy due to the fed-              City: North Bethesda, Md.
eral government and related industries, which give the area a very             Buyer: JRK Property Holdings
stable employment base. Coupled with a phased reopening, this                  Purchase Price: $109 MM
gives the Mid-Atlantic region a recovery head start.                           Price per Unit: $230,180

Nearly 1.3 billion in multifamily assets traded, while some 2,984              Westchester Tower
units came online across metro D.C. through the first third of
2020, with an additional 35,283 apartments underway. With the
impact of the health crisis becoming increasingly apparent, we
expect both construction and transactions to slow down this year.

Market Analysis | Spring 2020                                                  City: College Park, Md.
                                                                               Buyer: Hampshire Properties
                                                                               Purchase Price: $66 MM
Contacts                                                                       Price per Unit: $216,997
Jeff Adler                                        Ron Brock, Jr.
Vice President & General                          Industry Principal, Matrix
                                                                               South Pointe
Manager of Yardi Matrix                           JR.Brock@Yardi.com
Jeff.Adler@Yardi.com                              (480) 663-1149 x2404
(800) 303-615-3676
                                                  Author
Jack Kern                                         Bogdan Odagescu
Director of Research                              Senior Editor
and Publications
Jack.Kern@Yardi.com
(800) 866-1124 x2444                                                           City: Temple Hills, Md.
                                                                               Buyer: Signature Properties
                                                                               Purchase Price: $43 MM
On the cover: Photo by vichie81/iStockphoto.com                                Price per Unit: $109,487
RENT TRENDS

➤ The first effects of the health crisis are emerging   ➤ Rent gains were uneven across the map in the 12
  into what was supposed to be prime leasing sea-         months ending in April. Capitol Hill led growth
  son. The average metro D.C. rent was down 70            (average rent up 11.0% to $2,749), followed by
  basis points month-over-month as of April—also          Fairfax (6.2% to $1,876) and Forestville/Suitland
  registering a 10-basis-point drop on a trailing         (5.5% to $1,391). Meanwhile, rates were down
  three-month (T3) basis—to $1,838. Meanwhile,            even before the COVID-19 crisis across a handful
  the U.S. rate was flat on a T3 basis and contract-      of submarkets, including North Reston (-3.2% to
  ed 0.5% month-over-month, to $1,465.                    $1,654), Columbia Heights (-1.9% to $2,131) and
                                                          Ashburn/Dulles/Sterling (-1.4% to $1,781).
➤ There was little variation across segments in the
  first months of 2020: Both the metro’s working-       ➤ A solid pipeline and rapid market softening
  class Renter-by-Necessity and Lifestyle rates con-      brought by the health crisis will dent the metro’s
  tracted 0.1% on a T3 basis, to $1,592 and $2,178,       multifamily prospects in the immediate term,
  respectively. In the long run, newly constructed        but long-term fundamentals are relatively sound,
  Class A properties could be more exposed, with          with the city better equipped to weather the
  softening occupancy and longer lease-up periods         storm than other large coastal metros.
  due to a temporary drop in high-end demand.

Washington, D.C. vs. National Rent Growth (Trailing 3 Months)

Source: Yardi Matrix

Washington, D.C. Rent Growth by Asset Class (Trailing 3 Months)

Source: Yardi Matrix

                                                            Washington, D.C. Multifamily | Spring 2020         3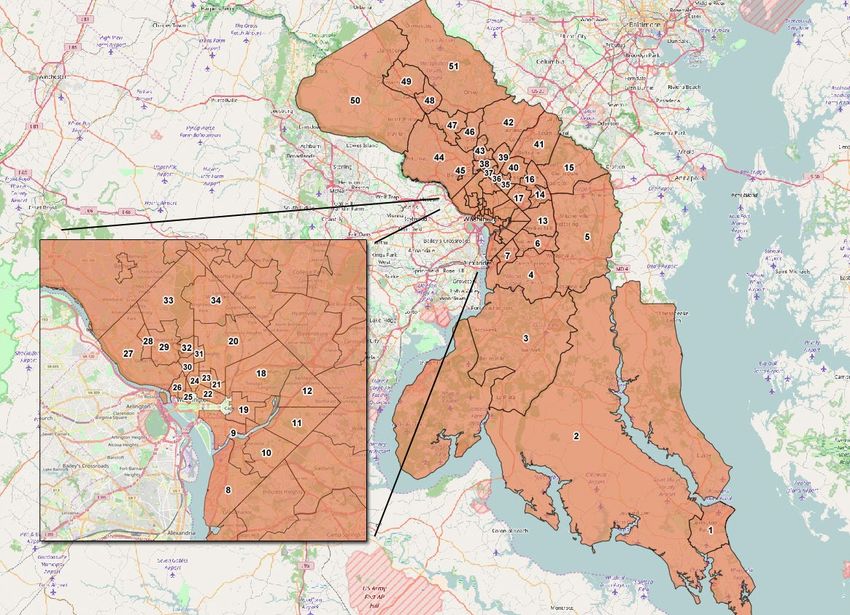
ECONOMIC SNAPSHOT

➤ Metro D.C. is relatively well prepared to weather                 trict alone it jumped 90 basis points to 6.0%. The
  the COVID-19 downturn, with its employment                        number of initial claims since the pandemic hit
  composition playing an important role. Accord-                    the U.S. reached 1.3 million across D.C., Mary-
  ing to a Yardi Matrix analysis of the country’s                   land and Virginia by mid-May. A deceleration
  top 50 metros for total employment, Washing-                      trend followed the initial shock, but claims still
  ton, D.C., had the lowest share of jobs in at-risk                continued to add up at an unprecedented rate.
  sectors—25%. By comparison, hospitality- and
  energy-heavy metros such as Las Vegas (49%),                   ➤ Prior to the COVID-19 aftermath, metro D.C.
  Orlando (41%) or Houston (35%) topped the list.                  entered the second quarter in good shape, with
                                                                   31,600 jobs added year-over-year through March
➤ That said, the wide-ranging effects of social dis-               for a 1.5% expansion, above the 1.4% U.S. aver-
  tancing and stay-at-home orders have hit many                    age. Leisure and hospitality (-2,900 jobs) and
  gateway markets first, including Washington,                     education and health services (-2,400 jobs) were
  D.C. The metro’s unemployment rate was up 40                     the only two sectors that contracted.
  basis points in March, to 3.4%, while for the Dis-

Washington, D.C. Employment Share by Sector
                                                                                        Current Employment
 Code                          Employment Sector                                      (000)           % Share
  60      Professional and Business Services                                           782             23.2%
  90      Government                                                                   734             21.8%
  55      Financial Activities                                                         163              4.8%
  80      Other Services                                                               212              6.3%
  15      Mining, Logging and Construction                                             164              4.9%
  40      Trade, Transportation and Utilities                                          404             12.0%
  50      Information                                                                   78              2.3%
  30      Manufacturing                                                                 57              1.7%
  65      Education and Health Services                                                450             13.4%
  70      Leisure and Hospitality                                                      327              9.7%
Sources: Yardi Matrix, Bureau of Labor Statistics

Population                                          Washington, D.C. vs. National Population

➤ Metro D.C. added 584,889 resi-                                    2015           2016        2017         2018
  dents between 2010 and 2018. That
  marked a 10.3% expansion, nearly                   National   320,742,673 323,071,342 325,147,121 327,167,434
  double the 5.8% U.S. average.
                                                     Metro
➤ Domestic net migration has been                                  6,082,465     6,139,035    6,200,001    6,249,950
                                                     DC
  negative since 2014, but strong im-
  migration and natural population                  Sources: U.S. Census, Moody’s Analytics
  growth continues to offset the trend.

                                                                     Washington, D.C. Multifamily | Spring 2020          4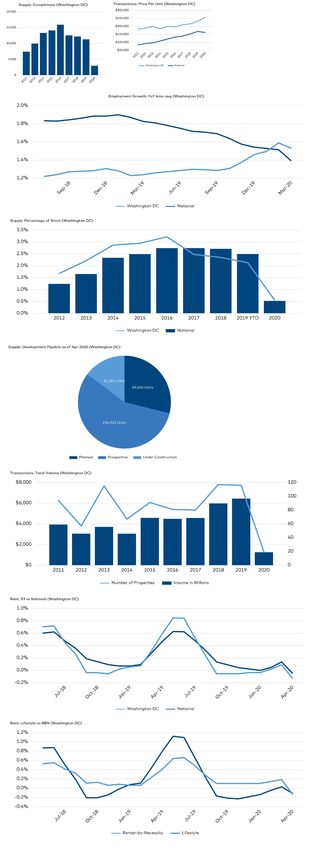
SUPPLY

➤ Some 2,894 units came online across metro              Trinidad/Woodridge (3,394 units) and Ger-
  D.C. in the first four months of the year, with        mantown/Montgomery Village (1,918 units).
  an additional 35,283 apartments underway—
  one of the country’s largest pipelines. Only two    ➤ As of April, Lerner Enterprises led the pipeline
  of the properties completed in 2020 through           (1,862 units underway in two communities),
  April were located in the District, with the re-      followed by JBG Smith Properties (1,784 units
  maining eight spread across Northern Virginia.        in five communities) and MRP Realty (1,624
  Continuing a well-established trend apparent          units in five communities).
  throughout the cycle, the vast majority of proj-
  ects that were recently completed or are under
  construction cater to Lifestyle renters.
                                                         Washington, D.C., Completions (as of April 2020)
➤ While the health crisis delayed many ongoing
  projects and affected groundbreakings, most
  development continued across the metro, in-
  cluding projects within or close to the Amazon
  headquarters site in Northern Virginia. However,
  many of the area’s more than 200,000 multi-
  family units that are in the planning and permit-
  ting stages could face longer delays or even get
  axed, while the COVID-19 downturn unfolds.

➤ Of all units underway as of April, 44% of
  projects were within the District, 36% across
  Northern Virginia and 20% in suburban Mary-
  land. The list of submarkets leading develop-
  ment included Barry Farms/St. Elizabeths
                                                         Source: Yardi Matrix
  (5,903 units under construction), Brentwood/

Washington, D.C. vs. National Completions as a Percentage of Total Stock (as of April 2020)

Source: Yardi Matrix

                                                           Washington, D.C. Multifamily | Spring 2020       5
TRANSACTIONS

➤ Nearly $1.2 billion in assets traded in 2020
                                                         reflecting an almost even breakdown between
  through April, at an average per-unit price of
                                                         Lifestyle and Renter-by-Necessity communi-
  $256,176, well above the $162,169 U.S. aver-
                                                         ties. Of the 88 assets that traded, only 12 were
  age. Washington remained one of the country’s
                                                         located within the District, while the suburbs
  largest targets for capital and is poised to hold
                                                         continued to take the lion’s share.
  this position, even as transaction activity slows
  down across the U.S.—the metro’s fundamen-
                                                      ➤ Washington Real Estate Investment Trust was
  tals are relatively well insulated, at least when
                                                        the most active buyer in the 12 months ending
  compared to other major coastal markets.
                                                        in April, acquiring more than 2,300 units for a
                                                        total of $529 million.
➤ More than $6 billion in assets traded in the 12
  months ending in April, with deal distribution

Washington, D.C., Sales Volume and Number of Properties Sold (as of April 2020)

Source: Yardi Matrix

Top Submarkets for Transaction Volume1                Washington, D.C., vs. National Sales Price per Unit

                                     Volume
            Submarket                ($MM)
 College Park                         526
 Eisenhower East/Fort Hunt/
                                      427
 Franconia
 Pentagon City/Penrose                345
 Fairland                             329
 South Herndon                        292
 Alexandria West                      254
 Wheaton                              195
                                                      Source: Yardi Matrix
Source: Yardi Matrix
1 From April 2019 to March 2020

                                                          Washington, D.C. Multifamily | Spring 2020        6
EXECUTIVE INSIGHTS                                                                        Brought to you by:

Who’s Still Investing in DC’s Multifamily Market?

By Laura Calugar

With the economic havoc brought on by the COVID-19 crisis, many investors “are now in a
wait-and-see mode,” according to Foulger-Pratt Managing Partner & Chief Operating Officer
Brigg Bunker. In the interview below, he talks about how the unprecedented situation is
impacting his company and other real estate players in the D.C. area, as well as the state of
multifamily investment in the market.

What should we know about the                                              Many of the hottest submarkets
D.C. multifamily market?                                                   are synonymous with new luxury
                                                                           product. Consumer spending has
The market has changed dra-                                                changed, but the lasting effects
matically recently. There are                                              of those changes remain to be
many people going through                                                  seen. The amount and timing of
challenging and uncertain times,                                           rent growth is certainly unknown
resulting in changes in consumer                                           at this time. Depending on how
habits, including the consistency                                          quickly a recovery occurs and what
of rent payments. As a result,                                             happens to wages, people may
there is significant uncertainty                                           choose to stay in shared house-
around existing projects and                                               holds or look for less expensive
projects under construction,          completion. From a debt perspec-     housing options that could affect
projects in lease-up and projects     tive, an unintended consequence      some of the more expensive but
hoping to start in the near term.     of implementing the Paycheck         desirable submarkets.
The uncertainty will continue un-     Protection Program is that many
til the COVID-19 restrictions are     of the resources used for new loan   How are demand and supply
lifted and we start to see how        origination are now being utilized   performing across the metro?
the recovery will take place.         to implement the Small Business
                                      Administration’s program. This       Individual submarkets of new lux-
Are investors still pursuing          may result in a significant number   ury product may experience tem-
multifamily deals in the D.C. area?   of banks being on the sidelines in   porary oversupply, but overall we
                                      the near term. Projects that are     continue to be underhoused in the
There are certainly a lot of eq-      teed up and ready to go in primary   region. The more pressing issue is
uity investors who are now in a       markets where specific submar-       whether we, as an industry, can
wait-and-see mode to determine        kets are underhoused continue to     deliver the type of housing to meet
whether or not they want to con-      attract equity investment during     the needed demand in workforce
tinue investing in the current en-    these uncertain times.               and affordable housing.
vironment. We also see long-term
equity sources working to move        How is the new economic situation    (Read the complete interview on
forward given the time frame          impacting D.C.’s hottest areas for   multihousingnews.com.)
needed prior to construction          multifamily development?

                                                             Washington, D.C. Multifamily | Spring 2020          7
WASHINGTON, D.C. SUBMARKETS

Area                                       Area                                             Area
No.                Submarket               No.                Submarket                     No.               Submarket
 1     Lexington Park                       18    Brentwood/Trinidad/Woodridge               35    Chillum/Queens Chapel
 2     California/Leonardtown/              19    Capitol Hill                               36    Takoma Park
       Prince Frederick                     20    Brookland/South Petworth                   37    Downtown Silver Spring
  3    St. Charles/Waldorf                  21    North Capitol                              38    West Silver Spring
  4    Camp Springs/Fort Washington         22    Penn Quarter                               39    East Silver Oak/White Oak
  5    Bowie/Lake Arbor/Largo               23    Logan Circle/West Mount Vernon             40    College Park
  6    Forestville/Suitland                 24    South 16th Street/Scott Circle Corridor    41    Beltsville/Laurel/South Laurel
  7    Hillcrest Heights/Marlow Heights     25    East Foggy Bottom                          42    Fairland
  8    Congress Heights/Congress Park       26    West Foggy Bottom                          43    Wheaton
  9    Barry Farms/Saint Elizabeths         27    Georgetown/Wesley Heights/                 44    Chevy Chase/Potomac
 10    Anacostia/Garfield Heights                 South Glover Park                          45    Downtown Bethesda
 11    Fort Dupont Park/Marshall Heights    28    West Cleveland Park/Wisconsin Avenue       46    Aspen Hill/Rossmoor
 12    Deanwood                             29    East Cleveland Park/Woodley Park           47    East Rockville
 13    Seat Pleasant/Walker Mill            30    Adams Morgan/North Dupont Circle           48    East Gaithersburg/Redland
 14    Cheverly/Glenarden/Landover Hills    31    Columbia Heights                           49    Germantown/Montgomery Village
 15    Goddard/Glenn Dale                   32    Mount Pleasant                             50    West Gaithersburg
 16    West Greenbelt/East Riverdale        33    North Connecticut Ave. Corridor            51    Olney
 17    Bladensburg/Riverdale Park           34    Brightwood/16th Street Heights

                                                                         Washington, D.C. Multifamily | Spring 2020                 8
ECONOMIC SNAPSHOT
DEFINITIONS

Lifestyle households (renters by choice) have wealth sufficient to own but have chosen to rent.
Discretionary households, most typically a retired couple or single professional, have chosen the flexibility
associated with renting over the obligations of ownership.

Renter-by-Necessity households span a range. In descending order, household types can be:

➤ A young-professional, double-income-no-kids household with substantial income but without wealth
  needed to acquire a home or condominium;

➤ Students, who also may span a range of income capability, extending from affluent to barely getting by;

➤ Lower-middle-income (“gray-collar”) households, composed of office workers, policemen, firemen, techni-
  cal workers, teachers, etc.;

➤ Blue-collar households, which may barely meet rent demands each month and likely pay a disproportion-
  ate share of their income toward rent;

➤ Subsidized households, which pay a percentage of household income in rent, with the balance of rent
  paid through a governmental agency subsidy. Subsidized households, while typically low income, may
  extend to middle-income households in some high-cost markets, such as New York City;

➤ Military households, subject to frequency of relocation.

These differences can weigh heavily in determining a property’s ability to attract specific renter market
segments. The five-star resort serves a very different market than the down-and-outer motel. Apartments
are distinguished similarly, but distinctions are often not clearly definitive without investigation. The Yardi®
Matrix Context rating eliminates that requirement, designating property market positions as:

                       Market Position                           Improvements Ratings
                       Discretionary                                      A+ / A
                       High Mid-Range                                    A- / B+
                       Low Mid-Range                                      B / B-
                       Workforce                                     C+ / C / C- / D

The value in application of the Yardi® Matrix Context rating is that standardized data provides consistency;
information is more meaningful because there is less uncertainty. The user can move faster and more
efficiently, with more accurate end results.

The Yardi® Matrix Context rating is not intended as a final word concerning a property’s status—either
improvements or location. Rather, the result provides reasonable consistency for comparing one property
with another through reference to a consistently applied standard.

To learn more about Yardi® Matrix and subscribing, please visit www.yardimatrix.com or call Ron Brock,
Jr., at 480-663-1149 x2404.

                                                               Washington, D.C. Multifamily | Spring 2020          9
How do you find properties to buy or develop?

Invest confidently using the industry’s most comprehensive market
intelligence service. Only Yardi Matrix continuously updates and verifies
critical data for 17 million+ units within more than 90,000 multifamily
properties in 133 U.S. metros that encompass 90% of the population.

                                                                                                     (800) 866-1144
                                                                                                     YardiMatrix.com

                  ©2019 Yardi Systems, Inc. All Rights Reserved. Yardi, the Yardi logo, and all Yardi product names are trademarks of Yardi Systems, Inc.
DISCLAIMER
Although every effort is made to ensure the accuracy, timeliness and completeness of the information provided in this
publication, the information is provided “AS IS” and Yardi Matrix does not guarantee, warrant, represent or undertake that
the information provided is correct, accurate, current or complete. Yardi Matrix is not liable for any loss, claim, or demand
arising directly or indirectly from any use or reliance upon the information contained herein.
COPYRIGHT NOTICE
This document, publication and/or presentation (collectively, “document”) is protected by copyright, trademark and other
intellectual property laws. Use of this document is subject to the terms and conditions of Yardi Systems, Inc. dba Yardi
Matrix’s Terms of Use (http://www.yardimatrix.com/Terms) or other agreement including, but not limited to, restrictions
on its use, copying, disclosure, distribution and decompilation. No part of this document may be disclosed or reproduced
in any form by any means without the prior written authorization of Yardi Systems, Inc. This document may contain
proprietary information about software and service processes, algorithms, and data models which is confidential and
constitutes trade secrets. This document is intended for utilization solely in connection with Yardi Matrix publications and
for no other purpose.
Yardi®, Yardi Systems, Inc., the Yardi Logo, Yardi Matrix, and the names of Yardi products and services are trademarks or
registered trademarks of Yardi Systems, Inc. in the United States and may be protected as trademarks in other countries.
All other product, service, or company names mentioned in this document are claimed as trademarks and trade names by
their respective companies.
© 2020 Yardi Systems, Inc. All Rights Reserved.
Washington, D.C. Multifamily | Spring 2020 11You can also read


