Debt Investor Presentation - May 2023 - First Abu Dhabi Bank

Page created by Tom Moran
 
CONTINUE READING
Debt Investor Presentation - May 2023 - First Abu Dhabi Bank
Debt Investor
Presentation
May 2023
Debt Investor Presentation - May 2023 - First Abu Dhabi Bank
Disclaimer

•    Comparative figures have been reclassified where appropriate to conform to the presentation and accounting policies adopted in the consolidated financial statements

•    Integration of Bank Audi Egypt into FABMisr was completed in Q4’22. FABMisr is grouped under Head Office on an interim basis, whilst product and business segmentation is aligned to the Group norms

•    Figures for prior periods, accordingly, have been restated or adjusted where appropriate for comparative purposes. Please refer to IR Quarterly Series for segmental information on a quarterly basis since beginning of 2022

    The information contained herein has been prepared by First Abu Dhabi Bank P.J.S.C (“FAB”). The information contained in this presentation may not have been reviewed or reported on by the group’s auditors. FAB relies on
    information obtained from sources believed to be reliable but does not guarantee its accuracy or completeness.

    This presentation has been prepared for information purposes only and is not and does not form part of any offer for sale or solicitation of any offer to subscribe for or purchase or sell any securities nor shall it or any part of it
    form the basis of or be relied on in connection with any contract or commitment whatsoever.

    Some of the information in this presentation may contain projections or other forward-looking statements regarding future events or the future financial performance of FAB. These forward-looking statements include all
    matters that are not historical facts. The inclusion of such forward-looking information shall not be regarded as a representation by FAB or any other person that the objectives or plans of FAB will be achieved. FAB undertakes
    no obligation to publicly update or publicly revise any forward-looking statement, whether as a result of new information, future events or otherwise.

    Please note that rounding differences may appear throughout the presentation.

May 2023 Debt Investor Presentation                                                                                                                                                                                                             2
Debt Investor Presentation - May 2023 - First Abu Dhabi Bank
The UAE’s leading bank,
and one of the world’s largest and
safest financial institutions

                                     3
Debt Investor Presentation - May 2023 - First Abu Dhabi Bank
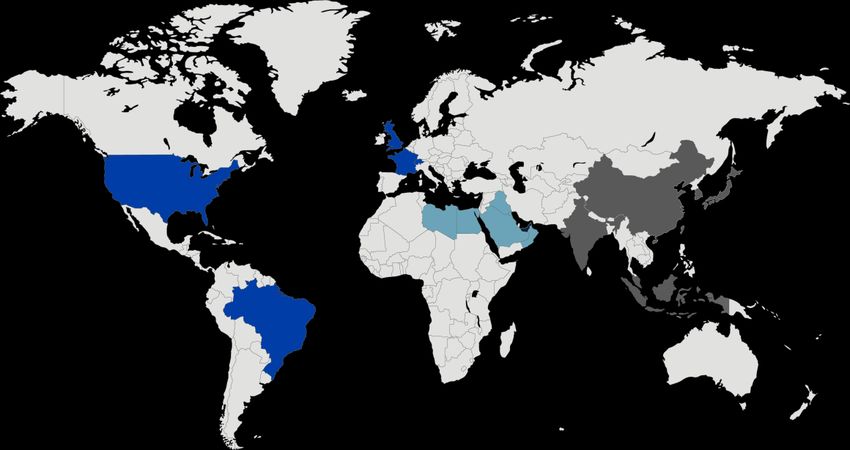
We are the UAE’s leading bank, and one of the world’s largest and safest
financial institutions

          UAE’s Leading Bank and Regional Banking Powerhouse                                                                                           Amongst Safest and Strongest Banks Globally
      Largest Bank in the UAE and                                   A Market Heavyweight, among the
                                                                                                                                                                                                        Safest banks rankings2

                                                                                                                                       AA-
      amongst the Largest in MENA                                 largest banks by market cap globally
                                                                                                                                                                                              In UAE &                 In Emerging                        Safest
                                                                                                                                                                                   #1        Middle East       #5        Markets            #14         Commercial
         Total
        Assets
                              1,185                                   Market
                                                                   Capitalisation                    142                              Strongest
                                                                                                                                                                                                                                                      Bank Worldwide

                                    AED Bn                                                             AED Bn                                                                                       Top 1,000 banks rankings3
                                                                                                                                      Combined
                                                                                                                                     Credit Rating                                      #1                  #3               #91                     #109
                                  323                                                                   39                             in MENA
                                                                                                                                                                                        In UAE            In MENA
                                                                                                                                                                                                    By Tier 1 capital strength
                                                                                                                                                                                                                              Worldwide                Worldwide
                                                                                                                                                                                                                                                    By Total Assets
                                    USD Bn                                                             USD Bn

    Dominant Franchise and                                         Generating Superior Returns                                                                                                                   Regional Pacesetter for
                                                                                                                                     Top Ranked Investment Bank
   Diversified Business Model                                      Through a Robust Foundation                                                                                                                Sustainability & Climate Action

                                     39% Investment Banking

         USD Bn                     25%      Corporate &
                                             Commercial Banking
                                                                                    18.5% 25.1%                                                                 #1          Agent Bank                        1   st
                                                                                                                                                                                                                       UAE and GCC Bank to join the
                                                                                                                                                                                                                       Net Zero Banking Alliance (NZBA)
                                                                                          RoTE                      CI Ratio4
         1.8
       Operating
                                     12% Consumer Banking
                                             Global Private
                                                                                                                                                                #1
                                                                                                                                                                            Loan
                                                                                                                                                                            Bookrunner                        # 1      Leader in the Green Bond market
                                     4%
        Income                               Banking

                                     20% Head Office
                                                                                    13.2% 151%                                       MENA league
                                                                                                                                      tables as of              #1         DCM / ECM
                                                                                                                                                                                                                Sustainable finance target by 2030
                                                                                          CET1                         LCR              FY’225                   UAE                                                           USD 75Bn
                                                                                                                                                                                                                       [Facilitated c.USD 15Bn to-date (Q1’23)]

All figures as on 31 March 2023 unless stated otherwise            2 Global Finance Magazine Safest Banks Rankings, September 2022   4 Ex- integration costs and gain on sale of stake in Magnati
1 by total assets; Source: Bloomberg, FAB, Peer financials         3 The Banker’s 2021 Top 1000 World Banks Rankings, July 2022      5 Bloomberg/ Dealogic MENA league tables as of FY’22

May 2023 Debt Investor Presentation                                                                                                                                                                                                                                    4
Debt Investor Presentation - May 2023 - First Abu Dhabi Bank
Our strategic international network facilitates cross-border liquidity, trade and
investment flows
                                                                                                                                                                                                               Diversified revenues across geographies

         Europe and Americas                                                                                                                                                                                       UAE                          77%
         France I UK I Switzerland
         USA I Brazil
                                                                                                                                                                                                                                              USD
         Middle East and Africa
         UAE | Egypt | KSA I Oman                                                                                                                                                                                                         1.8
                                                                                                                                                                                                                                           Bn
         Bahrain | Kuwait | Libya | Iraq

         Asia Pacific (APAC)                                                                                                                                                                                                                  23%
         China – Shanghai & Hong Kong
         India I Indonesia I Singapore
         Labuan(Malaysia) | South Korea                                                                                                                                                                                               International

                                                                                                                                                                                                     Contribution of international franchise is growing in-line
                                                                                                                                                                                                             with our long-standing growth strategy
                                       Global                                            Domestic                                                         Branches/Cash                                      International Revenue as a % of Group Operating Income
                                  presence across                                     Network Across                                                         offices3                                        International Revenue (USD Bn)

                                  20 Markets                                          7 Emirates                                                           65 in UAE                                   0.7             0.8          0.8           1.0          1.3     0.4

                                                                                                                                                                                                                                                               23%    23%
                                                                                                                                                                                                                                                                3%     2%     APAC
                                                                                                                                                                                                                                   16%           18%                   4%
                                     ATMs/CDMs                                          #Employees                                                        UAE customers1                              14%            14%                          2%            5%
                                                                                                                                                                                                                                    3%
                                                                                       FTEs globally2                                                                                                  3%             3%                          6%                          E&A
                                                                                                                                                                                                       6%             6%            7%                         15%    17%
                                   398 in UAE                                               6,737                                                           >3 million                                 5%             5%            6%            9%                          MENA

                                                                                     Across 85 nationalitites                                                                                         2018          2019          2020          2021          2022    Q1'23
1 includes Ratibi (Wages Protection System) and E-dirham customers     The above map summarises market presence for FAB and its subsidiaries, where the Group currently has active operations; For
2 Full Time Employees, excludes outsourced staff; includes BAE staff   information about legal presence please refer to Notes #1 and #3 of March-end 2023 financial statements
3 Excluding Islamic branches

May 2023 Debt Investor Presentation                                                                                                                                                                                                                                             5
Debt Investor Presentation - May 2023 - First Abu Dhabi Bank
Among the most profitable AA- rated banks globally

                                     25%

                                                                                                                                         Al Rajhi
                                                                                      TDBank****                                                                                                                                              Western banks
                                                                                                                                                                                                                                              GCC banks
                                                                                      Scotia****                                                                                                                                              APAC banks
                                                                                                                                                                     Macquarie*
                                     20%              RBC****

                                                                                                                JP Morgan                                             Mashreq
                                                                                                                 QNB                     ENBD
                                                                                                                              SNB                                                                                           HDFC Bank*
                                                                                                                NBK
     Return on Tangible Equity (%)

                                                         DBS                                                          Morgan Stanley      BofA
                                                                            CBA**
                                     15%                                                                                                 KFH
                                                                                                                                                                                                                ICICI*
                                                                                      UBS
                                                                           Swedbank
                                                                                                            ADCB                                       Lloyds        CBQ
                                                                                          Nordea             Woori Bank                                              Natwest
                                                         UOB
                                                                    OCBC    NAB***                                                                                                                                          State Bank of India*
                                                 Handelsbanken                            ANZ***                Credit Agri   ICBC       Agri Bank China             GS
                                                                                                                                          Bank of China
                                                         BCV                                                                                                         Saudi Fransi             Barclays
                                     10%                                              Ind. Bank of Korea
                                                                                                                BNP           HSBC                  Citigroup                                                                                                 Bank Muscat
                                                                                                                                                                     Deutsche Bank
                                                                            Westpac***

                                                                                                                ING                      MUFG*
                                                                                                                                                                     StanChart        Doha Bank
                                                                                                                                          Mizuho*
                                                                                                                                         Sumitomo*
                                     5%
                                                                                                                                                                                    Nomura*
                                                                                                                                                                                                                                                    ABC

                                                                                                                                          SocGen

                                     0%

                                           AA+                 AA                   AA-                    A+                        A                          A-                       BBB+            BBB         BBB-                    BB+                         BB
                                                                                                                                                 Composite Rating
Notes: RoTE for peer banks are estimated as: {net attributable profit less Tier-1 interest or Coupon payable on capital securities} / [average tangible equity]; ^Banks in the above peer group have different financial year endings; FY ending other than 31-Dec are
highlighted with special characters: * for 31-Mar; ** for 30-Jun; *** for 30-Sep & **** for 31-Oct; Source: Bloomberg

May 2023 Debt Investor Presentation                                                                                                                                                                                                                                           6
Leading UAE and regional banking powerhouse

                                                                                                      Q1’23
           Banking sector assets1                                             National              Net Profit2   Total Assets2                  Equity2                 Market Cap4            Credit Ratings4
                      (USD Bn)                                              champion2,3              (USD Bn)         (USD Bn)                   (USD Bn)                   (USD Bn)           (Moody’s/S&P/Fitch)

                                            999                                                        1.1              323                       30.5                        38.7             Aa3 / AA- / AA-
    UAE

                                           974                                                         1.3              259                        45.4                       54.7                A1 / A- / A-
    KSA

                             511                                                                       1.1              324                        28.2                       40.5               Aa3 / A+ / A
   Qatar

                       281                                                                             0.4              119                        14.7                       26.0                A1 / A / A+
   Kuwait

                      225                                                                              ​0.5​            120                        20.2                       35.65               A2 / NR / A
  Bahrain

                         104                                                                           0.1               ​34​                      5.6                         5.4               Ba3 / BB / BB
   Oman

1 Central Bank information as of the latest available data; Assets are gross including provisions                 5 AUB acquired by KFH; figures consolidated as part of KFH’s FY’22 results
2 Company information as of 31 March 2023, unless specified otherwise
3 Defined as the largest bank in the country by total assets
4 Based on 31 March 2023; Source Bloomberg

May 2023 Debt Investor Presentation                                                                                                                                                                                  7
Diversified and client-centric business model

                                                                                                                 Corporate &
                                                                  Investment                                                                                                 Consumer                                                     Global Private
                                                                                                                 Commercial
                                                                  Banking                                                                                                    Banking                                                      Banking
                                                                                                                 Banking

% Group
operating                                                             39%                                            25%                                                          12%                                                           4%
income
(Q1’23)

                                          Offers banking & financing solutions,                  Diversified products offering across                      Product ranges offered include                              Offers a diversified range of Everyday
Products &                                including corporate & Islamic finance,                 sub-segments which include                                everyday banking products such as                           Banking and Investment products &
                                          capital markets, transaction banking,                  Corporate Banking, Contracting,                           current accounts, deposits, credit                          solutions in key Global Booking Centres
Services                                  trade, liquidity and cash management                   Commercial Banking and Privileged                         cards, loans, wealth products etc.                          such as UAE, Switzerland and Singapore
                                          services along with a broad range of risk              Client Group                                                                                                          including Investment Advisory,
Offered                                   management solutions across credit,                                                                                                                                          Discretionary Portfolio management
                                          rates, FX and money market products                                                                                                                                          and brokerage services

                                          Full range of banking services for                     Focus on large corporates,                                Targets consumer and elite                                  Targets HNWI, UHNWI, Family
Customer                                  institutional clients: Government,                     medium and small entities                                 segment across conventional and                             Offices and Special Purpose
Segment                                   GREs, SWFs, financial institutions,                                                                              Islamic banking                                             Vehicles across conventional and
                                          large conglomerates                                                                                              Payments: Payit, Magnati1                                   Islamic sector

Head Office (HO) as a segment contributed 20% to FAB’s Q1’23 revenues. HO provides centralised business and administrative support to all business units of the Group. It also includes a diversified business model supported by complementary offerings provided across
real estate & property management services through subsidiaries partially or fully owned by the group. These include FAB Properties, Abu Dhabi National Properties and First Gulf Libya. FABMisr has been included in HO, on an interim basis, whilst product and business
segmentation is aligned to the group norms.

1 FAB owns a 40% stake in Magnati (classified as an investment in associate)
2 For full list of subsidiaries and associates, please refer to our financial statements

 May 2023 Debt Investor Presentation                                                                                                                                                                                                                                         8
Diversified franchise by business segment and geography

                                                  Breakdown by Business                                                                                                    Breakdown by Geography

                Investment Banking                                            Corporate & Commercial Banking
                Consumer Banking                                              Global Private Banking                                                                 UAE                International
                Head Office3

                     Operating Income                                                   Profit after taxes                                               Operating Income                               Profit after taxes
  Q1’23                             12%                          Q1’23
  USD 1.8Bn                                                      USD 1.1Bn                       23%              6%                   Q1’23                                            Q1’23
                                      20%
                                                 4%                                                                                    USD 1.8Bn
                                                                                                    28%                                                                                 USD 1.1Bn
                                                                                                                          3%
                 25%                                                                                                                                                                                81%   93%
                      23%                        5%                                                                 16%
                                                                                                                                                   77%
                                                                                                                                                         78%
Q1’22                                                  20%       Q1’22
USD 1.2Bn                                                        USD 0.6Bn                                                   17%
                                                 12%                                                                    5%
                                                                                                                     2%                Q1’22                                22%         Q1’22
                                                                                                                                       USD 1.2Bn                                  23%   USD 0.6Bn
                                                                                                                                                                                                                        7%   19%
                                  40%                                                                     50%

                             39%                                                                 51%

                               Loans                                                            Deposits                                                        Loans2                                    Deposits2
                                                         5%                                                                    3%
                       45%              34%     11% 6%                                         66%              18% 9% 4%                                      82%            18%                         75%          25%

  1 All figures as of 31 March 2023 / Q1’23 financials and based on operating income excluding Magnati-related capital gains in 2022
  2 Based on loan origination / coverage
  3 FABMisr integration was completed in Q4’22 and is grouped under Head Office (HO)

  May 2023 Debt Investor Presentation                                                                                                                                                                                              9
A Regional Pacesetter for
Sustainability and Climate Action

                                    10
A Regional High Performer on Sustainability

                                ENTITIES                    BEST                            SCORE                             WORST         PEER COMPARISON

                                                            0      10        20                 30         40                             80+
                                                                                                                                                Top 30% Banks
                                                                                   22.6                                                           Worldwide

                                                           AAA     AA        A                  BBB        BB        B             CCC          Average score
                                                                                       A                                                        among Banks
INDUSTRY RELEVANCE

                                                                                                                                                 Worldwide

                                                            A      A-   B                  B-         C         C-       D           D-         Second best
                                                                                                                               D                score in the
                                                                                                                                                Middle East

                                                           100          75                            50                 25                0    Top 20% Banks
                                                                                  67                                                              Worldwide

                                                           100          75                            50                 25                0    Highest bank
                                                                                       57.1                                                      score in the
                                                                                                                                                 Middle East

                     May 2023 Debt Investor Presentation                                                                                                        11
Delivering against our sustainability agenda
FY’22 ESG Performance at a Glance

               TRANSITIONING                                                           CAPITALISING                                                          TRANSFORMING
               to a Low Carbon Future                                                  on our Social Responsibility                                          our Governance Model

  GREEN FINANCE                                                            FINANCIAL INCLUSION                                              GOVERNANCE STRUCTURE & RISK FRAMEWORK
                                                                                                                                                 Established a Board Risk & ESG Committee and
       Facilitated Sustainable Projects                                        Supported SMEs with USD 0.8 billion new lending
       2030 Target: USD 75Bn
                                                 >USD 9.1Bn                    in FY’22
                                                                                                                                                 introduced ESG-related KPI’s for Board and Senior
                                                                                                                                                 Management
       Leader in Green Bonds market                                            Collaborated with VISA on She’s Next                              Implemented the ESG Risk Framework and updated
       (Total Green Bonds outstanding at USD 2.2Bn as of Dec’22)               to support female entrepreneurs                                   Sustainable Finance Framework to align with best
                                                                                                                                                 international practice

  GREEN PRODUCT SUITE                                                      DIVERSE AND INCLUSIVE WORKPLACE                                  TRAINING, EDUCATION AND AWARENESS

       Launched multiple Green Products including Green Car Loans in           Emiratisation
                                                                               Target: 50% by 2025
                                                                                                           44%                                   c.10,000 hours of ESG training conducted with focus on
       partnership with Tesla; Sustainable CASA and Sustainable Supply                                                                           awareness, Strategy, Risk and Sustainable Finance
       Chain Financing                                                                                    (2020: 37%)
                                                                                                                                                 Framework
                                                                               Women at senior management 20% (9.7% in 2020) Targets:
       First bank in the MENA to join Partnership for Carbon Accounting        30% by 2025, 40% by 2030
       Financials (PCAF) to support setting our baseline for financed
       emissions                                                               Became signatory to the Gender Acceleration pledge with
                                                                               UAE’s Gender Balance Council

  WASTE MANAGEMENT                                                         SOCIAL RESPONSIBILITY EFFORTS                                    GENDER DIVERSITY

       Supported Abu Dhabi’s removal of single-use plastic initiative by       Supported Make It In The Emirates initiative: 80% of FAB’s        Female Board Directors
       implementing a single-use plastic policy internally.                    procurement sourced locally in the UAE                            in the Group’s subsidiaries        22%
                                                                                                                                                 2025 Target: 20%                 (2021: 15%)
       Partnered with Abu Dhabi Coop to help the gradual phase-out of          Sponsor of the 26th World Volunteering Conference, taking
       plastic bags.                                                           place for the very first time in the UAE                          2030 Target: 40%

May 2023 Debt Investor Presentation                                                                                                                                                                       12
We are committed to become a net zero bank by 2050
Our timeline to net zero
 In 2022, we have set production-based carbon intensity targets across three of our highest emitting sectors. Our targets are in line with the emissions reduction trajectory
 required to reach the International Energy Agency’s (IEA) Net Zero Emissions (NZE) scenario as outlined in our Net Zero disclosure.

              Scan the code                                                                                2021
              or click below to access                                                                                                         2023
              FAB’s Pathway to Net Zero                                                                   Group ESG strategy finalised and
                                                                                                          approved                            Implementation of TCFD                                         2050
                                                                                                                                              recommendations and
                                                                                       2020               FAB became a signatory of Net
                                                                                                          Zero Banking Alliance (NZBA)
                                                                                                                                              publication of first TCFD report                              Net Zero carbon
                                                                                                                                                                                                            emissions
                                                                                      Facilitated USD
                                                                                                          New target to lend, invest, and     Develop net zero pathway for
                     2015                                         2017                35.8Bn of
                                                                                                          facilitate business of USD 75Bn     emissions from FAB
                                                                                      sustainable
                                                                                                          by 2030                             operations
                    FAB becomes the first                        First MENA           financing
                    and only UAE bank to                         bank to issue        between 2015
                                                                                                          Facilitated USD 11.3Bn of           Apply emissions reduction
                    be a signatory to the                        a Green Bond         to 2020
                                                                                                          sustainable finance                 targets to high-emitting
                    Equator Principles                                                                                                        sectors within loan portfolio
                                                                                                                                                                       Execution of delivery plan to meet
                                                                                                                                                                       carbon emission reduction targets

          2010                            2016                                   2019                                  2022                          2024             2030
        First Sustainability            Committed to lend,                       Committed to implement the          Set baseline for                                            Reduction of carbon intensity
                                                                                                                                                   Set emission
        Report published by             invest and facilitate USD                recommendations from the            financed emissions                                          for high-emitting sectors
                                                                                                                                                   reduction
        FAB (then NBAD)                 10Bn by 2026 to                          Task Force on Climate-related       for net zero pathway
                                                                                                                                                   targets for
                                        sustainable activities                   Financial Disclosures (TCFD)                                      all sectors
                                                                                                                     Facilitated USD 9.1Bn                                       Achieve USD 75Bn of
                                                                                 FAB became a signatory to the       in sustainable finance                                      sustainable finance committed
                                                                                 Abu Dhabi Sustainable Finance                                                                   through lending, investing, and
             Past           With regards to our operational
                                                                                 Declaration                                                                                     facilitating business
                            emissions, we achieved a 38%
             Present        reduction in our scope 1 emissions
                            across our UAE operations as                                                                                                                         Achieve Net Zero from own
             Future         compared to 2021
                                                                                                                                                                                 operations (Scope 1 and Scope
                                                                                                                                                                                 2)
May 2023 Debt Investor Presentation                                                                                                                                                                                       13
The Regional Financial
SHAPING                  Institution of Choice.

THE                          Strategically Driven
                                   ACTING WITH PURPOSE

FUTURE                           Value - Driven
                               DELIVERING SUSTAINABLE GROWTH

                               Forward - Driven
With purposeful action       MOVING BEYOND TRADITIONAL BANKING

for sustainable growth

                                                                 14
Good progress against our strategic priorities in Q1’23

                                                  ✓ Strong deal pipeline execution and commercial momentum across several areas
                                                  ✓ Strength in fee-based business, enhanced cross-sell, driving further income growth and
                                                     diversification

       1                              STIMULATE   ✓ Offering innovative solutions to our clients, leveraging strategic partnerships
                                      GROWTH
                                                  ✓ Ongoing investments in talent and technology to support business growth, including key
                                                     senior management hires to help drive strategy execution
                                       CATALYSE
       2                              CHANGE      ✓ Recognised as the UAE’s most valuable banking brand in the 2023 Brand Finance UAE 50
                                                  ✓ Significant progress to deliver Group ESG agenda:
                                       ENHANCE          o   First MENA bank to set GHG emissions reduction targets to high-emitting sectors
       3                        CONNECTIVITY            o   Facilitated over USD 5Bn in sustainable financing in Q1‘23, that is c.USD 15Bn
                                                            to-date, in line with the Group’s 2030 target of USD 75Bn

                                                        o   Signed UAE Climate Responsible Companies Pledge

                                                        o   Election of 3 new board members including the first female board member

May 2023 Debt Investor Presentation                                                                                                           15
Leveraging technology and strategic partnerships to drive sustainable growth

 IMPROVED SELF-SERVICE CAPABILITIES                                                           ENHANCING CUSTOMER EXPERIENCE                                                                      ENHANCED EFFICIENCY AND PRODUCTIVITY
                                                                                                                                                                                                 USING DIGITAL1
• Fully digital application process for current account and
  credit card applicants ~ Account opening within minutes                                   • Strengthened our credit card and payments proposition with
                                                                                              launch of FAB low-rate card and a new “Letsgo Payit Card” offering
• 274 automations delivered (lifetime)1 (across UAE and
  International). In Q1’23, 9 automations were delivered.
                                                                                              customers one of the lowest lending rates on spending and
                                                                                              seamless local & global payment options, respectively                                                          >86%                        >73%
• Bots processed ~11Mn transactions; savings of ~1.1Mn                                                                                                                                                 CASA onboarded via          Digitally registered users as
                                                                                            • Launched new servicing capabilities including AI chatbox &
  man-hours (lifetime)1. In Q1’23, Bots processed ~1.2Mn                                                                                                                                             digital process in Mar’23        a % of eligible users3
                                                                                              customer-RM (Relationship Manager) mobile communications
  transactions; savings of ~122k man-hours                                                                                                                                                             (vs 43% in Mar’22)               (vs 70% in Mar’22)
                                                                                            • Consumer Banking NPS4 improved QoQ to 54.6 in Q1’23 vs 50.7 in
• Customer-initiated digital sales of CASA & credit card
                                                                                              Q4’22
  increased more than 140% QoQ & accounted for more
  than a third of total acquisitions

LEVERAGING STRATEGIC PARTNERSHIPS TO
                                                                                             INNOVATION IN TRANSACTION BANKING                                                                               >93%                         >80%
CREATE VALUE                                                                                                                                                                                       Digital transactions in Q1’23    Digitally active users as a
                                                                                                                                                                                                   as a % of total transactions2    % of registered users3
• Strategic stakeholder in digital banking platform “Wio” and                               • Launched and extended Supply Chain Finance and Receivable                                                    (vs 88% in Q1’22)
  payments platform Magnati                                                                   Finance through FABeSCF to Saudi Arabia
• Strategic partnership with the Ministry of Finance to launch                              • FAB became the first UAE bank to offer sustainable supply chain
  the AED T-Sukuk program, to support liquidity management                                    solutions, and to launch CASA sustainability accounts

                                                                                                                                                                                                              +22%                        +19%
  within the UAE banking sector
                                                                                            • Strategic collaborations and partnerships to advance several
• Co-branded credit card sales grew 86% in Q1’23, leveraging                                  areas including banking-as-a-service, inventory financing, treasury
  recent strategic cards partnership with Majid Al-Futtaim Group                              management and sustainability-linked supply chain finance (S–SCF)                                           YoY growth in digital        YoY growth in digital
  (SHARE) and Al-Futaim Group (BLUE)                                                          solutions                                                                                                          logins                    transactions
• Launched corporate cards in partnership with Magnati                                                                                                                                                           (Q1’23)                      (Q1’23)
                                                                                            • Successful on-boarding of Virtual Account management solutions
                                                                                              for key clients
1 As of 31 March 2023, unless specified otherwise
2 Defined as total digital (mobile + internet banking) transactions as a percentage of all transactions performed digitally or at the branch and call centers
3 Metrics exclude dormant accounts and payit customers; previous disclosures included dormant accounts                        4 NPS for digital channels represents an average score for NPS across Internet and Mobile banking

May 2023 Debt Investor Presentation                                                                                                                                                                                                            FAB in brief        16
Q1’23 Financial
Performance

                  17
Q1’23 Key Performance Highlights

                  Key Financial Highlights
                                                                        ❑ Strong start to 2023
    Net profit
                                   1.1 ▲
                                   USD Bn
                                                         70% 60%
                                                          YoY1    QoQ      • Group Revenue +51% YoY1 and +14% QoQ driven by sustained momentum across all business
                                                                             segments, enhanced income generation across products and geographies
                                                                           • Q1’23 NPAT at USD 1.1Bn, +70% YoY1 and +60% QoQ; RoTE of 18.5%
                                                                           • Cost discipline maintained amid continued investments to support business growth
                                   1.8
                                   USD Bn
                                          ▲ 51%
                                                          YoY1
                                                                 14%
                                                                  QoQ
     Revenue                                                            ❑ Solid balance sheet fundamentals
                                                                           • Healthy loan growth; strong deposit inflows underline franchise strength, and our superior
       Return on                                    Return on Risk           credit ratings of AA- or equivalent as one of the safest banks in the world
     Tangible Equity                                Weighted Assets
                                                                           • Strong liquidity and funding profile with LCR at 151%

         18.5%                                          2.8%               • Healthy credit quality with stable NPLs, contained cost of risk and adequate provision buffers
     (Q1’22: 11.3%)1                                  (Q1’22: 1.6%)1       • Strong capital generation with CET1 +57bps QoQ to 13.2%

    Cost to Income                                  Common Equity       ❑ Q1’23 results underline solid progress against our growth strategy as the
         Ratio                                        Tier 1 Ratio        regional financial institution of choice

         25.1%                                         13.2%            ❑ The Group is uniquely positioned to drive sustainable growth and returns
       (Q1’22:     33.2%)1                            (Mar’22: 13.0%)     while shaping the future of banking in the UAE and the broader region
1 Excluding Magnati-related capital gains in 2022

 May 2023 Debt Investor Presentation                                                                                                                                          18
High double-digit earnings growth driven by sustained business activity, benefits from
higher interest rates, and enhanced income generation across a diversified franchise
                                                                                                                                                                         Q1’23 Summary P&L
                                                            Net profit bridge YoY (USD Mn)
                                                                                                                                       in USD Mn                                                 Q1’23         QoQ%     YoY%1
                                                                +70%    YoY1
                                           Excluding Magnati-related capital gains in 2022                                                 Net-Interest Income                                   ​1,205​        +​​5​   +​​41​

                                                                                                                                           Non-Interest Income                                     ​627​       +​​35​   +​​74​
                                                  +267                                                                1,070
                           +352                                                                                                        Operating Income                                          1,832         +14      +51
     764                                                              (47)
                                                                                      (93)             (39)
                                                                                                                                           Gain on sale of stake in subsidiary                      -          na        na

     630                                                                                                                               Total Income1                                             1,832         +​​14​   ​(7)​

                                                                                                                                           Operating costs                                        ​(459)​      (16)     +11
  Q1'22 NPAT           Net interest          Non-interest       Operating Costs    Impairment    Taxes & Minority   Q1'23 NPAT
                         income                income                              charges,net       Interest                          Operating Profit                                          ​1,373​       +29      (12)

                                                                                                                                           Impairment charges, net                                ​(217)​      ​(28)​   +74
                                                            Net profit bridge QoQ (USD Mn)
                                                                                                                                           Taxes & MI                                             (86)          (8)     +85
                                                                +60% QoQ
                                                                                                                                       Net Profit                                                1,070         +60      (23)

                                                                                                                      1,070            Net profit – excluding
                                                                       +85             +84              +7                             Magnati-related capital gains
                                                                                                                                                                                                 1,070         +60      +70
    670                    +60                    +163
                                                                                                                                       Basic EPS (adjusted2)                                      0.09         +54       ​68​
                                                                                                                                       (in USD; annualised)

                                                                                                                                                                                                    %          bps      bps
 Q4'22 NPAT            Net interest          Non-interest        Operating Costs   Impairment    Taxes & Minority   Q1'23 NPAT         RoTE2                                                      18.5         +745     +720
                         income                income                              charges,net       Interest                          RoRWA2                                                      2.8         +111     +118
     Gain on sale of stake in subsidiary                                                                                         1 Total income includes USD 0.8Bn gain on sale of stake in Magnati in Q1’22
     Net profit (excluding Magnati-related capital gains)                                                                        2 Excluding Magnati-related capital gains in Q1’22

May 2023 Debt Investor Presentation                                                                                                                                                                                              19
Sustained business momentum with solid operating performance across
business segments and product lines

                                               Operating income bridge              (USD Mn)
                                                                                                                                       Net interest income bridge (USD Mn)                                Non-interest income bridge (USD Mn)
                                                      +51% YoY
                                                                                                                                                       YoY ↑41%                                                           YoY ↑74%

                                                                                               +214             1,832                           +200              +5      +93     1,205                                                       +122     627
                                         +183                               +10                                                853
                                                                                                                                         +101                                                               +136            +23        +4
                       +237                                                                                                                              (48)                                     360
   1,214                                                  (26)                                                                                                                                                     (18)

                      ↑49%               ↑66%            ↓10%              ↑15%            ↑150%

                                                                                                                               Q1'22      IB    CCB      CB       GPB     HO      Q1'23           Q1'22      IB    CCB      CB        GPB      HO     Q1'23

                                                                                                                                                                                                                                  Quarterly trend
Q1'22 Operating      Investment        Corporate &   Consumer Banking   Global Private     Head Office     Q1'23 Operating      in USD Mn                               Q1’23         QoQ%                  YoY%
                                                                                                                                                                                                                                  (last 5 quarters)
    Income             Banking         Commercial                          Banking                             Income
                                         Banking
                                                                                                                                Operating Income                        ​1,832​           14                 51

                                                                                                                                IB                                       ​723​            (6)                49
                                                     Dec'22      Mar'23                                             (USD Bn)
                                                                                                                                CCB                                      ​458​             ​11​              66
          IB                           CCB                     CB                        GPB                    Int’l
                                                                                                                                CB                                       219              ​(4)​             (10)
   ↑2%         ↑14%           ↑4%            ↑2%          ↔         ↑10%           ↔       ↑10%            ↔            ↑27%
                                                                                                                                GPB                                       75               1                 15
               140
                                  44                                                                                     52
                                              38                                                                                HO*                                      ​358             180               150
                                                                     19
                                                          14                                               23
    57                                                                              8          8
                                                                                                                                UAE                                     ​1,412​           ​23​              ​50​
                                                                                                                                International                            421              (10)              55
 Loans    Deposits            Loans Deposits           Loans Deposits           Loans Deposits           Loans Deposits

May 2023 Debt Investor Presentation                                                                                                                                                                                                                           20
Solid balance sheet fundamentals supported by a strong liquidity position
  and healthy loan growth
                                                                                                Loans (net) increased 3% Ytd (USD 4Bn) driven by sustained demand from our core clients across the corporate
                              Asset Mix - Dec’22      +7%QoQ               Asset Mix - Mar’23             & private sectors, and growth in trade finance lending, partially offset by GRE repayments
                                 USD 302Bn          (∆ in USD Bn)             USD 323Bn
                                                                                                                                                Movement in Gross Loans by Counterparty
                                                                                                    ↑4%                      ↔                                                                       (USD Bn)

     Cash & CB Balances               21%                            +21          26%                                                                                                 +2       +0
                                                                                                                                                          +1                +3
     Due from Banks &                  6%                                                        102     105                                                                                           135
     Reverse Repos                                  (3)                            7%                                                            131               (1)

     Investments
                                     19%                    +1                   18%
                                                                                                                       23      23                                         +4Bn
     Loans, advances &               41%                     +4                 40%
     Islamic financing                                                                                 UAE              International           Dec'22    Govt     GREs    Banks     Corp/ Personal/ Mar'23
                                                                                                                                                                                   Pvt Sector Retail
     Other Assets                     11%           (2)                           10%                        Dec'22   Mar'23

                                                                                                Customer deposits added USD 22Bn (+11% Ytd) underlining franchise strength, and our superior credit rating
                                                                                                                      of AA- or equivalent as one of the safest banks in the world

     Customer Deposits
                                     70%                       +22               73%
                                                                                                   ↑7%                    ↑27%                  Movement in Deposits by Counterparty                 (USD Bn)
                                   of liabilities                              of liabilities
     Of which:                                                                                                                                                                        +1
                                                                                                     160                                                   +3               +20
     CASA                        42% of deposits              +5             40% of deposits     150                                                                                           (1)     213
                                                                                                                                                 191               (1)

                                                                                                                        41
                                                                                                                               52
     Liquidity Coverage                                                                                                                                                   +22Bn
     Ratio1 (LCR)                   154%                                        151%
                                                                                                       UAE             International            Dec'22    Govt     GREs   Corp/Pvt Personal/   CDs   Mar'23
                                                                                                                                                                           Sector    Retail
                                                                                                             Dec'22   Mar'23
1 Minimum regulatory LCR requirement is 100%

  May 2023 Debt Investor Presentation                                                                                                                                                                           21
A well-diversified, high quality loan book

                                                                                                                                                                                                                 Figures in USD Bn
                                                  Gross loans trend                                                                                Gross loans by counterparty
                                                  QoQ ↑3%, YoY ↑9%,
                                                                                                                                                                130.6                             134.5
                       Trade-related

                                                                                                                                                                 16%                              16%
                                         130.1          131.9         130.6               134.5                                    Personal/ Retail
                   123.3
                                                                                                                                   Corporate/ Private
                                                                                                                                                                 52%                              52%
                                                                                                                                   Banks
                                                                                                                                                                  1%                                3%
                                                                                                                                   Public Sector
                     9.3                  8.2            9.9            9.2                11.8                                                                  19%                              17%
                                                                                                                                   Government                    12%                              12%
                   Mar'22                Jun'22         Sep'22        Dec'22              Mar'23                                                                Dec'22                         Mar'23

                 Net loans by geography1                                                  Gross loans by product                                              Gross loans by economic sector
                                                                                                                                          Manufacturing     Construction
                                                     128.8                                                         134.5                                        2%
                           125.1                                                              130.6                                           4%
                                                                                                                                                                              Real Estate 2
                                                       1%                                                                                                                                                 QoQ Loan growth
                            1% 3%                         3%                                                                       Agriculture                                   18%
      America                                          5%                                          1%              0.4%
                                                                                                                                               Energy
                            6%                                        Vehicle financing                                               0.6%                                                                driven by:
                               3%                      5%
                                                          4%
                                                                                                    6%
                                                                                                       1%             6% 1%                      7%                                  Trading
                            6%                                        loans                                              9%
      MENA (ex-                                                                                        7%                                                                              5%                 •   Banks +2Bn
                                                                      Credit Cards                  4%                4%
      GCC)                                                                                                                    Personal - Retail
                                                                                                                                 Mortgage
                                                                                                                                                                                                              (+117%)
      Europe                                                          Personal Loans                                                6%                                                  Transport and
                                                                                                                                                           USD 134.5Bn
      Asia                                                                                                                                                   Mar’23
                                                                                                                                                                                      communication 8%    •   Government +1Bn
                            81%                       82%             Trade related loans          81%              80%                                                               Banks                   (+5%)
                                                                                                                              Personal - Loans &                                       3%
      GCC                                                             Overdrafts                                                 Credit Cards
                                                                                                                                    10%
      UAE                                                             Term Loans                                                                                                  Other financial
                                                                                                                                          Government 12%
                                                                                                                                                                                 institutions 16%
                           Dec'22                    Mar'23                                       Dec'22           Mar'23                                  Services 8%
1 Based on loan origination / coverage                                                                                              2 Real Estate by geography: Abu Dhabi 43%, Dubai 24%, Other
                                                                                                                                      UAE 2%, UK 18%, Other Intl 12%
May 2023 Debt Investor Presentation                                                                                                                                                                                                  22
Increase in NII driven by growth in business volumes and higher interest
rates

                                 Net interest income                (USD Bn)                      • Increase in NII by 5% qoq and 41% yoy was driven by growth in                                  Performing loan yields (%)
                                                                                                    business volumes and margin improvements from effective balance                                     Quarterly                  YTD
                               QoQ ↑5%, YoY ↑41%                                                    sheet positioning in a higher rate environment1,2

                                                                                                  • Group NIM improved +11bps YoY emphasising the benefits from                                                                          5.68
                                                                               1.2                  higher interest rates. This was partially offset by the dilutive impact                                                 5.02
                                                             1.1
                                           1.0                                                      of the significant increase in cash and central bank placements as the                                          4.15
       0.9               0.9                                                                        Group’s liquidity is efficiently deployed
                                                                                                                                                                                                      3.24
                                                                                                                                                                                          2.85                              3.86
                                                                                                                                                                                                                    3.44
                                                                                                                                                                                                         3.05

                                                                                                                                                                                          Q1'22      Q2'22      Q3'22      Q4'22        Q1'23
     Q1'22             Q2'22             Q3'22             Q4'22             Q1'23

                                                                                                Average balances of short-term DFB and CB placements increased by USD 51Bn YoY and
                                 Net interest margin (%)                                        USD 15Bn Ytd as a consequence of sizeable growth in avg deposits in Q1’23. Average DFB            Cost of customer deposits (%)
                                                                                                and CB placements together represent 38% of avg Interest Earnings Assets as of Mar-end
                               Quarterly                             YTD
                                                                                                2023 vs. 35% as of Dec-end 2022 and 27% as of Mar-end 2022, which had a dilutive impact                Quarterly                  YTD
                                                                                                on the calculated NIM
                                                                                1.65
                                                              1.63                                                                                                                                                                      3.20
                                                                                                                27%                35%          38%           Due from CB/Banks &
                          1.57                                                 1.65                             22%                                           Reverse Repos                                                2.69             3.20
        1.54                                                                                    Int Earnings                       19%          18%
                                            1.50                                                                                                              Investments
                                                                                                   Assets       51%                46%          44%                                                             1.83
                          1.55                               1.56
                                                                                                                                                              Performing loans
                                            1.53                                                Int Bearing                                                                                           0.86                   1.55
                                                                                                                83%                85%          85%                                        0.47
                                                                                                 Liabilities
                                                                                                                                                              Customer deposits + MTB                              1.10
                                                                                                                                                                                                       0.67
      Q1'22             Q2'22              Q3'22            Q4'22              Q1'23                           Mar'22            Dec'22        Mar'23                                     Q1'22      Q2'22      Q3'22      Q4'22        Q1'23

Note: All percentage figures are annualised
1 For further details, please refer to Market Risk note #46(c) of FY’22 financial statements
2 P&L impact from a +25bps parallel movement in interest rates is estimated at c. USD 93Mn, if no offsetting action is taken by management

May 2023 Debt Investor Presentation                                                                                                                                                                                                                23
Strength in fee-based businesses, significantly higher FX gains and a healthy
sales & trading performance, drive non-interest income growth

                                                                                                                            Fees & commissions, net              (USD Mn)
   Non-interest income                           Q1’23         Q4’22       QoQ%    Q1’22      YoY%               Loan-related              Trade-related                    Other
   (In USD Mn)

                                                                                                                                      QoQ ↑15%, YoY ↑1%
   Non-interest income                           ​627​         ​464​        ​35​   ​360​         ​74​
                                                                                                          211                                                                          213
   Fees & commissions, net                       213           186          15     ​211            1                     190                                     186
                                                                                                           36
                                                                                                                                           170
                                                                                                                          38                                                            56
                                                                                                                                            26                    32
   FX and other investment                                                                                 57
                                                 ​395​         ​392​         ​1​   ​127       212                         57                57                    55                    57
   income, net
                                                                                                          118             95                                      99                   101
                                                                                                                                            87
   Other non-interest income                      18           (115)        na      23        (19)

   % of Group operating income                   34%           ​29%​               30%                   Q1'22          Q2'22              Q3'22                 Q4'22               Q1'23

                                   Non-interest income trend           (USD Mn)                                     Fee & commissions bridge by business segment                    (USD Mn)

        Non-interest income (USD Mn)         QoQ ↑35%, YoY ↑74%                                                                        +15% QoQ
         % of Group operating income

            30%                        32%               34%                29%            34%
                                                                                                        186                     +20         +5             +3                           213
                                                                                           627                    +5                                                        (4)
                                                         501                464
                                       432
           360

          Q1'22                   Q2'22             Q3'22                  Q4'22           Q1'23        Q4'22     IB            CCB         CB             GPB              HO         Q1'23
May 2023 Debt Investor Presentation                                                                                                                                                            24
C/I ratio improvement reflects revenue growth and cost discipline amidst
continued investments to support business growth

                                     Operating expenses trend (USD Mn) and C/I ratio (%)                                                          Opex drivers YoY (USD Mn)

 C/I ratio1 33.2                          31.2                                33.4
                                                           28.7                              25.1                                                          +11% YoY

                                                QoQ ↓16%, YoY ↑11%
                                                                                                                                                                                      +15     460
                                                                                                                                                                 +8
                                                                             545                                                         +24
                                                                                            460
                413                       433              436                                                    413
                                                                              75
                                           68               73                               78
                   74                                                        238
                                          156              152                              146
                127

                211                       209              211               232            235

                Q1'22                    Q2'22             Q3'22            Q4'22           Q1'23
                                                                                                                 Q1'22              Staff-related       Systems-related           Other G&A   Q1'23
                                                                                                                                                        (incl Depreciation &
                  Staff costs            Other G&A costs      Depreciation & Amortisation                                                                  Amortisation)2

1 Excluding Magnati-related capital gains in 2022                                                   2 Systems-related costs includes IT projects and costs for other strategic initiatives

 May 2023 Debt Investor Presentation                                                                                                                                                                  25
Healthy asset quality metrics with stable NPL ratio, adequate provision
buffers

                                     Impairment charges, net (USD Mn) & CoR1 (%)                                                                                                             NPLs2 and ECLs3 (%)

                           Net impairment charges                                       CoR (L&A) (bps)                                                                          Provision Coverage (%)                   NPL Ratio (%)
                                                                                                                                                                               NPLs (USD Bn)                       Provisions (USD Bn)

                                                                                               86                                                                102             100                    103                 98                  101
                                                                    60                                                    62
             42                          52

                                                                                                                                                                 3.8             3.6                                       3.9                  3.8
                                                                                                                                                                                                        3.4
                                               QoQ ↓28%, YoY ↑74%

                                                                                                                                                                                                                    5.0                   5.0    5.1
                                                                                                                                                                                                                             5.0
                                                                                                                                                               4.6       4.7   4.6     4.5                4.6
                                                                                                                                                                                                  4.4

                                                                                          301

                                                                189                                                 217
                                      158
            125

           Q1'22                     Q2'22                     Q3'22                     Q4'22                     Q1'23                                             Mar'22     Jun'22              Sep'22            Dec'22               Mar'23

1 Annualised
2 NPLs = Stage 3 exposure + adjusted POCI (Purchase or originally impaired credit) of USD 1,050Mn as of Mar’23 considered as par to NPLs, net of IIS
3 ECL = ECL on loans, advances & Islamic financing + ECL on unfunded exposures + IFRS9 impairment reserves
Note: Gross loans and advances and NPLs are net of interest in suspense; see Note 30 ‘Credit risk’ in Q1’23 financials for more details on IFRS9 exposures and ECL

May 2023 Debt Investor Presentation                                                                                                                                                                                                                    26
Healthy asset quality and adequate provision buffers

NPLs1 by segment                                                                                                                                                         NPLs1 by sector (%)
                                                                                                                                           (USD Bn)
                                     Corporate (IB + CCB)                                       Retail (CB + GPB)
                 5.3%                          5.5%                          5.5%                          5.3%                         5.4%
                                                                                                                                                                                                                                                             Real Estate & Construction, 45%
   NPL
   ratio             3.4%
                                               3.1%                          3.0%                          3.6%                         3.5%                                            Manufacturing, 3%

                   4.6                          4.6                           4.4                           5.0                           5.0                                                    Energy, 5%                           USD 5.0Bn
                                                                                                           24%                           24%                                                                                           Mar’23
                  27%                           27%                           27%                                                                                                                 Others, 3%
                                                                                                           76%                           76%                                                                                                                   Trading, 16%
                  73%                           73%                           73%

                                                                                                                                                                                               Loan to Individuals, 24%
                Mar'22                        Jun'22                        Sep'22                       Dec'22                        Mar'23                                                                                                           Transport & Communication, 1%
                                                                                                                                                                                                                                                  Services, 3%

Loans by stage                                                                                                                                                           ECL2 by stage
                                                                                                                                         (USD Bn)                                                                                                                                      (USD Bn)
    USD 132.7Bn                                                                                                                  as of Mar’23                                     USD 5.1Bn                                                                                      as of Mar23
   (Gross loans net of IIS)

                                                                                                                           Ratio % of gross loans
                                                      Mar'23                   Dec'22
                                                                                                                                      (net of IIS)1

                                                                                                 124.0                                                                                                                                                                               Mar'23
       Stage 1                                                                                                                              93.4%                            Stage 1              0.5
                                                                                                120.2                                                                                            0.5                                                                                 Dec'22

                         3.7                                                                                                                  2.8%                      Adj Stage 2                                     1.4
  Adj Stage 2                                                                                                                                                                                                           1.4
                          3.6

     Stage 3 +             5.0                                                                                                                                             Stage 3 +                                                                    3.2
                                                                                                                                              3.8%                         Adj POCI                                                                    3.1
     Adj POCI              5.0

1 NPLs = Stage 3 exposure + adjusted POCI (Purchase or originally impaired credit) of USD 1,058Mn as of Mar’23 considered as par to NPLs, net of IIS; Stage 3+POCI, net of IIS as per Note #30 in Q1’23 financials is USD 5.1Bn;
  Adj Stage 2 incl POCI not considered as NPLs (USD 32Mn)
2 ECL = ECL on loans, advances and Islamic financing (3.9bn) + ECL on unfunded exposures (0.3Bn) + IFRS9 impairment reserve (0.9Bn), IFRS9 specific reserve incl in Stage3 (0.3Bn), IFRS9 collective reserve incl in Stage2 (0.6Bn)
Note: Gross loans, advances & Islamic financing and NPLs are net of interest in suspense; see Note #30 Credit Risk in Q1’23 financials for more details on IFRS9 exposures and ECL

May 2023 Debt Investor Presentation                                                                                                                                                                                                                                                               27
Capital, funding &
liquidity

                     28
Strong capital generation and RWA discipline

                                                                     CET11 ratio progression                                                                                               RoRWA4 (%ytd) and RWAs (USD Bn)

                                                                                                                                                                               3.6
                                                                                                                                                                                             2.8                2.5                           2.8
                                                                                                                                                                                                                              2.3
                                                               Cash DPS:
                                                                USD 0.14                                                                                                                        595
                                                                                                                                                                                583                              584             572          568
                                                              USD 1.57Bn
                                                                                                                                                                                 6%              5%              6%
                                                                                      +69bps               +9bps              -21bps                                             9%              10%             8%
                                                                                                                                                                                                                                  6%           6%
                                                                                                                                                                                                                                  7%           7%
                                                                   1.00%
                                                                                                      • RWA                • Adverse
      13.0%                                   13.1%                                                     optimisation         movement in
                                                                                                                                                 13.2%                          85%             85%             86%              87%          87%
                          12.6%                                   12.6%                                 initiatives          foreign currency
                                                                                                        partly offset by     translation
                                                                                                        balance sheet        reserve
                                                                                                        growth             • Payment on Tier 1                                Mar'22           Jun'22          Sep'22          Dec'22     Mar'23
                                                                                                                             capital notes                Basel III
                                                                                                                                                          regulatory
                                                                                                                                                          minimum: 11%                       Credit           Market            Operational

                                                                                                        +57bps
                                                                                                                                                                          RWA Movements Ytd’22                                Movement
                                                                                                                                                                                                                 Dec’22                       Mar’23
                                                                                                                                                                          (USD Bn)                                             (USD Bn)

                                                                                                                                                                          Credit RWA3                              135           (0.2)         135
       Mar'22               Jun'22              Sep'22              Dec'22         Q1'23 profits Change in RWA                Other              Mar'23                   Market RWA                               12            (0.8)          11
                                                                                                                            movements
                                                                                                                                                                          Operational RWA                             9             -               9

                                                                                                                                                                          Total RWA                                156            (1.1)         155

1 Minimum CET1, Tier 1 and CAR requirement by CBUAE - 11%, 12.5% & 14.5%, respectively                                                                                   3 Credit RWA includes Basel III CVA Risk (CV1) w.e.f. Jun’22
2 Capital ratios remain well above regulatory requirements; Tier 1 and CAR ratios at 15.1% and 16.2%, respectively                                                       4 Including Magnati-related capital gains in 2022

May 2023 Debt Investor Presentation                                                                                                                                                                                                                     29
High-quality and diversified investment portfolio

Investments by type                                                                                                                             Investments by ratings

                                                                                                                Mar’23 Dec’22                       Mar’23                                            Mar’23 Dec’22
                                                                                                                                                    USD 57.0Bn                    AAA                  24%    24%
     Mar’23                                                                     FVTPL - Debt                      17%     14%
     USD 57.0Bn                                                                                                                                                                   AA                   26%    23%
                                                                                                                                                     Dec’22
                                                                                FVTPL - Equity & Funds            2%       2%                        USD 56.0Bn                   A                    25%    26%
                                                                                Amortised Cost (Debt Inv)         2%       2%                                                     BBB                  7%     7%
      Dec’22                                                                                                                                     • 75% rated A and above
      USD 56.0Bn                                                                FVOCI - Equity                                                                                    BB & below           13%    16%
                                                                                                                  1%       1%
                                                                                                                                                 • 82% investment grade and
                                                                                                                                                   above                          Unrated - Debt       2%     1%
                                                                                FVOCI - Debt
                                                                                                                  78%     81%
                                                                                                                                                 • 95% of BB & below are          Equity & Funds       3%     3%
                                                                                                                                                   Sovereign & GREs

Investments by geography                                                                                                                        Investments by counterparty

                                                                                                                Mar’23 Dec’22                                                                         Mar’23 Dec’22

     Mar’23                                                                           Europe                      13%     13%                                  Mar’23         Sovereign                73%    72%
     USD 57.0Bn                                                                       GCC                         10%     10%                                  USD 57.0Bn
                                                                                                                                                                              GREs                     7%     7%
                                                                                      MENA (ex-GCC)               9%      11%
                                                                                                                                                                              Covered Bonds            1%     1%
                                                                                      USA                         17%     17%                                                 (Banks & FIs)
      Dec’22                                                                                                                                                   Dec’22         Banks                    11%    13%
      USD 56.0Bn                                                                      Others incl A&NZ            1%       1%                                  USD 56.0Bn
                                                                                                                                                                              Corporate/ Pvt Sector    7%     6%
                                                                                      Asia                        23%     22%
                                                                                                                                                                              Supranational            0%     1%
                                                                                      UAE                         26%     25%

FVTPL – Fair value through profit or loss (previously HFT), Amortised cost – previously HTM, FVOCI – Fair value through other comprehensive income (previously AFS)
Sovereign bonds include sovereign guaranteed bonds issued by GREs, banks & FIs
Note: All totals are Gross investments before ECL (0.2Mn as of Mar’23)

May 2023 Debt Investor Presentation                                                                                                                                                                                   30
Strong deposit inflows in Q1’23 underline franchise strength and superior
credit ratings
Customer deposits trend                                                                              Customer deposits by counterparty

                                       QoQ ↑11%, YoY ↑30%
                                                                                                                                             190.8               212.5
                                Total Customer Deposits          CASA
                                                                                                            Certificates of deposits
                                                                                                                                               5%                    4%
                                                                                       212.5                                                  14%                    13%
                                                  203.1          190.8                                      Personal/retail sector
         163.4                 176.5
                                                                                                                                              36%                    42%
                                                                                                            Corporate / private sector
                                                                                                                                              12%                    11%
                                                                                                            Public Sector
          84.4    52%                  45%         81.8    40%              42%        85.9    40%                                            32%                    30%
                               79.4                               80.9                                      Government sector

        Mar'22                Jun'22              Sep'22         Dec'22            Mar'23                                                    Dec'22             Mar'23

Customer deposits by account type                                                                    Customer deposits by geography

                                                   190.8                  212.5
                                                                                                                                       UAE
                                                                                                                                       75%
            Margin Accounts                        0.3%                   0.3%                                                                                   GCC 3%
                                             5%                   4%              2%
                                                           2%
            Certificates of deposits                                                                                                                                 Asia 1%
                                                   40%                    38%
                                                                                                                                             USD 212.5Bn              Europe
            Saving Accounts                                                                                                                    Mar’23                   9%

            Current Accounts                                                                                                                                     MENA (ex-GCC)
                                                   52%                    55%
                                                                                                                                                                     3%
            Notice and time deposits
                                                                                                                                                           America
                                                  Dec'22                 Mar'23                                                                              9%

May 2023 Debt Investor Presentation                                                                                                                                              31
Leading issuer in the MENA region

                         Liability mix                                                                                        Medium-term wholesale funding

  Customer                               Term Borrowings & Sub                                     Issuances1                                          Maturities1                                (USD Mn)
  Deposits,                                    Debt, 6%
    73%
                                                Others, 9%
                                                                                                                                                    5,073                                              USD
                    USD 292.2Bn                                                                  4,704
                      Mar’23                   Due to Banks &                        4,398
                                                                                                                                                               3,948                                   CNH
                                                 Repos, 9%                                                                                 3,613
                                                                                                            2,899                                                         3,011                        GBP
                                         Commercial Paper, 3%                                                                                                                         2,663
                                                                                                                                                                                                       CHF
                                                                                                                    1,100       1,004                                                                  EUR

                                                                                                                                                                                                       Other
  Cash & AAA/AA bonds vs. ST wholesale3
                                                                                     2020        2021       2022     2023       2023       2024     2025        2026       2027   2028 & beyond

                                                  (USD Bn)                        Ytd 2023 highlights:
           111                                   CDs & CPs
                                                                               • Raised USD 1.1Bn equivalent of senior wholesale funding
            28
                                                 DTB & Repos                   • Opened the Sukuk market globally with a USD 500Mn 5-year Sukuk
                               44
            83                                                                 • Second USD conventional bond issued within 3 months (USD 600Mn 5.25 year)
                                17               AAA & AA bonds
                                27                                             • Regional leader in the Green Bond market with over USD 2.25Bn of Green Bond notional outstanding across
       Cash &             ST Wholesale           Cash & Bal with
                                                                                 13 transactions and 5 currencies
    AAA/AA bonds             Funding             CBs

1 All figures based on historical FX with the maturity of callable bonds set at next call date

May 2023 Debt Investor Presentation                                                                                                                                                                            32
Diversified Term Funding portfolio

                         Term Funding Portfolio by Type1                                                                             Term Funding Portfolio by Currency1

                                                                     Asian Currency                       Other
                                                                      ex-Formosa                                                          PP
                                                                                                           6%
                                                                          10%                                                            17%
                                        Formosa
                                         Bullet                                                               EUR
                                                                                                                                                           Callable
                                          12%                                                                 9%
                                                                            USD Bullet Private          CHF                                                 33%
                                                                               Placement                                  Conventional Public
                                                                                                        8%                      11%
                                                                                  11%            GBP                USD
                             USD Public
                                                          European                               5%                 63%
                               24%
                                                          Currency
                                                            22%                                   CNH
                                                                                                                                 Formosa FRN           Sukuk Public
                                        Callables incl-                                            9%
                                                                                                                                     11%                  28%
                                          Formosa
                                             21%

•       Diversified investor base spanning Asia, the Middle East and Europe

•       Active issuer across multiple currencies with USD 1Bn equivalent or greater outstanding across both public and private placements in each of USD, CNH, CHF and EUR

•       Source and maturity profile of USD denominated debt spread across multiple products

1. All figures based on historical FX

May 2023 Debt Investor Presentation                                                                                                                                          33
Leader in MENA Green Bond Issuance
   Highlights:
                                                                                                                                                                  FAB Green Bonds Outstanding            (as of 31 Mar’23)
• In 2022, FAB’s Sustainable Finance Framework was updated to further align with market best practices and
  to expand the scope of financial products.                                                                                                               CHF Public
                                                                                                                                                                                              HKD PP
                                                                                                                                                                                                4%
                                                                                                                                                             32%                                       USD Private
• The framework was developed to align with market best practice requirements reflected in the
                                                                                                                                                                                                          5%
  International Capital Markets Association’s (ICMA); Green Bond Principles, Social Bond Principles and the
                                                                                                                                                                                                       CNH Private
  Sustainability Bond Guidelines                                                                                                                                                                          3%

• A Group wide sustainability strategy and roadmap covering all ESG topics was developed in 2021 with ESG
  criteria to be incorporated into FAB Group’s Balance Score Card from 2022.
• FAB Green Bonds outstanding exceed USD 2.25Bn (equivalent), across 13 issuances and 5 different                                                                                               EUR Public
  currencies.                                                                                                                                                  USD Public
                                                                                                                                                                                                  25%
                                                                                                                                                                 31%
          • CHF 260Mn Fixed Rate Public Bond due 2027 – largest ever CHF denominated Green Bond issued
            by a foreign FI
          • HKD 750Mn Fixed Rate Private Placement due 2025 – first ever HKD denominated Green Bond                                                               FAB Green Bonds Asset Geography              (as of 31 Mar’23)
            issued by a foreign FI
          • CNH 406Mn Fixed Rate Private Placements across 3 transactions due 2025/26 – including first CNH
            denominated Green Bond from a CEEMA Financial Institution or the MENA region
                                                                                                                                                                                                           USA
          • USD 90Mn FRN Private Placements across 3 transactions – including first ever Green Bond Private                                                                                                30%
            Placement by a MENA issuer
          • CHF 400Mn Fixed Rate Public Bonds across 2 transactions due 2026
                                                                                                                                                               UAE
          • USD 30Mn Fixed Rate Private Placement due 2026                                                                                                     54%

          • EUR 500Mn Fixed Rate Public Bond due 2027 – first ever EUR denominated Green Bond from
            MENA region                                                                                                                                                                           France
                                                                                                                                                                                                   15%
          • USD 700Mn Fixed Rate Public Bond due 2027 – largest ever Green Bond from a MENA bank                                                                                 Uzbekistan
                                                                                                                                                                                    1%

Note: FAB’s annual Green Bond/Sustainable Finance reports can be accessed on our website: https://www.bankfab.com/en-ae/about-fab/sustainability/reports

May 2023 Debt Investor Presentation                                                                                                                                                                                                34
Wrap-up and financial guidance

 ▪ Q1’23 performance represents strong start to the
      year                                                              2023e financial guidance   Q1’23 actual

 ▪ The Group operates on solid balance sheet
                                                       Loan growth           Mid single-digit        +3% ytd
      fundamentals

 ▪ We delivered good progress against our growth       Cost of Risk             < 80bps               62bps
                                                       (CoR)
      strategy in the first quarter

                                                       Provision
                                                                                 > 90%                101%
 ▪ FAB is uniquely positioned to drive sustainable     coverage ratio
      growth and returns while shaping the future of
      banking in the UAE and the broader region        CET1                      >13.5%               13.2%
                                                       (pre-dividend)

May 2023 Debt Investor Presentation                                                                               35
Supplementary
financial slides

                   36
A strong financial track record
Balance Sheet & Income Statement

                            TOTAL ASSETS (USD Bn)                                                                     LOANS & ADVANCES (USD Bn)                                 CUSTOMER DEPOSITS (USD Bn)

                                                                             CAGR                                                                              CAGR                                                CAGR

       Mar'23                                                   322.7                              Mar'23                                        128.8                 Mar'23                           212.5
       Dec'22                               302.2                                                  Dec'22                                     125.1                    Dec'22                        190.7
       Dec'21                            272.6                                                     Dec'21                                 111.5                        Dec'21                   167.3
       Dec'20                        250.2                                    12%                  Dec'20                              105.3                    7%     Dec'20                 147.3                14%
       Dec'19                   223.8                                                              Dec'19                                111.1                         Dec'19                141.3
       Dec'18               202.5                                                                  Dec'18                           96.1                               Dec'18             126.7
       Dec'17           182.1                                                                      Dec'17                        90.0                                  Dec'17          107.8

                         TANGIBLE EQUITY1,2 (USD Bn)                                                                    OPERATING INCOME (USD Bn)                                     NET PROFIT (USD Bn)

                                                                             CAGR

         Mar'23                                          22.1                                    Q1'23               1.8                                              Q1'23     1.1
         Dec'22                                            22.9                                  FY'22                                                   6.5          FY'22                                  3.7
         Dec'21                                           22.2                                   FY'21                                             5.9                FY'21                             3.4
         Dec'20                                       21.4                     3%                FY'20                                      5.1                       FY'20                      2.9
         Dec'19                                      21.1                                        FY'19                                        5.5                     FY'19                             3.4
         Dec'18                             19.4                                                 FY'18                                       5.3                      FY'18                            3.3
         Dec'17                             19.3                                                 FY'17                                       5.3                      FY'17                       3.0

1 Post-dividend; Tangible equity = Total equity less minority interest, Tier 1 capital notes and intangible assets
2 Dividends of USD 0.14 fils/share equivalent for FY’22 were approved by shareholders at the General Assembly Meeting on 28 February 2023

May 2023 Debt Investor Presentation                                                                                                                                                                                       37
A strong financial track record (continued)
Key ratios

                                                                                                                                                                                   COST-TO-INCOME RATIO - YTD (%)
                 NIM - YTD (%)                                                        NPL RATIO1 (%)                                    PROVISION COVERAGE1 (%)                       (EX-INTEGRATION   COSTS,   EX-MAGNATI   GAINS)

  2.5     2.4                                                                                   4.0      4.0     3.9      3.8     120                                                                                    31.6
                   2.1                                                                                                                   110                 101           101     27.7 25.8 26.7 27.0 26.4
                           1.8                                         3.1      3.2     3.2                                                     93     95            98                                                         25.1
                                   1.5      1.6     1.7

 FY'17 FY'18 FY'19 FY'20 FY'21 FY'22 Q1'23                           Dec'17 Dec'18 Dec'19 Dec'20 Dec'21 Dec'22 Q1'23             Dec'17 Dec'18 Dec'19 Dec'20 Dec'21 Dec'22 Q1'23   FY'17 FY'18 FY'19 FY'20 FY'21 FY'22 Q1'23

NON-INT INC / OPERATING INCOME (%)                                                CET1 & CAR2 (%)                                              ROTE3 - YTD (%)                                  RORWA - YTD (%)

                                                                                           CET1              CAR

                                  46                                    16.2 15.7 16.9 16.5 15.4 15.6 16.2                                                                 18.6                                                    2.8
                                                                                                                                        16.2   16.1                 15.7                  2.5    2.6
                 37                                                                                                              14.6                        15.2                  2.3                    2.1      2.3    2.3
 33      33               34              31      34                                                                                                  13.0

                                                                        12.8 12.4 13.5 13.3 12.4 12.6 13.2

FY'17 FY'18 FY'19 FY'20 FY'21 FY'22 Q1'23                              Dec'17 Dec'18 Dec'19 Dec'20 Dec'21 Dec'22 Q1'23           FY'17 FY'18 FY'19 FY'20 FY'21 FY'22 Q1'23         FY'17 FY'18 FY'19 FY'20 FY'21 FY'22 Q1'23

1 2017 figures are pre-IFRS9 implementation
2 Capital ratios are post dividend as per UAE CB’s Basel III framework
3 Return on Average Tangible Equity, annualised; based on attributable profit to equity shareholders' excl Tier 1 notes coupon
Ratios annualised, based on actual/365 day count, where relevant

May 2023 Debt Investor Presentation                                                                                                                                                                                                      38
Business segments overview – IB & CCB

                                                                                            Investment Banking (IB)
Key highlights                                                                                                                                              USD Mn                             Q1’23      QoQ%         YoY%
• Outstanding performance across all product lines, with   Quarterly operating income trend (USD Bn)                Loans & Deposits (USD Bn)               Operating Income                    723         (6)         49
  revenue +49% yoy to USD 0.7Bn driven by 33% growth                                                              Loans: QoQ ↑2%, YoY ↔
  in NII and +78% growth in non-interest income                             QoQ ↓6, YoY ↑49%                      Deposits: QoQ ↑14%, YoY ↑50%              Costs                               (122)       (3)         15
• NII grew 33% yoy driven by strong deal pipeline                                                                  Loans     Deposits                       Operating Profit                    601         (6)         59
                                                                     NII          Non-interest income
  execution and higher interest rates. Non-interest
                                                                                                                                                            Impairment charges, net             (31)       (21)        (35)
  income grew 78% on the back of continued strength in                                                                                                140
  fee-based businesses, a strong sales and trading                                           0.8           0.7                       123                    Taxes                               (24)        13          42
  performance, and increased client flow activity                    0.6          0.6                                   94
                                                            0.5                                                                                             Profit after taxes                  545         (6)         74
                                                                                             43%          43%
• Strong liquidity position with net loans +2% ytd, and                          52%
                                                                                                                   57           56               57
                                                           36%      45%
  customer deposits +14% ytd. CASA balances grew USD                                                                                                        CI Ratio                           16.9%      51bps      (504)bps
                                                           64%      55%                      57%          57%
  5Bn ytd to USD 42Bn, helped by new client                                      48%
                                                                                                                                                            RoRWA                               2.7%     (12)bps     126bps
  relationships, and over 50 new cash management
  mandates won during the period                           Q1'22    Q2'22        Q3'22      Q4'22         Q1'23    Mar'22        Dec'22          Mar'23     Contribution to Group operating
                                                                                                                                                                                                39%      (823)bps    (55)bps
                                                                                                                                                            income

                                                                                Corporate and Commercial Banking (CCB)
Key highlights                                                                                                                                              USD Mn                            Q1’23      QoQ%         YoY%
                                                           Quarterly operating income trend (USD Bn)                 Loans & Deposits (USD Bn)
• Operating income grew 11% qoq and 67% yoy,                                                                                                                Operating Income                   458        11           66
  primarily driven by strong growth in NII in Global                                                              Loans: QoQ ↑4%, YoY ↑37%
                                                                           QoQ ↑11%, YoY ↑66%                                                               Costs                              (63)      (11)          (9)
  Transaction Banking benefitting from higher interest                                                            Deposits: QoQ ↑2%, YoY ↑1%
  rates, as well as robust business volumes                                                                        Loans     Deposits                       Operating Profit                   395        16           91
                                                                     NII            Non-interest income
• With the business focussed on providing value-added                                                                                                       Impairment charges, net           (141)      (21)          383
  services and enhancing cross-sales, non-interest                                                                              42               44
                                                                                                          0.5           37           37               38
  income rose 38% qoq, driven by higher fee-generation                                      0.4                    32                                       Taxes                              (5)       (14)          51
  on the back of increased lending and 125 new cash                 0.3          0.3
                                                            0.3                             18%           22%                                               Profit after taxes                 250        58           43
  management mandates, and as well as higher Global                 33%          22%
  Market FX and derivative sales                           42%                                            78%
                                                                                 78%        82%                                                             CI Ratio                          13.7%     (340)bps    (1,131)bps
                                                           58%      67%
• Loans increased by 4% qoq underlining continued                                                                                                           RoRWA                             2.6%       ​93​bps      ​52​bps
  demand from top-tier clients, while customer deposits    Q1'22   Q2'22        Q3'22      Q4'22        Q1'23      Mar'22        Dec'22          Mar'23     Contribution to Group operating
  grew 2% qoq                                                                                                                                                                                  25%      (64)bps      232bps
                                                                                                                                                            income

 May 2023 Debt Investor Presentation                                                                                                                                                                                            39
Business segments overview – CB & GPB

                                                                                                  Consumer Banking (CB)
Key highlights
                                                                                                                                                              USD Mn                            Q1’23    QoQ%       YoY%
• Customer deposits grew 10% ytd and 21% yoy, led by        Quarterly operating income trend (USD Bn)                  Loans & Deposits (USD Bn)
  USD 1Bn growth in CASA deposits, buoyed by recent                                                                                                           Operating Income                   219      (4)       (10)
                                                                                                                     Loans: QoQ ↔, YoY ↑4%
  wave of new IPOs as well as strategic focus and                                QoQ ↓4%, YoY ↓10%                   Deposits: QoQ ↑10%, YoY ↑21%             Costs                             (128)     (2)         5
  deliberate actions to grow primary relationships
                                                                           NII         Non-interest income             Loans    Deposits                      Operating Profit                   90       (6)       (26)
• Although net loans were broadly flat qoq, Islamic
  lending grew 20% yoy                                                                                                                                        Impairment charges, net            (30)     13         27
                                                                                                                                         18              19
• Q1’23 operating income was lower qoq and yoy                                                                             16                                 Taxes                              (0)     5,846       na
                                                             0.2           0.3         0.3                            14            14              14
  primarily due to lower net interest income, partially                                           0.2         0.2                                             Profit after taxes                 60      (14)       (39)
  offset by solid growth in fees and commissions led by      10%           15%         19%        19%         22%
  strong sales momentum and early benefits of increased                                                                                                       CI Ratio                          58.6%   104bps     851bps
                                                             90%           85%         81%       81%          78%
  process digitisation
                                                                                                                                                              RoRWA                             1.9%    (29)bps    (76)Bps
• Customer-initiated digital sales of CASA and credit
                                                            Q1'22         Q2'22       Q3'22      Q4'22       Q1'23    Mar'22        Dec'22          Mar'23    Contribution to Group operating
  cards grew more than 140% qoq, accounting for more                                                                                                                                             12%    (218)bps   (819)Bps
                                                                                                                                                              income
  than a third of total acquisitions

                                                                                              Global Private Banking (GPB)
Key highlights                                                                                                                                                USD Mn                            Q1’23    QoQ%       YoY%
                                                            Quarterly operating income trend (USD Mn)                  Loans & Deposits (USD Bn)
•    Operating income grew 1% qoq and 15% yoy to USD                                                                                                          Operating Income                   75        1         15
     75Mn, driven by higher fee income on the back of                            QoQ ↑1%, YoY ↑15%                   Loans: QoQ ↔, YoY ↓14%
                                                                                                                     Deposits: QoQ ↑10%, YoY ↑6%              Costs                              (33)      0         12
     asset management fees and a strong momentum in
     IPOs which saw record client participation for ADNOC           NII              Non-interest income               Loans    Deposits                      Operating Profit                   42        2         17
     Gas and Presight AI
                                                                                                                                                              Impairment charges, net            (5)      76         264
•    While net flows were positive, Assets Under                                       75         74          75       9
                                                             65            67                                              8         8     8        8    8    Taxes                              (4)     (19)        56
     Management (AUM) were stable sequentially, mainly
     due to volatile market conditions                                                 26%       23%         26%                                              Profit after taxes                 33       (2)         2
                                                             24%          25%
•    Customer deposits grew 10% qoq, reflecting FAB’s                                            77%
                                                             76%          75%          74%                   74%                                              CI Ratio                          43.6%   (32)Bps    (93)Bps
     superior credit profile and clients’ trust in the
     franchise, while loans were stable qoq                                                                                                                   RoRWA                             2.8%    (10)Bps     41Bps
                                                            Q1'22         Q2'22       Q3'22      Q4'22       Q1'23    Mar'22        Dec'22          Mar'23    Contribution to Group operating
                                                                                                                                                                                                 4%     (51)bps    (129)bps
                                                                                                                                                              income

    May 2023 Debt Investor Presentation                                                                                                                                                                                     40
International – financial overview

                                                                            International                                                                                           (USD Mn)                            Q1’23         QoQ%        YoY%

Key highlights
                                                                                                 Quarterly operating income trend (USD Bn)                                          Operating Income                     421           (10)        55
• FAB’s international franchise is a competitive
                                                                                                                  QoQ ↓10%, YoY ↑55%
  differentiator and a key contributor to Group liquidity
                                                                                                                                                                                    Costs                               (110)          (17)        (6)
• Customer deposits grew USD 11Bn during Q1’23 to
                                                                                                                                            0.5
  USD 52Bn, underlining franchise strength and superior                                                                                                      0.4
  credit ratings                                                                                                                                                                    Operating Profit                     311           (7)         101
                                                                                        0.3               0.3              0.3
• Net loans were broadly stable at USD 23 Bn1,
                                                                                                                                                                                    Impairment charges, net              (42)          (73)       (45)
  representing 18% of Group’s total loans

• Operating income improved 55% yoy in Q1’23 to                                        Q1'22             Q2'22            Q3'22            Q4'22            Q1'23                   Taxes                                (69)          (6)         96
  USD 421Mn, primarily driven by higher net interest
  income and significantly higher FX gains                                               Loans (USD Bn)                                     Deposits (USD Bn)
                                                                                        QoQ ↔, YoY ↓8%                                     QoQ ↑27%, YoY ↑21%                       Profit after taxes                   200           93          359
• Revenue from international operations represents 23%
  of Q1’23 Group operating income, with MENA
                                                                                                                                                                      52
  contributing over 70%
                                                                                                                                      43      44      44      41                    CI Ratio                            26.1%       (239)bps    (1,694)bps
                                                                                 26      25      24      23      23
• Cost and risk discipline helped drive significant
  improvements in profit after taxes, both qoq and yoy
                                                                                                                                                                                    RoRWA                               2.3%         ​115​bps    ​187​bps

                                                                                                                                                                                    Contribution to Group
                                                                              Mar'22 Jun'22 Sep'22 Dec'22 Mar'23                    Mar'22 Jun'22 Sep'22 Dec'22 Mar'23                                                   23%        (599)bps     55bps
                                                                                                                                                                                    operating income

 1 Investment Banking has revised its reporting of customer loans based on where the client relationship is globally managed. This change is effective Q1’23 with the prior period figures for 2022 also restated for comparative purposes
 May 2023 Debt Investor Presentation                                                                                                                                                                                                                     41
Q1’23 financial highlights – Group financials
 Income Statement - Summary (USD Mn)                                                                  Q1’23      Q4’22     QoQ %                Q1’22         YoY %
 Net interest Income                                                                                  1,205       1,146       5                   853           41
 Non- interest Income                                                                                   627        464       35                   360           74
 Operating Income                                                                                      1,832      1,609      14                 1,214           51
 Gain on sale of stake in subsidiary                                                                      -          -       na                   764           na
 Total Income                                                                                          1,832      1,609      14                 1,978           (7)
 Operating expenses                                                                                    (459)      (545)     (16)                 (412)          11
 Operating profit                                                                                      1,373      1,065      29                  1,565         (12)
 Impairment charges, net                                                                                (217)      (301)    (28)                  (125)         74
 Non-controlling Interests and Taxes                                                                     (86)       (93)     (8)                    (47)        85
 Net Profit                                                                                            1,070       670       60                  1,394         (23)
 Net profit (excluding Magnati-related capital gains)                                                  1,070       670       60                   630           70
 Basic Earning per Share (USD) (adjusted1)                                                               0.09       0.06     54                    0.05         68

 Balance Sheet - Summary (USD Bn)                                                                     Mar’23     Dec’22    QoQ %                Mar’22        YoY %
 Loans, advances and Islamic financing                                                                 129        125         3                  118             9
 Investments                                                                                           ​57         56         ​2​                52              9
 Customer deposits                                                                                     213        191        ​11​                163​           30
 CASA (deposits)                                                                                        86         81          6                 84              2
 Total Assets                                                                                          323        302​         ​7​               267​           21
 Equity (incl Tier 1 capital notes)                                                                     31         31       (3)                  30              1
 Tangible Equity                                                                                        22         23       (3)                  22              ​2​
 Risk Weighted Assets                                                                                  155        156       ​(1)​                159​          ​(3)​

                                                                                                                             QoQ                                YoY
 Key Ratios2 (%)                                                                                      Q1’23      Q4’22                          Q1’22
                                                                                                                             (bps)                             (bps)
 Net Interest Margin                                                                                   1.65       1.63            2              1.54            11
 Cost-Income ratio1                                                                                    25.1       33.4      (833)                33.2         (815)
 Cost of Risk (bps) (loans, advances and Islamic financing)                                               62       86         (24)                42             19
 Non-performing loans ratio                                                                              3.8      3.9         (12)               3.8               0
 Provision coverage                                                                                      101       98         299                102            (32)
 Liquidity Coverage Ratio (LCR)                                                                          151      154       ​(225)​              120          ​large​
 Return on Tangible Equity (RoTE)1                                                                     18.5       11.1        ​745​              11.3           720
 Return on Risk-weighted Assets (RoRWA)1                                                                 2.8      1.7          111               1.6            118
 CET1 ratio                                                                                            ​13.2​     12.6          ​57​             13.0            ​20​
 Capital Adequacy ratio                                                                                 ​16.2​    15.6           ​58​            15.9             ​26​
 1 Excluding Magnati-related capital gains in Q1’22   2 All ratios are annualised, where applicable

May 2023 Debt Investor Presentation                                                                                        Scan to download full financials              42
Q1’23 financial highlights – Segmental

                                                                                                                  Q1’23
USD Mn                                                   Q1’23              Q4'22     QoQ %     Q1’22    YoY %
                                                                                                                 Contr%
Operating income                                         1,833               1,610      14      1,214      51     100%
Investment banking (IB)                                   723                 768      (6)       486       49      39%
Corporate & Commercial banking (CCB)                      458                 413       11       275​      66      25%
Consumer banking (CB)                                     219                 227      (4)       244      (10)     12%
Global Private banking (GPB)                               75                  74        1        ​65      15       4%
Head office (HO)                                          358                 128​     180       143      150      20%

UAE                                                      1,412               1,143      23       942       50     77%
International                                             421                 466      (10)      272       55     23%

Profit after taxes                                       1,071                672       59      1,050       2     100%
Investment banking (IB)                                   545                 581       (6)      ​838     (35)    51%
Corporate & Commercial banking (CCB)                      250                 159       58         12     2062    23%
Consumer banking (CB)                                      60                 70       (14)       139     (57)     6%
Global Private banking (GPB)                               33                 33        (2)        33       1      3%
Head office (HO)                                          183​               (171)      na         29      540    17%

UAE                                                       871                568       53       1,007     (13)    81%
International                                             200                104       93         44      359     19%

                                                                                                                  Q1’23
USD Bn                                                   Mar’23            Dec'22    QoQ %    Mar‘22    YoY %
                                                                                                                 Contr%
Loans, advances and Islamic financing                     129               125        3       118        9       100%
Investment banking (IB)                                    57                56        2        57        0        45%
Corporate & Commercial banking (CCB)                       44                42        4        32​      37        34%
Consumer banking (CB)                                      14​               14        0        14        4        11%
Global Private banking (GPB)                                8​                8        0        9       (14)       6%
Head office (HO)                                            6                 5       12        6​       (5)       ​5%​

UAE                                                       105               102        4       92​       14       82%
International                                              23                23​      (0)      25​       (8)      18%

Customer deposits                                         213               191       11       163       30      ​100%​
Investment banking (IB)                                   140               123​      14        94       50        66%
Corporate & Commercial banking (CCB)                       38                37​       2        37        1        18%
Consumer banking (CB)                                      19​               18       10        16​      21        9%
Global Private banking (GPB)                                8​                8       10        8​        6        ​4%​
Head office (HO)                                            7​                6       10        9​      (24)        ​3%​

UAE                                                       160               150        7       120       33       ​75%​
International                                              52                41​      27        43       21        ​25%​

  May 2023 Debt Investor Presentation   Scan to download full financials                                                   43
Supplementary ESG
slides

                    44
As the UAE’s largest bank, FAB is committed to supporting the country’s
sustainability agenda to drive growth and development

                                          Sustainability is at the heart of the UAE’s economic strategy

UAE National Net Zero by 2050 Pathway                                                  UAE Energy Strategy 2050
Throughout 3 GHG emissions reduction stages:
       • 18% by 2030;                                                                  Increase the contribution of clean energy to the total energy mix from 25% to
                                                                                       50%.
       • 60% by 2040;
       • 100% by 2050.                                                                 Reduce carbon footprint of power generation by 70%.
The pathway sets a timeframe and identifies mechanisms of implementing the UAE         Increase the consumption efficiency of individuals and corporates by 40%.
Net Zero by 2050 Strategic Initiative
The strategy defines reductions on each stage for 5 industry categories: buildings;    Achieve net zero carbon emissions by 2050.
domestic transportation; industry; power & water; waste & others.

COP 28 in the UAE                                                                     Pillars of UAE Centennial Plan 2071
The UAE will seek to unite the world towards agreement on bold, practical, and        Education: encourage entrepreneurship, innovation and international research.
ambitious solutions to the most pressing global challenge of our time.
                                                                                      Economy: boost economic productivity by supporting national companies; reinforce the
The first Global Stocktake (GST): COP28 will be a milestone moment as the             UAE’s position through a focus on innovation and reducing reliance on oil.
world will take stock of its progress on the Paris Agreement through a
comprehensive assessment.                                                             Government Development: Establish the Government of the UAE as the best
                                                                                      Government in the World.
The COP28 UAE Presidency: will work to ensure that the world responds to the
Global Stocktake with a clear plan of action.                                         Community Cohesion: sustaining a secure, tolerant, cohesive and ethical society;
                                                                                      promoting women’s participation in all sectors.
 UAE Climate-Responsible Companies Pledge                                              Across the GCC:
Signatories pledged to factor in climate change mitigation and adaptation,            Net-zero by 2050                Net-zero by 2060               35% reduction by 2030
while stepping up measuring and reporting efforts.

May 2023 Debt Investor Presentation                                                                                                                                          45
You can also read