Deep anomaly detection of seizures with paired stereoelectroencephalography and video recordings - Nature
←
→
Page content transcription
If your browser does not render page correctly, please read the page content below
www.nature.com/scientificreports
OPEN Deep anomaly detection
of seizures with paired
stereoelectroencephalography
and video recordings
Michael L. Martini1, Aly A. Valliani1, Claire Sun1,2, Anthony B. Costa1, Shan Zhao3,
Fedor Panov1, Saadi Ghatan1, Kanaka Rajan2* & Eric Karl Oermann4,5,6*
Real-time seizure detection is a resource intensive process as it requires continuous monitoring of
patients on stereoelectroencephalography. This study improves real-time seizure detection in drug
resistant epilepsy (DRE) patients by developing patient-specific deep learning models that utilize a
novel self-supervised dynamic thresholding approach. Deep neural networks were constructed on over
2000 h of high-resolution, multichannel SEEG and video recordings from 14 DRE patients. Consensus
labels from a panel of epileptologists were used to evaluate model efficacy. Self-supervised dynamic
thresholding exhibited improvements in positive predictive value (PPV; difference: 39.0%; 95% CI
4.5–73.5%; Wilcoxon–Mann–Whitney test; N = 14; p = 0.03) with similar sensitivity (difference: 14.3%;
95% CI − 21.7 to 50.3%; Wilcoxon–Mann–Whitney test; N = 14; p = 0.42) compared to static thresholds.
In some models, training on as little as 10 min of SEEG data yielded robust detection. Cross-testing
experiments reduced PPV (difference: 56.5%; 95% CI 25.8–87.3%; Wilcoxon–Mann–Whitney
test; N = 14; p = 0.002), while multimodal detection significantly improved sensitivity (difference:
25.0%; 95% CI 0.2–49.9%; Wilcoxon–Mann–Whitney test; N = 14; p < 0.05). Self-supervised dynamic
thresholding improved the efficacy of real-time seizure predictions. Multimodal models demonstrated
potential to improve detection. These findings are promising for future deployment in epilepsy
monitoring units to enable real-time seizure detection without annotated data and only minimal
training time in individual patients.
Epilepsy is among the most common neurological disorders worldwide with an estimated 5 million people
diagnosed each year1. Epileptic seizures are characterized by pathological electrical activity in regions of the
brain that manifest as functional disturbances that may be transient2. Although first-line treatment to control
seizures consists of antiepileptic drugs, more than 30% of patients are pharmacoresistant and at high risk for
premature mortality3–5. Stereoelectroencephalography (SEEG) is a method for localizing epileptogenic foci in
patients with drug resistant epilepsy (DRE) involving placement of macroelectrode depth electrodes into the
brain, followed by continuous monitoring in a specialized epilepsy monitoring unit (EMU)6–8. Epileptologists
must quickly recognize abnormal SEEG waveforms, and EMU staff must monitor patients for signs of clinical
seizures around the clock, making this is a highly time- and resource-intensive process.
Deep learning-based approaches are promising solutions to automated seizure detection, but they are not
without limitations9–13. Previous studies have: (1) used algorithms engineered to classify previously recorded
EEG sequences without a framework for real-time event detection, (2) required large training datasets, extensive
annotations, and a pre-screening for artifacts to achieve adequate results, and (3) produced high false positive
rates, commonly due to static thresholding methods applied in the decision function. This limits clinical util-
ity, particularly in the context of large-scale data produced by continuous in-hospital recordings. Furthermore,
1
Department of Neurosurgery, Icahn School of Medicine at Mount Sinai, New York, NY 10029, USA. 2Department
of Neurosciences, Friedman Brain Institute, Icahn School of Medicine at Mount Sinai, One Gustave Levy Place,
New York, NY 10029, USA. 3Department of Anesthesiology, Icahn School of Medicine At Mount Sinai, New York,
NY 10029, USA. 4Department of Neurosurgery, New York University Langone Medical Center, New York University,
Skirball, Suite 8S, 530 First Avenue, New York, NY 10016, USA. 5Department of Radiology, New York University
Langone Medical Center, New York, NY 10016, USA. 6NYU Center for Data Science, New York University, New
York, NY 10011, USA. *email: kanaka.rajan@mssm.edu; eric.oermann@nyulangone.org
Scientific Reports | (2021) 11:7482 | https://doi.org/10.1038/s41598-021-86891-y 1
Vol.:(0123456789)
www.nature.com/scientificreports/
Figure 1. Overview of the workflow for continuous monitoring with video and SEEG and real-time analysis
in the epilepsy monitoring unit. Patients with DRE receive continuous monitoring of their intracranial SEEG
leads (red) and simultaneous video recording in their hospital beds (blue). A convolutional LSTM autoencoder
(CNN + LSTM) was applied to the video recordings to calculate a regularity score for each frame over time. This
regularity score time series and the SEEG time series (green sequence, bottom left) were then separately fed into
an LSTM network to reconstruct their signals (blue sequence, bottom middle) and calculate a reconstruction
error (red sequence, bottom right) which was then subjected to a self-supervised dynamically thresholding
method to identify anomalous events in real-time.
acquiring large, annotated datasets and screening for artifacts is time- and cost-prohibitive which diminishes util-
ity unless the pre-trained models are exceptionally well-generalizable. Given the variety of waveforms, dynamic
noise, and other idiosyncrasies often present in patient recordings, seizure detection remains challenging.
We present our results from training individually tailored, self-supervised Long Short-Term Memory (LSTM)
deep neural networks on continuous in-hospital multichannel SEEG and video recordings with no explicitly
labeled data (Fig. 1). Here, we define seizure detection as the task of anomaly detection in high-dimensional
sequences. A dynamic thresholding method, developed by NASA for use on the Mars Rover, was adapted to
improve detection sensitivity and mitigate false positives, suggesting feasibility as a new, more dynamic paradigm
for real-time anomaly detection in video and electroencephalographic d ata14.
Concurrent SEEG and video signals, totaling over 2000 h across all patients and channels analyzed, were
processed by adapting previously described methods (“Signal processing”)15,16. LSTMs and convolutional LSTM
autoencoders were trained for each patient as described in “LSTM training and parameters”. Dynamic threshold-
ing was compared to conventional static thresholding, crossover experiments (Figs. 2, 3) were performed to char-
acterize models’ patient-specificity, and joint models incorporating SEEG and video detection were constructed
to assess the added benefit of multimodal detection. Model outputs were compared to ground truth anomalous
sequences agreed upon by three fellowship-trained epileptologists who were blinded to the results of the model.
The positive predictive value (PPV), sensitivity, and F 1 scores were compared between models. Mean absolute
percent error and minimal duration of recording data to train each model were also noted.
Results
Dynamic vs. static thresholding. The dynamic threshold with error pruning was compared to a baseline,
fixed threshold, label-free anomaly detection approach. Inspection of the threshold demonstrated that the math-
ematical optimization in each window found localized levels that effectively categorized anomalies in real-time
(Fig. 4A,B). Compared to static thresholding, dynamic thresholding did not improve sensitivity significantly
(difference: 14.3%; 95% CI − 21.7 to 50.3%; Wilcoxon–Mann–Whitney test; N = 14; p = 0.42) but did significantly
increase PPV (difference: 39.0%; 95% CI 4.5–73.5%; Wilcoxon–Mann–Whitney test; N = 14; p = 0.03). Addition-
ally, F1 scores were significantly higher for the dynamic threshold (difference: 0.31; 95% CI 0.1–0.61; Wilcoxon–
Mann–Whitney test; N = 14; p = 0.04).
Scientific Reports | (2021) 11:7482 | https://doi.org/10.1038/s41598-021-86891-y 2
Vol:.(1234567890)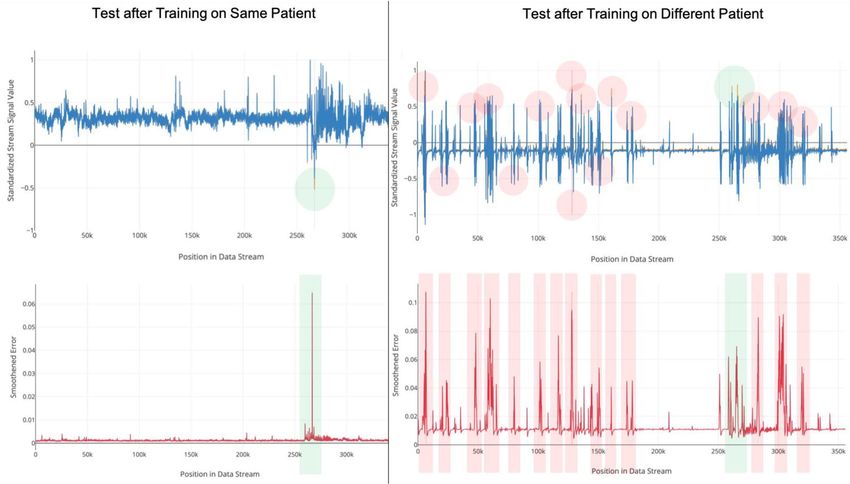
www.nature.com/scientificreports/

                                  Figure 2.  Design of crossover experiments to assess patient-specificity of models. LSTM models were trained
                                  on recordings from one patient and tested on recordings from another patient.

                                  Figure 3.  Crossover testing produces a large increase in the number of false positive results. This indicates that
                                  trained models are attuned to the unique electrical signal of a given patient. Green shading refers to prediction
                                  mismatches that correspond to correctly identified anomalies whereas red shading refers to prediction
                                  mismatches that correspond to false positives.

Scientific Reports |   (2021) 11:7482 |                https://doi.org/10.1038/s41598-021-86891-y                                                       3

                                                                                                                                               Vol.:(0123456789)
www.nature.com/scientificreports/
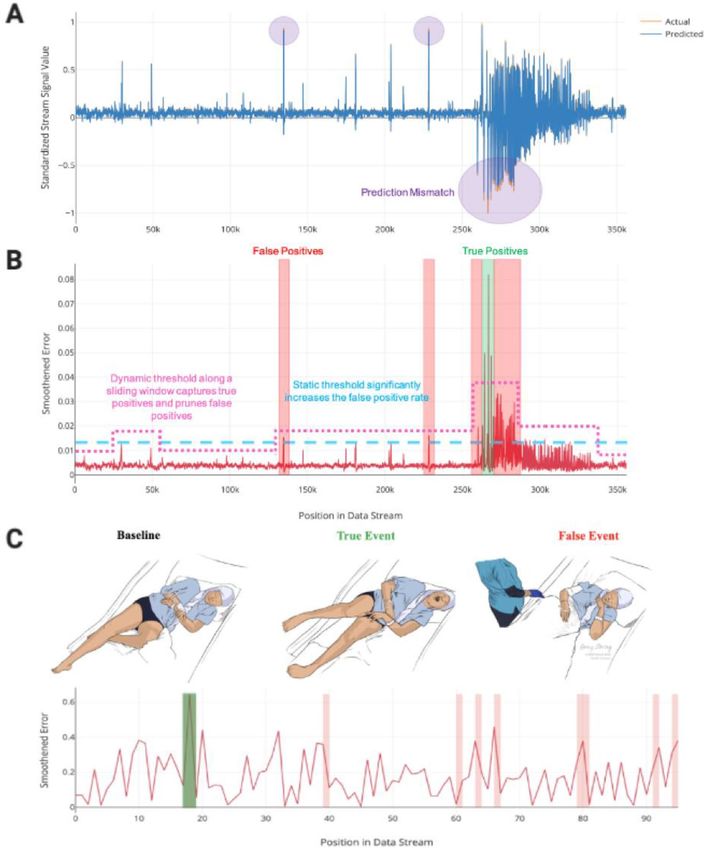
Figure 4. Self-supervised error thresholding for real-time detection of anomalies in SEEG and video data. An
LSTM network is trained to predict the next window of values in the test time series sequence (A, blue). These
values are compared to the actual values (A, orange), and a smoothed error is calculated for each value in the
sequence (B, red sequence). Prediction mismatches (A, purple) manifest as higher errors. A self-supervised
dynamic threshold (B, magenta line) enables effective local classification of true anomalous sequences (B, green
bar) while omitting many of the false positives (B, red bars) that result from traditional static thresholding
methods (B, blue line). Concurrently acquired video recordings for each patient were considerably noisier and
signal reconstruction was not as robust, demonstrated by the higher reconstruction errors (C, red sequence).
While video sequences captured all of the true seizure events in the study population (C, middle, green bar),
they also captured several false positive events, such as nurse visits (C, far right, red bars).
Scientific Reports | (2021) 11:7482 | https://doi.org/10.1038/s41598-021-86891-y 4
Vol:.(1234567890)www.nature.com/scientificreports/
Crossover experiments. Crossover experiments assessed whether the learned features from each patient
training model generalized to testing sequences derived from different DRE patients (Figs. 2, 3). With six dis-
tinct crossover combinations, anomaly detection sensitivity remained comparable to the non-crossover experi-
ments (difference: 4.8%; 95% CI − 38.4 to 47.9%; Wilcoxon–Mann–Whitney test; N = 14; p = 0.82), but PPV (dif-
ference: 56.5%; 95% CI 25.8–87.3%; Wilcoxon–Mann–Whitney test; N = 14; p = 0.002) and F1 scores significantly
declined (difference: 0.38; 95% CI 0.08–0.67; Wilcoxon–Mann–Whitney test; N = 14; p = 0.02). After training on
continuous data from a given patient, testing the network on an unseen sequence derived from the same patient
resulted in high fidelity of predicted sequences, with most of the prediction mismatches (Fig. 3, left, top, green
circle) corresponding to true anomalies (Fig. 3, left, bottom, green bar). Testing this same model on an unseen,
normalized sequence derived from a different patient produced considerably more prediction mismatches
(Fig. 3, right, top, red and green circles), resulting in higher false positive rates (Fig. 3, right, bottom, red bars).
Multimodal detection. Joint models incorporating self-supervised anomaly detection in video and SEEG
recordings were constructed to determine the potential added benefit of multimodal detection (Fig. 4C). Mul-
timodal detection significantly improved sensitivity (difference: 25.0%; 95% CI 0.2–49.9%; Wilcoxon–Mann–
Whitney test; N = 14; p < 0.05) over dynamically thresholded SEEG recordings, but decreased PPV, though not
significantly (difference: 21.3%; 95% CI − 10.3 to 52.9%; Wilcoxon–Mann–Whitney test; N = 14; p = 0.17). Rela-
tive to video detection alone, the combined workflow also improved the PPV (difference: 28.5%; 95% CI 4.6–
52.4%; Wilcoxon–Mann–Whitney test; N = 14; p = 0.02) and F1 scores (difference: 0.22; 95% CI − 0.01 to 0.44;
Wilcoxon–Mann–Whitney test; N = 14; p = 0.06).
Discussion
The study is the first to implement a multimodal self-supervised deep learning workflow for intracranial seizure
detection in DRE patients. While previous studies have used bedside recordings to classify hypermotor seizures,
few have jointly evaluated video and electroencephalographic feeds to detect seizures17,18. This study provides
a novel proof-of-concept in this arena by demonstrating the potential of self-supervised anomaly thresholding
to improve the sensitivity and PPV of automated seizure detection on continuous multimodal recordings in
real-time. Because error residuals in anomaly detection are often non-Gaussian, the nonparametric dynamic
thresholding method for error classification used in this study overcomes a major limitation of prior studies using
parametric thresholding methods which assumed a distribution that does not fit the residuals.
The pipeline presented in this work utilizes a LSTM network and a convolutional LSTM autoencoder to
enable real-time detection of anomalous events in high-resolution SEEG and video data, respectively, making
them valuable in a prospective setting. Models were trained on only 5–10 min of SEEG recordings which did not
necessarily include a seizure event and labeled data was not required, thereby reducing time and cost of analysis.
Crossover studies suggested the self-learned representations of SEEG recordings are patient-specific, which
provides confidence in the ability of our algorithm to identify clinically relevant features given the diversity of
signal properties between patients. Taken together, clinical translation of this work could personalize the care of
patients and augment the workflow of staff in the EMU. By ingesting a few initial minutes of a patient’s recording,
this pipeline would enable continuous long-term monitoring of ictal events and reduce frequent false alarms
in the context of subtle environmental changes, which would otherwise be time intensive and cost prohibitive.
Earlier methods in inpatient epileptic seizure detection have traditionally relied more on constant monitor-
ing of patient recordings by trained personnel. This is available in approximately 56–80% of EMUs, whereas
automatic online EEG warning systems are present in only 15–19% of EMUs19. While clinical seizure semiol-
ogy provides some critical information to help elucidate the zone of onset and propagation pathways, periictal
behavioral assessments facilitate an even more comprehensive understanding of these details. Most algorithms
for EEG-based seizure detection in clinical settings center around multiple-channel analyses rather than single-
channel19. Following data acquisition by the electrodes, these systems typically employ a method for artifact rejec-
tion followed by an algorithm for event detection usually involving analysis of the electrographic changes during
seizures in terms of amplitude, frequency, or rhythmicity. Methods for these analyses in previous algorithms
for patient-specific seizure detection have included both linear and nonlinear time–frequency signal analysis
techniques20–22. More recent studies focusing on automated seizure detection have relied on other machine
learning techniques, including support vector machines, k-nearest neighbors, and convolutional neural net-
works, which require complete electroencephalograms before determining whether anomalies are p resent23–25.
Such properties limit the application of these approaches primarily to retrospective data. Furthermore, unlike
deep learning methods which learn the best features to implement to achieve optimal performance, these older
methods require manual feature extraction and careful programming of the network to obtain acceptable results.
Other work has focused on developing large pre-trained models with the goal of successful generalization to other
patients26. Of note, there are several generalized, commercially-available seizure detection algorithms currently
on the market, including Persyst-Reveal27, IdentEvent28, BESA29, and E piScan30. The primary limitation of these
methods, however, is that they may not generalize well to other patients given the wide variety of signal charac-
teristics that may exist as a result of recording quality, patient disease and electrophysiological characteristics,
or other uncontrollable factors. This, in turn, may limit clinical efficacy. In contrast, as described previously, the
workflow presented in this study could be rapidly deployed in clinical settings to create patient-specific models
with improved adaptability for prospective prediction.
Limitations. This study’s limitations include using retrospective data for training and a relatively small
patient cohort, which could introduce selection bias. While overfitting is always a concern in deep learning, we
controlled for this by holding out data for validation for each patient and using early stopping criteria during
Scientific Reports | (2021) 11:7482 | https://doi.org/10.1038/s41598-021-86891-y 5
Vol.:(0123456789)www.nature.com/scientificreports/
Demographics
Age (mean ± SEM) 24.5 ± 2.0 years
Female (%) 8 (57%)
Duration of recording in hospital (mean ± SEM) 6.1 ± 0.4 days
Taking antiepileptic drugs (%) 10 (71%)
Targets with leads (total across study population)
Number of leads (total; mean ± SEM) 204; 14.6 ± 0.6
Supplementary motor area (SMA) 8 (4%)
Amygdala 25 (12%)
Cingulate 55 (27%)
Frontal 11 (5%)
Hippocampus 25 (12%)
Insula 10 (5%)
Orbitofrontal 28 (14%)
Parietal 7 (3%)
Premotor 5 (3%)
Temporal 28 (14%)
Thalamus 2 (1%)
Number of channels (total; mean ± SEM) 2055; 146.8 ± 7.6
Table 1. Characteristics of the patient population. SEM standard error of the mean.
model training (“LSTM training and parameters”). Additionally, although incorporating videos improved sen-
sitivity, it also increased false positives. Developing more sophisticated tiered or weighted systems for escalating
anomalies detected in concurrent multimodal recordings could reduce false positives in this workflow. Future
work is underway to adapt these methods to a prospective, randomized format to confirm the utility of self-
supervised dynamic thresholding for seizure detection in a clinical setting.
Conclusions
Self-supervised dynamic thresholding of patient-specific models significantly improves the PPV of seizure detec-
tion in continuous SEEG recordings from DRE patients compared to traditional static thresholds. Incorporating
concurrent video recordings into multimodal models significantly improved sensitivity, but reduced PPV, though
not significantly. The characteristics of these models are promising for future deployment in clinical settings to
improve the speed, precision, and cost-effectiveness of epilepsy monitoring, which may ultimately improve the
safety profile of SEEG monitoring for our patients.
Methods
Study protocol. Patients with drug resistant epilepsy (DRE) at an academic medical center were retro-
spectively enrolled in the study. Subjects with significant progressive disorders or unstable medical conditions
requiring acute intervention, those taking more than three concomitant antiepileptic drugs (AEDs) or with
changes in AED regimen within 28 days, and patients with onset of epilepsy treatment less than two years prior
to enrollment, were excluded from the study. In total, 14 consecutive DRE patients underwent surgical implanta-
tion of 10–18 multichannel SEEG leads from 2018–2019 as per standard hospital protocols (average: 15 leads,
147 channels) and subsequent in-hospital video and SEEG monitoring for 4–8 days (average: 6 days). Patients
were 16–38 years old (average: 24.5 years), 57% were female, and 71.4% were taking AEDs during the record-
ing period. All patients had recordings with at least one epileptiform event (Table 1). This study was approved
by the Mount Sinai Health System Institutional Review Board (IRB). Informed consent was waived by the IRB
with oversight from the Program for the Protection of Human Subjects Office. All methods were performed in
accordance with their relevant guidelines and regulations.
Signal processing. High-resolution SEEG recordings sampled at 512 Hz were obtained from the Natus
NeuroWorks platform, filtered with a one-pass, zero-phase, non-causal 50 Hz low-pass finite impulse response
filter, and scaled to (− 1, 1). Concurrent video recordings for each patient in the monitoring unit were acquired
at 480p resolution at 30 frames per second. Videos were segmented into sequential clips, converted to .tiff image
files using FFmpeg, and fed into a convolutional LSTM autoencoder that was structured to have 2 convolutional
layers, 3 convolutional LSTM layers, and 2 deconvolutional layers16. A regularity score time series was calculated
for all video frames by computing the reconstruction error of each frame by summing up all pixel-wise errors, as
described by Hasan et al.15. Signal processing was conducted using MNE 0.17.1 and SciPy Signal in Python 3.7.
LSTM training and parameters. A self-supervised training regimen was established where each channel
from the SEEG recordings and regularity score time series was divided into training and testing sequences using
variable train:test splits ranging from 20:80 to 50:50. 29% of recordings in the train set had epileptiform events
Scientific Reports | (2021) 11:7482 | https://doi.org/10.1038/s41598-021-86891-y 6
Vol:.(1234567890)www.nature.com/scientificreports/
LSTM metrics for SEEG and videos
Train:test ratio (mean ± SEM) 0.41 ± 0.03
Time used to train model (mean ± SEM) 11.2 ± 1.5 min
Train recordings with events (%) 4 (29%)
Test recordings with events (%) 12 (86%)
MAPE for dynamic threshold (mean ± SEM) 0.7 ± 0.2%
MAPE for static threshold (mean ± SEM) 0.7 ± 0.1%
MAPE for crossover experiments with dynamic threshold (mean ± SEM) 2.7 ± 0.8%
MAPE for video recordings (mean ± SEM) 19.9 ± 0.8%
SEEG static thresholding results
Sensitivity (mean ± SEM) 64.3 ± 13.3%
Positive predictive value (mean ± SEM) 34.4 ± 13.9%
F1 Score (mean ± SEM) 0.61 ± 0.12
SEEG dynamic thresholding results
Sensitivity (mean ± SEM) 78.6 ± 11.4%
Positive predictive value (mean ± SEM) 89.6 ± 9.2%
F1 Score (mean ± SEM) 0.92 ± 0.08
SEEG crossover results
Sensitivity (mean ± SEM) 83.3 ± 16.7%
Positive predictive value (mean ± SEM) 15.3 ± 10.6%
F1 Score (mean ± SEM) 0.54 ± 0.11
Video anomaly detection results without SEEG
Sensitivity (mean ± SEM) 100.0 ± 0%
Positive predictive value (mean ± SEM) 19.1 ± 7.1%
F1 Score (mean ± SEM) 0.44 ± 0.07
Combined video + SEEG anomaly detection results
Sensitivity (mean ± SEM) 100.0 ± 0%
Positive predictive value (mean ± SEM) 65.6 ± 9.2%
F1 Score (mean ± SEM) 0.65 ± 0.09
Table 2. Neural network specifications and results. MAPE mean absolute percent error, SEEG
stereoelectroencephalography, SEM standard error of the mean.
whereas 86% of recordings in the test set had such events (Table 2). A LSTM network with 80 hidden layers
was initialized for each channel and trained on the unlabeled training sequence for up to 35 epochs (or until
early stopping criteria were met) with a sequence length typically between 250,000 to 750,000 elements, which
spanned anywhere from 10 to 30 min overall and either did or did not include known anomalies. To mitigate the
risk of model overfitting, early stopping criteria were used while training each model. These criteria specified that
training iterations must decrease the loss metric by at least 0.003 to allow additional training iterations to occur.
Using a training “patience” of 5, up to 5 consecutive training iterations were allowed to occur without decreas-
ing the loss metric by at least 0.003 before model training was stopped early. Each LSTM used a mean-squared
error loss metric, an Adam optimizer, and a dropout of 0.3. Within the training sequences, 20% of the data was
set aside as validation before testing. After training, the performance of each model was assessed on the unseen
test sequences. The network was assessed for its ability to predict future values in real-time (Fig. 4A), compare
the predictions to the actual values, and compute a smoothed error based on the difference between the actual
and predicted values (Fig. 4B). LSTMs and convolutional autoencoders were implemented using TensorFlow.
Self‑supervised dynamic thresholding method. A novel dynamic thresholding approach, devel-
oped by the NASA Jet Propulsion Laboratory to detect real-time anomalies in telemetry data from the Mars
Rover, Curiosity, was adapted to our models to label anomalies based on the error values from the time series
predictions14. In contrast to conventional static thresholds frequently used for anomaly detection (e.g. mean ± 2
standard deviations), this dynamic method uses a sliding window approach to find optimal local thresholds,
such that the percent decrease in the mean and standard deviation of the smoothed error in the window is
maximized if values above the set threshold are excluded. To mitigate false positives, an error pruning procedure
was implemented in which the sequence of smoothed errors was incrementally stepped through, the percent
decrease between time steps was computed, and steps with a percent change greater than 10% remained anoma-
lies while steps with a change less than 10% were reclassified as normal.
Crossover and multimodal video/SEEG detection experiments. To evaluate the patient-specific
nature of the LSTM models, crossover experiments were conducted, in which models were trained on record-
ings from one patient and tested on another, while all other conditions remained identical to previous testing
Scientific Reports | (2021) 11:7482 | https://doi.org/10.1038/s41598-021-86891-y 7
Vol.:(0123456789)www.nature.com/scientificreports/
SEEG, dynamic Video alone, dynamic SEEG + video, dynamic
thresholding (PPV, SEEG, static thresholding thresholding (PPV, thresholding (PPV,
Pt # Clinical seizure findings EEG seizure findings sensitivity) (PPV, sensitivity) sensitivity) sensitivity)
Generalized tonic seizure Generalized desynchro-
with abduction of both nization of the EEG back-
1 92.3, 100 9.7, 100 100, 100 100, 100
arms and extensor postur- ground with superimposed
ing of her legs. beta frequency activity.
Absence seizures with Generalized, repetitive,
2 repetitive eye blinking and spikes and polyspikes of 50.0, 100 0, 0 50.0, 100 50.0, 100
staring. 2 Hz.
Sentinal spike in the left
amygdala followed by a
slow buildup of rhythmic
theta. Activity spreads
Bilateral motor manifesta-
to left medial temporal,
3 tions involving extension of 100, 100 27.7, 100 25.0, 100 88.0, 100
parietal, and insular
both arms and legs.
regions. Semi-rhythmic
theta with admixed spikes
in left anterior and medial
cingulate.
Starts as low amplitude
beta activity in the left
Ictal cry with head move-
hippocampus with spread
ments and bilateral clonic
to left amygdala and left
body movements obscured
medial temporal lobe.
4 by blankets. Arms are held 100, 100 0, 0 25.0, 100 25.0, 100
Evolves to high amplitude
in dystonic posture bilater-
spiky alpha and spiky theta
ally with forceful jerking
activities. Later spread
movements superimposed.
to the medial olfactory
cortex.
Continuous atypical,
Oral and head movements generalized spike-and-
with vocalizations and wave discharges at 4 Hz in
5 bilateral extremity flexion. bilateral frontal, cingulate, 100, 100 100, 100 20.0, 100 90.7, 100
Later progresses to tonic– and hippocampal regions.
clonic. Subsequent burst of spike
and wave activity.
Atypical, generalized
Notable eye movement,
spike-and-wave discharges
vocalization, and some
at 4 Hz in bilateral frontal
6 bilateral extremity move- 100, 100 No events detected 20.0, 100 33.3, 100
and cingulate regions fol-
ments. Eventually tonic–
lowed by rhythmic spiking
clonic.
diffusely.
Slightly different onsets
but nearly always maximal
involvement in left lateral
Multiple subclinical
temporal. Begins with
seizures. Clinically, all
spike and wave, or gamma/
7 seizures are hypermotor, 100, 100 100, 100 20.0, 100 60.0, 100
beta activity there. Often
and begin with a rapid
has several minutes of very
movement in the hands.
subtle epileptic spasms
with diffuse slow waves in
left lateral temporal.
Rhythmic fast activity in
right medial cingulate and
temporal areas. Sharply
Versive head movements
contoured theta develops
with right arm flexion and
in left hippocampus, which
8 extension, followed by 100, 100 100, 100 25.0, 100 40.0, 100
evolves to spike and slow
tonic–clonic movements of
wave morphology and
both arms.
spreads to bilateral medial
cingulate and left temporal
areas.
Desynchronization with
superimposed low voltage
Oral movements with ictal
fast beta/gamma activity
cry and right facial con-
over left medial cingulate.
traction. Later generalized
9 Later, ictal discharge of No events detected No events detected 16.7, 100 16.7, 100
clonic jerking and postur-
repetitive spikes become
ing before generalized
wide spread, involving
tonic–clonic seizures.
cingulate, temporal, and
amygdala areas bilaterally.
Right arm movements
with subtle leg movements.
Rhythmic alpha activity in
Some head movement with
right amygdala and hip-
10 eyes looking up and left. No events detected No events detected 16.7, 100 16.7, 100
pocampus that slows to the
Later, jerking movements,
theta range.
vocalization, and tonic
posturing.
Continued
Scientific Reports | (2021) 11:7482 | https://doi.org/10.1038/s41598-021-86891-y 8
Vol:.(1234567890)www.nature.com/scientificreports/
SEEG, dynamic Video alone, dynamic SEEG + video, dynamic
thresholding (PPV, SEEG, static thresholding thresholding (PPV, thresholding (PPV,
Pt # Clinical seizure findings EEG seizure findings sensitivity) (PPV, sensitivity) sensitivity) sensitivity)
High amplitude right
hippocampal activity.
Lower extremity bicycling
Several seconds into the
11 movements under bed 100, 100 59.0, 100 33.3, 100 50.0, 100
seizure, there is spread to
sheets.
right insula, cingulate, and
temporal regions.
Subtle low amplitude
Motionless at onset. At
gamma buzz at left SMA.
12 times will look around and 100, 100 40.0, 100 40.0, 100 70.0, 100
Some rhythmic beta in left
turn head slowly left.
premotor region.
Right premotor area
Subtle bilateral automa- becomes rhythmic near
tisms in hands. Will then onset but bilateral activity
raise left hand with some seen. Activity builds in
13 16.7, 100 20.0, 100 50.0, 100 90.0. 100
tremulous movements. amplitude and then slows
Later has rapid eye blinking to delta with admixed
and smile. spikes/gamma. Some
spread to left SMA.
Onset of repetitive spikes
of 1 Hz at left hippocam-
Brief oral automatisms with pus and amygdala. Spikes
faint vocalization. Right increase in frequency to
14 hand clenched into fist. 2–3 Hz and evolve into No events detected No events detected 6.3, 100 6.25, 100
Subtle clonic jerking of the alpha frequency discharge.
right hand and arm. Ictal discharge spreads to
left cingulate, olfactory,
and temporal areas.
Table 3. Patient-specific clinical and electrophysiologic seizure manifestations, as well as model
performance on individual patient recordings. EEG electroencephalographic, Pt patient, SEEG
stereoelectroencephalography, SMA supplementary motor area, SEM standard error of the mean.
conditions, including the dynamic thresholding and error pruning methods (Fig. 2). Fourteen combinations of
train and test sequences derived from the study population were randomly selected to conduct the crossover
experiments.
To assess the added value of multimodal detection, the concurrent video and SEEG recordings for each patient
were separately fed into the corresponding deep neural networks described previously. The resulting anomalous
sequence predictions made by the self-supervised dynamically threshold in the LSTM decision function for each
detection modality was then pooled before comparing the predicted anomaly times with the consensus labels of
the expert panel of epileptologists. We did not encounter any disagreements among the panel regarding consensus
labeling within this dataset. The results of model performance on individual patient recordings are detailed in
Table 3, along with the patient’s clinical and electrophysiologic seizure manifestations.
Metrics for assessing signal reconstruction quality. We assessed the models for their ability to cap-
ture the underlying signal itself using standard time series metric of mean absolute percentage error (MAPE),
representing each recording channel that was reconstructed by the LSTM for each patient. The MAPEs ranged
from 0.15–1.57% for each patient (average: 0.75%; Table 2), suggesting generally excellent reconstruction of the
SEEG signal by the LSTM. Video regularity score signals were noisier due to diverse events occurring during
recording, leading to higher MAPEs (average: 19.95%; Table 2).
Statistics. For continuous variables in this study, the Kolmogorov–Smirnov test was first used to test for a
normal distribution. Given the lack of a normal distribution in the data of this study, continuous variables were
compared using the Wilcoxon–Mann–Whitney test. A threshold of p < 0.05 with two-tailed testing was used to
determine statistical significance. Statistics were conducted using Prism 7.
Data availability
Data from this study are available upon reasonable request. In accordance with institutional policy for data
protection, a Data Transfer Agreement must be completed between Mount Sinai and the requesting institution.
Code availability
Code for the pre-processing and analysis pipelines in this study are available at: https://github.com/aisinai.
Received: 9 January 2021; Accepted: 16 March 2021
References
1. Epilepsy. https://www.who.int/news-room/fact-sheets/detail/epilepsy (2019).
2. Fisher, R. S. et al. ILAE official report: A practical clinical definition of epilepsy. Epilepsia 55, 475–482. https://doi.org/10.1111/
epi.12550 (2014).
Scientific Reports | (2021) 11:7482 | https://doi.org/10.1038/s41598-021-86891-y 9
Vol.:(0123456789)www.nature.com/scientificreports/
3. Kwan, P. & Brodie, M. J. Early identification of refractory epilepsy. N. Engl. J. Med. 342, 314–319. https://doi.org/10.1056/NEJM2
00002033420503 (2000).
4. Brodie, M. J., Barry, S. J., Bamagous, G. A., Norrie, J. D. & Kwan, P. Patterns of treatment response in newly diagnosed epilepsy.
Neurology 78, 1548–1554. https://doi.org/10.1212/WNL.0b013e3182563b19 (2012).
5. Jette, N. & Engel, J. Jr. Refractory epilepsy is a life-threatening disease: Lest we forget. Neurology 86, 1932–1933. https://doi.org/
10.1212/WNL.0000000000002707 (2016).
6. Vaugier, L. et al. The role of stereoelectroencephalography (SEEG) in reevaluation of epilepsy surgery failures. Epilepsy Behav. 81,
86–93. https://doi.org/10.1016/j.yebeh.2018.02.005 (2018).
7. Kaur, M. et al. Long-term seizure freedom following intracranial sEEG monitoring: Therapeutic benefit of a diagnostic technique.
Epilepsy Behav. Rep. 12, 100345. https://doi.org/10.1016/j.ebr.2019.100345 (2019).
8. Youngerman, B. E., Khan, F. A. & McKhann, G. M. Stereoelectroencephalography in epilepsy, cognitive neurophysiology, and
psychiatric disease: Safety, efficacy, and place in therapy. Neuropsychiatr. Dis. Treat. 15, 1701–1716. https://doi.org/10.2147/NDT.
S177804 (2019).
9. Hussein, R., Palangi, H., Ward, R. & Wang, Z. J. Epileptic seizure detection: A deep learning approach. arXiv e-prints, arXiv:1803.
09848. https://ui.adsabs.harvard.edu/abs/2018arXiv180309848H (2018).
10. Gagliano, L., Bou Assi, E., Nguyen, D. K. & Sawan, M. Bispectrum and recurrent neural networks: Improved classification of
interictal and preictal states. Sci. Rep. 9, 15649. https://doi.org/10.1038/s41598-019-52152-2 (2019).
11. Cho, K. O. & Jang, H. J. Comparison of different input modalities and network structures for deep learning-based seizure detec-
tion. Sci. Rep. 10, 122. https://doi.org/10.1038/s41598-019-56958-y (2020).
12. Bomela, W., Wang, S., Chou, C. A. & Li, J. S. Real-time inference and detection of disruptive EEG networks for epileptic seizures.
Sci. Rep. 10, 8653. https://doi.org/10.1038/s41598-020-65401-6 (2020).
13. Siddiqui, M. K., Morales-Menendez, R., Huang, X. & Hussain, N. A review of epileptic seizure detection using machine learning
classifiers. Brain. Inform. 7, 5. https://doi.org/10.1186/s40708-020-00105-1 (2020).
14. Hundman, K., Constantinou, V., Laporte, C., Colwell, I. & Soderstrom, T. Detecting spacecraft anomalies using LSTMs and non-
parametric dynamic thresholding. arXiv e-prints, arXiv:1802.04431. https://ui.adsabs.harvard.edu/abs/2018arXiv180204431H
(2018).
15. Hasan, M., Choi, J., Neumann, J., Roy-Chowdhury, A. K. & Davis, L. S. learning temporal regularity in video sequences. arXiv
e-prints, arXiv:1604.04574. https://ui.adsabs.harvard.edu/abs/2016arXiv160404574H (2016).
16. Chong, Y. S. & Tay, Y. H. Abnormal event detection in videos using spatiotemporal autoencoder. arXiv e-prints, arXiv:1701.01546
(2017).
17. Karayiannis, N. B. et al. Automated detection of videotaped neonatal seizures of epileptic origin. Epilepsia 47, 966–980. https://
doi.org/10.1111/j.1528-1167.2006.00571.x (2006).
18. Ogura, Y. et al. A neural network based infant monitoring system to facilitate diagnosis of epileptic seizures. Conf. Proc. IEEE Eng.
Med. Biol. Soc. 2015, 5614–5617. https://doi.org/10.1109/EMBC.2015.7319665 (2015).
19. Baumgartner, C. & Koren, J. P. Seizure detection using scalp-EEG. Epilepsia 59(Suppl 1), 14–22. https://doi.org/10.1111/epi.14052
(2018).
20. Qu, H. & Gotman, J. Improvement in seizure detection performance by automatic adaptation to the EEG of each patient. Electro-
encephalogr. Clin. Neurophysiol. 86, 79–87. https://doi.org/10.1016/0013-4694(93)90079-b (1993).
21. Shoeb, A. et al. Patient-specific seizure onset detection. Epilepsy Behav. 5, 483–498. https://doi.org/10.1016/j.yebeh.2004.05.005
(2004).
22. Khamis, H., Mohamed, A. & Simpson, S. Seizure state detection of temporal lobe seizures by autoregressive spectral analysis of
scalp EEG. Clin. Neurophysiol. 120, 1479–1488. https://doi.org/10.1016/j.clinph.2009.05.016 (2009).
23. Chavakula, V. et al. Automated quantification of spikes. Epilepsy Behav. 26, 143–152. https://doi.org/10.1016/j.yebeh.2012.11.048
(2013).
24. Siuly, S., Kabir, E., Wang, H. & Zhang, Y. Exploring sampling in the detection of multicategory EEG signals. Comput. Math. Methods
Med. 2015, 576437. https://doi.org/10.1155/2015/576437 (2015).
25. Asif, U., Roy, S., Tang, J. & Harrer, S. SeizureNet: Multi-spectral deep feature learning for seizure type classification. arXiv e-prints,
arXiv:1903.03232. https://ui.adsabs.harvard.edu/abs/2019arXiv190303232A (2019).
26. Jing, J. et al. Development of expert-level automated detection of epileptiform discharges during electroencephalogram interpreta-
tion. JAMA Neurol. https://doi.org/10.1001/jamaneurol.2019.3485 (2019).
27. Wilson, S. B., Scheuer, M. L., Emerson, R. G. & Gabor, A. J. Seizure detection: Evaluation of the Reveal algorithm. Clin. Neuro-
physiol. 115, 2280–2291. https://doi.org/10.1016/j.clinph.2004.05.018 (2004).
28. Kelly, K. M. et al. Assessment of a scalp EEG-based automated seizure detection system. Clin. Neurophysiol. 121, 1832–1843.
https://doi.org/10.1016/j.clinph.2010.04.016 (2010).
29. Hopfengartner, R., Kerling, F., Bauer, V. & Stefan, H. An efficient, robust and fast method for the offline detection of epileptic
seizures in long-term scalp EEG recordings. Clin. Neurophysiol. 118, 2332–2343. https://doi.org/10.1016/j.clinph.2007.07.017
(2007).
30. Hartmann, M. M. et al. EpiScan: Online seizure detection for epilepsy monitoring units. Annu. Int. Conf. IEEE Eng. Med. Biol. Soc.
2011, 6096–6099. https://doi.org/10.1109/IEMBS.2011.6091506 (2011).
Acknowledgements
The authors thank Amy Zhong, MA for her work on the illustrations in this study; used with permission from
Mount Sinai Health System.
Author contributions
M.L.M., C.S., and E.K.O. designed and conceptualized the study and analyzed the data. A.B.C., F.P. and S.G.
acquired the data. A.A.V., A.B.C., S.Z., F.P., S.G., and K.R. interpreted the data. M.L.M., A.A.V., C.S., and E.K.O.
drafted the manuscript for intellectual content with feedback from all authors.
Competing interests
The authors declare no competing interests.
Additional information
Correspondence and requests for materials should be addressed to K.R. or E.K.O.
Reprints and permissions information is available at www.nature.com/reprints.
Scientific Reports | (2021) 11:7482 | https://doi.org/10.1038/s41598-021-86891-y 10
Vol:.(1234567890)www.nature.com/scientificreports/
Publisher’s note Springer Nature remains neutral with regard to jurisdictional claims in published maps and
institutional affiliations.
Open Access This article is licensed under a Creative Commons Attribution 4.0 International
License, which permits use, sharing, adaptation, distribution and reproduction in any medium or
format, as long as you give appropriate credit to the original author(s) and the source, provide a link to the
Creative Commons licence, and indicate if changes were made. The images or other third party material in this
article are included in the article’s Creative Commons licence, unless indicated otherwise in a credit line to the
material. If material is not included in the article’s Creative Commons licence and your intended use is not
permitted by statutory regulation or exceeds the permitted use, you will need to obtain permission directly from
the copyright holder. To view a copy of this licence, visit http://creativecommons.org/licenses/by/4.0/.
© The Author(s) 2021
Scientific Reports | (2021) 11:7482 | https://doi.org/10.1038/s41598-021-86891-y 11
Vol.:(0123456789)You can also read