Deep Attentive Learning for Stock Movement Prediction From Social Media Text and Company Correlations
←
→
Page content transcription
If your browser does not render page correctly, please read the page content below
Deep Attentive Learning for Stock Movement Prediction
                From Social Media Text and Company Correlations
                   Ramit Sawhney*                                    Shivam Agarwal*
          Netaji Subhas Institute of Technology                 Manipal Institute of Technology
            ramits.co@nsit.net.in                                shivamag99@gmail.com

                    Arnav Wadhwa                                     Rajiv Ratn Shah
                   MIDAS, IIIT Delhi                                    IIIT Delhi
                arnavw96@gmail.com                              rajivratn@iiitd.ac.in

                       Abstract                             2013). However, price signals alone fail to capture
                                                            market surprises and impacts of sudden unexpected
    In the financial domain, risk modeling and              events. Social media texts like tweets can have
    profit generation heavily rely on the sophisti-
                                                            huge impacts on the stock market. For instance,
    cated and intricate stock movement prediction
    task. Stock forecasting is complex, given the           US President Donald Trump shared tweets express-
    stochastic dynamics and non-stationary behav-           ing negative sentiments against Lockheed Martin,
    ior of the market. Stock movements are in-              which led to a loss of around $5.8 Billion to the
    fluenced by varied factors beyond the conven-           company’s market capitalization.1
    tionally studied historical prices, such as social         The Efficient Market Hypothesis (EMH)
    media and correlations among stocks. The ris-           (Malkiel, 1989) states that financial markets are
    ing ubiquity of online content and knowledge
                                                            informationally efficient, such that stock prices re-
    mandates an exploration of models that factor
    in such multimodal signals for accurate stock
                                                            flect all known information. Existing works (Sec.
    forecasting. We introduce an architecture that          2) mainly focus on subsets of stock relevant data.
    achieves a potent blend of chaotic temporal             Although useful, they do not jointly optimize learn-
    signals from financial data, social media, and          ing over modalities like social media text and inter
    inter-stock relationships via a graph neural            stock relations limiting their potential to capture a
    network in a hierarchical temporal fashion.             broader scope of stock movement affecting data,
    Through experiments on real-world S&P 500               as we show in Sec. 6. Multimodal stock predic-
    index data and English tweets, we show the
                                                            tion involves multiple challenges (Hu et al., 2018).
    practical applicability of our model as a tool
    for investment decision making and trading.             Both price signals and tweets exhibit sequential
                                                            context dependencies, where singular samples may
1   Introduction                                            not be informative enough but can be considered a
                                                            sequence for a unified context. Tweets often have
  Stock prices have an intrinsically volatile and           diverse influence on stock prices, based on their
non-stationary nature, making their rise and fall           intrinsic content, such as breaking news as opposed
hard to forecast (Adam et al., 2016). Investment            to noise like vague comments. Fusing multiple
in stock markets involves a high risk regarding             modalities of vast stock related data generated with
profit-making. Prices are driven by diverse fac-            varying characteristics (frequency, noise, source) is
tors that include but are not limited to company            complex and mandates the careful design of joint
performance (Anthony and Ramesh, 1992), histori-            optimization over modality-specific components.
cal trends (Kohara et al., 1997), investor sentiment           Building on the EMH and prior work (Sec. 2),
(Neal and Wheatley, 1998). Uninformed trading               we propose MAN-SF: Multipronged Attention Net-
decisions can leave traders and investors prone to          work for Stock Forecasting that jointly learns from
financial risk and experience monetary losses. On           historical prices, social media, and inter stock rela-
the contrary, careful investment choices can maxi-          tions. MAN-SF through hierarchical attention cap-
mize profits (de Souza et al., 2018). Conventional          tures relevant signals across diverse data to train a
research focused on time series and technical anal-         Graph Attention Network (GAT) for stock predic-
ysis of a stock, i.e., using patterns from historical       tion (Sec. 3). MAN-SF (Sec. 4) jointly learns from
price signals to forecast stock movements (B et al.,           1
                                                                 https://medium.com/scoop-markets/7-tweets-which-
    * Equal contribution.                                   wiped-40-billion-off-the-stock-market

                                                         8415
      Proceedings of the 2020 Conference on Empirical Methods in Natural Language Processing, pages 8415–8426,
                       November 16–20, 2020. c 2020 Association for Computational Linguistics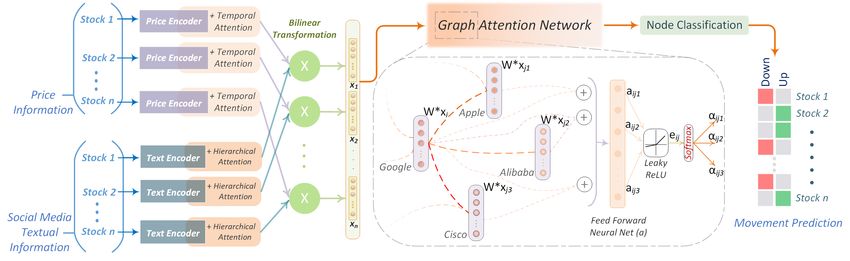
price and tweets over graph-based models for stock          Despite the popularity of NLP and graph-based
prediction. Through varied experiments (Sec. 5),         stock prediction, multimodal methods that capture
we show the predictive power of MAN-SF along             inter stock relations and market sentiment through
with profitability analysis (Sec. 6) and qualitatively   linguistic cues are seldom explored. Jue Liu (2019)
analyze MAN-SF in high risk scenarios (Sec. 7).          combines feature extraction from news sentiment
                                                         scores, financial information (price-earnings ra-
2   Related Work                                         tio, etc.) along with knowledge graph embed-
                                                         dings through TransR. However, such existing ap-
Predicting stock movements spans multiple do-            proaches (Deng et al., 2019) are unable to represent
mains (Jiang, 2020); 1) theoretical: quantitative        textual signals from social media and prices tem-
models like Modern Portfolio Theory (Elton et al.,       porally, as they only utilize sentiment scores and
2009), Black-Scholes model (Black and Scholes,           do not account for stock correlations. To cover this
1973), etc. and, 2) practical: investment strategies     gap in prior research, MAN-SF captures a broader
(Blitz and Van Vliet, 2007), portfolio management        set of features as opposed to both conventional TA
(Hocquard et al., 2013), and beyond the world of         and FA that singularly focus on either text or graph
finance (Erb et al., 1994; Rich and Tracy, 2004).        modalities, but not both together.
Financial models conventionally focused on tech-
nical analysis (TA) relying only on numerical fea-       3   Problem Formulation
tures like past prices (Ding and Qin, 2019; Nguyen
                                                         MAN-SF’s main objective is to learn temporally
et al., 2019) and macroeconomic indicators like
                                                         relevant information jointly from tweets and histor-
GDP (Hoseinzade et al., 2019). Such TA methods
                                                         ical price signals and make use of corporate rela-
include discrete: GARCH (Bollerslev, 1986), con-
                                                         tions among stocks to predict movements. Follow-
tinuous (Andersen, 2007), and neural approaches
                                                         ing Xu and Cohen (2018), we formalize movement
(Nguyen and Yoon, 2019; Nikou et al., 2019).
                                                         based on the difference between the adjusted clos-
   Newer models based on the EMH that are cate-
                                                         ing prices of the stock s ∈ S on trading days d and
gorized under fundamental analysis (FA) (Dichev
                                                         d − 1. We formulate stock movement prediction as
and Tang, 2006), account for stock affecting factors
                                                         a binary classification problem.
beyond numerical ones such as investor sentiment
through news, etc. Work in natural language pro-         Problem Statement: Given stock s ∈ S, and
cessing (NLP) from sources such as news (Hu et al.,      historical price data and tweets for stock s over a
2018), social media data (Xu and Cohen, 2018),           lookback window of T days over the day range
earnings calls (Qin and Yang, 2019; Sawhney et al.,      [t − T, t − 1], we define the price movement of
2020b) shows the merit of FA in capturing mar-           stock s from day t − 1 to t as:
ket sentiment, surprises, mergers, acquisitions that
                                                                               0, pcd < pcd−1

traditional TA based methods fail to account. A                         Yt =                             (1)
limitation of existing NLP methods for stock pre-                              1, pcd ≥ pcd−1
diction is that they assume stock movements to be
                                                         where pcd represents the widely used (Yang et al.,
independent of each other, contrary to true market
                                                         2020; Qin and Yang, 2019) adjusted closing price2
function (Diebold and Yilmaz, 2014). This assump-
                                                         of a given stock on day t. Here, 0 represents a price
tion hinders NLP centric FA’s ability to learn latent
                                                         downfall, and 1 represents a rise in the price.
patterns for the study of interrelated stocks.
   Another line of FA revolves around employing          4   MAN-SF: Components and Learning
graph-based methods to improve TA (e.g., price-
based models) by augmenting them with inter              In this section, we first give an overview of MAN-
stock relations (Feng et al., 2019b; Sawhney et al.,     SF, followed by a detailed explanation of each com-
2020a). Matsunaga et al. (2019) combine historical       ponent. As shown in Figure 1, MAN-SF first en-
prices with stock graphs through Graph Convolu-          codes market data for each stock over a fixed pe-
tion Networks (GCNs), outperforming price-only           riod. Formally, we encode stock features xt ∈ Rw
models. Similarly, Kim et al. (2019) further im-         for each trading day t as, xt = B(ct , qt ); where,
prove graph neural network methods by weighing           ct ∈ Ru represents a social media feature that we
stock relations through attention mechanisms, as           2
                                                             Source: https://www.investopedia.com/
not all stock movements are equally correlated.          terms/a/adjusted_closing_price.asp

                                                     8416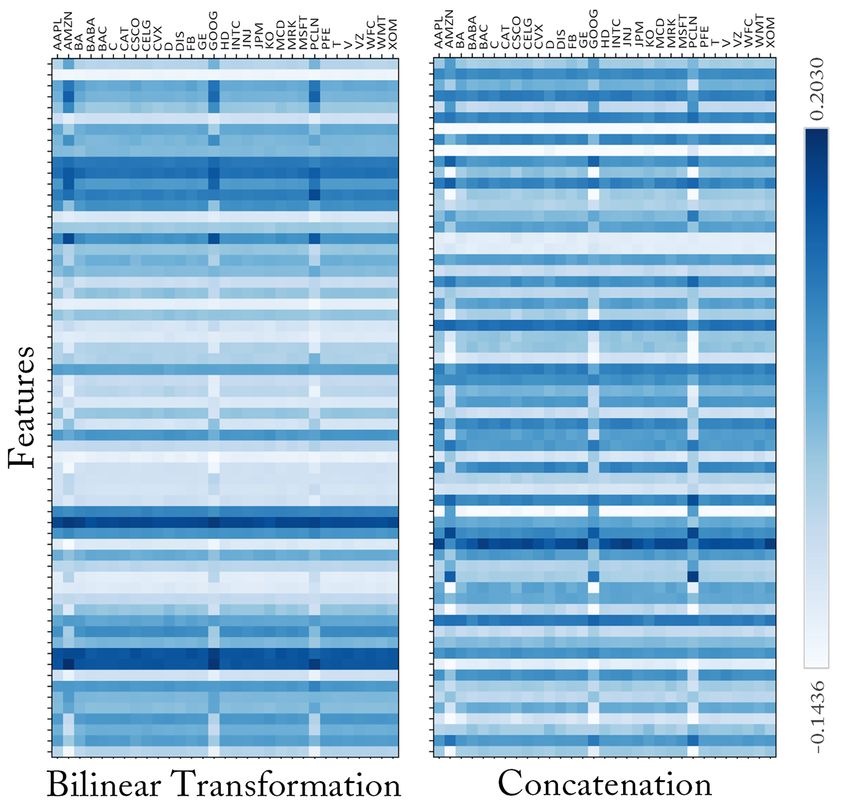
Figure 1: An overview of MAN-SF: Encoding Mechanisms, GAT Mechanism, Joint Optimization.

                                                          where, pi ∈ Rdp is the price vector on day i for
                                                          each stock s in the lookback. The raw price vector,
                                                          pi = [pci , phi , pli ] comprises of a stock’s adjusted
                                                          closing price, highest price and lowest price for a
                                                          trading day i. Since it is the price change that deter-
                                                          mines the stock movement rather than the absolute
                                                          price value, we normalize it with its last adjusted
                                                          closing price, pi = pi /pci−1 .
                                                             It has been shown that the stock trend of each
      Figure 2: An overview of the Price Encoder.         day has a different impact on stock trend prediction
                                                          (Feng et al., 2019a). Towards this end, we employ
                                                          temporal attention ζ(·) (Li et al., 2018) that learns
obtain by encoding tweets over the lag window for
                                                          to weigh critical days and forms an aggregated
each stock s ∈ S = {s1 , s2 , . . . sS }. Similarly,
                                                          feature representation across all hidden states of
qt ∈ Rv are the features obtained from historical
                                                          the GRU (Qin et al., 2017). The temporal attention
prices for a stock in the lag window. We detail
                                                          mechanism yields qt = ζ(hp ); where, hp ∈ Rdp ×T
these encoders first, and then explain the fusion
                                                          is the concatenated hidden states of GRUp for each
B(·) over ct and qt to obtain xt ∈ Rw . We then
                                                          stock s. This temporal attention mechanism ζ(·)
describe the graph to represent the inter stock re-
                                                          rewards days with more impactful information and
lations. Lastly, we explain the GAT to which the
                                                          aggregates it from all days in the lag window to
fused feature vector xt is passed to propagate fea-
                                                          produce price features qt ∈ Rv .
tures based on inter-stock relations along with the
joint optimization of MAN-SF.                             Temporal Attention We use a temporal atten-
                                                          tion mechanism that is a form of additive attention
4.1    Price Encoder                                      (Bahdanau et al., 2014). The mechanism ζ(·) ag-
Technical Analysis shows that historical price infor-     gregates all the hidden representations of the GRU
mation is a strong indicator of future trends (Jean-      across different time-steps into an overall represen-
blanc et al., 2009). Therefore, price data from each      tation with learned adaptive weights (Feng et al.,
day is a crucial input to MAN-SF. The Price En-           2019a). We formulate this mechanism ζ(·) as:
coder shown in Figure 2 encodes historical stock
price movements to produce price feature, qt . It                             exp (hTi W hz )
                                                                      βi = PT                                (3)
                                                                                        T
takes in a per-day price feature from the lookback                           i=1 exp (hi W hz )
of T days and encodes the temporal trend in prices.                                X
To capture such sequential dependencies across                            ζ(hz ) =     βi hi                 (4)
                                                                                       i
trading days, we use a Gated Recurrent Unit (GRU)
(Cho et al., 2014; Giles et al., 2001). The output of        where, hz ∈   RT ×dm denotes the concatenated
the GRU on day i is denoted by:                           hidden states of the GRU. βi represents the learned
                                                          attention weights for trading day i, and W is a
      hi = GRUp (pi , hi−1 ) t − T ≤ i ≤ t          (2)   learnable parameter matrix.

                                                      8417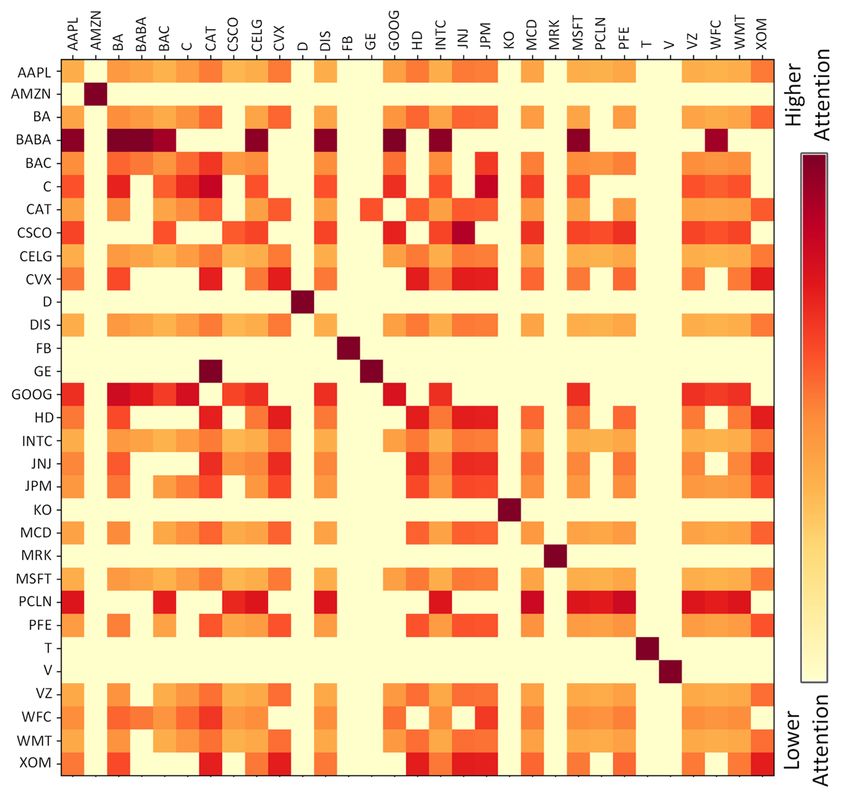
2002). For each tweet, we obtain a representa-
                                                           tion using the Tweet Embedding layer (USE) as
                                                           [m1 , m2 , . . . mK ] where mj ∈ Rd and K is the
                                                           number of tweets per stock on day i. To model the
                                                           sequence of tweets within a day, we use a GRU.
                                                           For stock s on each day i:

                                                                  hj = GRUm (mj , hj−1 ); j ∈ [1, K]       (5)

                                                           The influence of online tweets on the market can
                                                           vary greatly (Hu et al., 2018). To identify tweets
                                                           that are likely to have a more substantial influence
                                                           on the market, we use an intraday tweet level atten-
      Figure 3: Social Media Information Encoder.          tion. For each stock s on each day i the mechanism
                                                           can be summarized as:

4.2    Social Media Information Encoder (SMI)                                exp (hTj W hm )
                                                                      γj = PK                              (6)
                                                                                       T
Xu and Cohen (2018) suggest that tweets not only                            j=1 exp (hj W hm )
convey factual data, but also portray user sentiment                                X
towards stocks that influence financial prediction                           ri =       γj hj              (7)
(Bollen et al., 2011). A variety of market factors                                  j

beyond historical prices drive stock trends (Abu-          where, hm ∈ RK×dm denotes a concatenation of
Mostafa and Atiya, 1996). With the rising ubiquity         all hidden states from GRUm and dm is the di-
of the Internet, social media platforms, such as           mension of each hidden state. γj represents the
Twitter, influence investors to follow market trends       attention weights and ri represents the features ob-
(Tetlock, 2007; Hu et al., 2018). Tweets not only          tained from several published tweets on day i for
convey factual information but also portray user           each stock s. W is a learned linear transformation.
sentiment towards stocks (Xu and Cohen, 2018;
Fung et al., 2002). To this end, MAN-SF uses the           Learning Representations across days Analyz-
SMI encoder to extract a feature vector ct using           ing a temporal sequence of tweets and combining
tweets. The encoder shown in Figure 3 extracts             them can provide a more reliable assessment of
social media features, ct , by first encoding tweets       market trends (Zhao et al., 2017). We learn a so-
for a day and then over multiple days using a hier-        cial media representation from the sequence of day
archical attention mechanism (Yang et al., 2016).          level tweet representations ri . This feature vector
                                                           encodes all the information in a lookback window.
Tweet Embedding For any given tweet tw , we                We then feed temporal day level tweet vectors to a
generate an embedding vector m ∈ Rd . We ex-               GRU for sequential modeling given by:
plored word and sentence level embedding methods
to learn tweet representations: Global Vectors for             hi = GRUs (ri , hi−1 )    t−T ≤i≤t          (8)
Word Representation (GloVe) (Pennington et al.,
2014), Fasttext (Joulin et al., 2017), and Universal       where, hi summarizes the tweets on day i for stock
Sentence Encoders (USE) (Cer et al., 2018). Empir-         s as well as tweets from preceding days while fo-
ically, sentence-level embeddings generated using          cusing on day i. Like historical prices, tweets from
a deep averaging network encoder variant of the            each day have a different impact on stock move-
USE3 gave us the most promising results. Thus,             ments. Hence, the previously described temporal
we encode each tweet tw using USE.                         attention mechanism used for historical prices is
                                                           also used for social media. This mechanism learns
Learning Representations for one day On any                a procedure to aggregate impactful information to
day i, a variable number tweets [tw1 , tw2 , . . . twK ]   form SMI features ct over a lookback of T days
for each stock s are posted, and these cap-                for each stock s. The temporal attention mecha-
ture and influence the stock trends (Fung et al.,          nism yields ct = ζ(hs ); hs ∈ RT ×ds represents
  3
    Implementation used: https://tfhub.dev/                the concatenated hidden states of GRUs and ds is
google/universal-sentence-encoder/2                        the size of output space of the GRU. This temporal

                                                      8418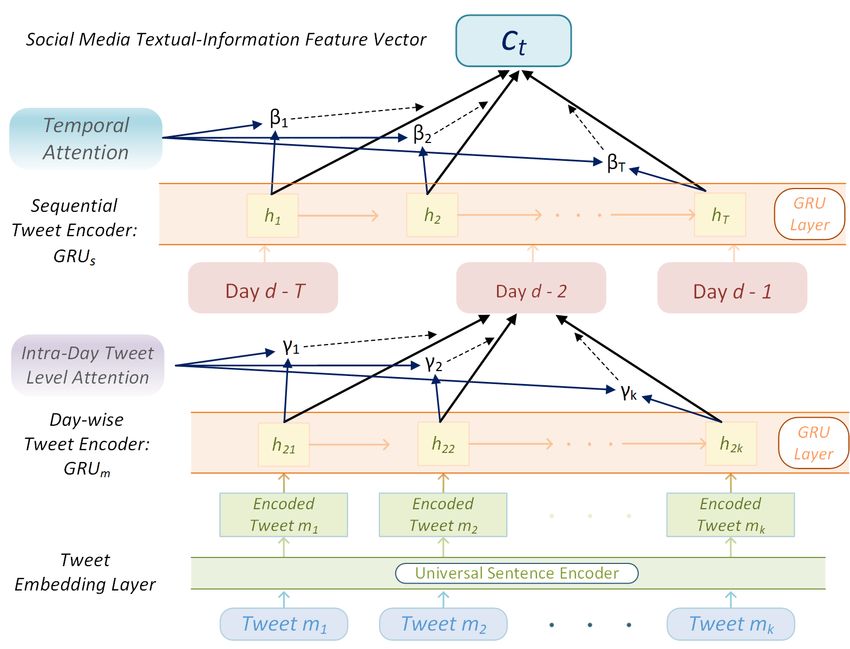
attention ζ(·), along with the intraday tweet-level     and Y. R1, R2, and R3, defined in Wikidata, are
attention, forms a hierarchical attention mechanism.    different types of entity-relations. For instance,
This mechanism captures the fact that tweets are        Wells Fargo and Bank of America are related to
differently informative and have varied impacts dur-    Berkshire Hathaway via a first-order company rela-
ing different market phases. The obtained SMI and       tion ”owned by.” Another example is Microsoft and
price features for each stock are then blended to       Berkshire Hathaway that are related through Bill
obtain a joint representation.                          Gates (second-order relation: ”owned by” - ”is a
                                                        board member of”) since Bill Gates possesses own-
4.3    Blending Multimodal Information                  ership over Microsoft and is a Board member of
Signals from different modalities often carry com-      Berkshire Hathaway. We define the stock relation
plementary information about different events in        network as a graph G(S, E) where S denotes the
the market (Robert P. Schumaker, 2019). Direct          set of nodes, and E is the set of edges. Each node
concatenation treats information from Price and         s ∈ S represents a stock, and two stocks s1 , s2 ∈ S
SMI encoders equally (Li et al., 2016). Further-        are joined by an edge e ∈ E if s1 , s2 are linked by
more, the interdependencies between price and           a first or second-order relation.
tweets are not appropriately captured, damping the
framework’s capacity to learn their correlations to     Graph Attention Graph-based representation
market trends (Li et al., 2014). We use a bilinear      learning through graph neural networks can be con-
transformation that learns the pairwise feature in-     sidered as information exchange between related
teractions from historical price features and tweets.   nodes (Gilmer et al., 2017). As each stock has a
Formally, qt ∈ Rv and ct ∈ Ru are obtained from         different degree of influence on another stock, it is
the Price Encoder and SMI Encoder, respectively.        essential that the graph encoding suitably weighs
The output xt ∈ Rw is given by:                         more relevant relations between stocks. To this end,
                                                        we use graph attention networks (GATs), which
      xt = B(ct , qt , ) = ReLU (qtT W ct + b)   (9)    are graph neural networks with node-level atten-
                                                        tion (Veličković et al., 2017).
where, W ∈ Rw×v×u is the weight matrix, and
                                                           We first describe a single GAT layer that is
b ∈ Rw is the bias. Methods like direct mean and
                                                        used throughout the GAT component. The in-
attention-based aggregation (Bahdanau et al., 2014)
                                                        put to the GAT is a set of stock (node) features,
do not account for pair-wise interactions as shown
                                                        h = [x1 , x2 , . . . x|S| ], where xi is the encoded
in the results (Sec. 6). Other methods like fac-
                                                        multi-modal market information (Sec. 4.3). The
torized bilinear pooling (Yu et al., 2017), reduce
                                                        GAT layer produces an updated set of of node fea-
computational complexity; however, we empiri-                                                      0
                                                        tures h0 = [z1 , z2 , . . . z|S| ]; zi ∈ Rw based on the
cally find that the generalized bilinear layer out-
                                                        GAT mechanism (shown in Figure 1). We first
performs these techniques. This layer learns an
                                                        apply a shared linear transform parameterized by
optimum blend of features from prices and tweets                  0
                                                        W ∈ Rw ×w to all the nodes. Then, we apply a
in a translationally invariant manner.
                                                        shared self-attention mechanism to each node i in
4.4    Graph Attention Network (GAT)                    its immediate neighborhood Ni . For each node
Stocks are often interlinked with one another, and      j ∈ Ni , we compute normalized attention coeffi-
thus, we model stocks and their relations as a graph.   cients αij representing the importance of relations
                                                        among stocks i and j. Formally, αij is given as:
Graph Creation Following Feng et al. (2019b),
we make use of Wiki company-based relations. Us-
ing Wikidata4 , we extract first and second-order re-         exp (LeakyReLU (aTw [W xi ⊕ W xj ]))
                                                        αij = P
lations between the company stocks in the S&P 500               exp (LeakyReLU (aTw [W xi ⊕W xk ]))
                                               R1             k∈Ni
index. A first-order relation is defined as X −→ Y                                                   (10)
where X and Y denote entities in Wikidata that          where, .T and ⊕ represent transpose and concatena-
                                                                                    0
correspond to the two stocks. A second-order re-        tion respectively. aw ∈ R2w is a learnable weight
                         R2       R3
lation is defined by X −→ Z ←− Y where Z de-            matrix of a single layer feed forward neural net-
notes another entity connecting the two entities X      work. The learned attention coefficients αij are
  4
    https://www.wikidata.org/wiki/                      used to weigh and aggregate feature vectors from
Wikidata:List_of_properties/all                         neighboring with a non-linearity σ. The updated

                                                   8419
node feature vector zi is given as: training, 01/08/2015 to 30/09/2015 for validation,
and 01/10/2015 to 01/01/2016 for testing. Follow-
X ing Xu and Cohen (2018), we align trading days by
zi = σ αij W xj (11) dropping samples that lack either prices or tweets,
j∈Ni
and further align the data across trading windows
We use multi-head attention to stabilise training for related stocks to ensure data is available for all
(Vaswani et al., 2017). Formally, U independent trading days in the window for all stocks. The hid-
executors apply the above attention mechanism. den size of all GRUs is 64, and the USE embedding
Their output features are concatenated to yield: dimension is 512. We use U = 8 attention heads
for both GAT layers. We use the Adam optimizer
M U X with a learning rate set to 5e−4 and train MAN-SF
k
zi = σ αij W k xj (12) for 10, 000 epochs. It takes 3hrs to train and test
k=1 j∈Ni MAN-SF on Tesla K80 GPU. We use early stop-
ping based on Matthew’s Correlation Coefficient
where, αijk and W k denote normalised attention
(MCC) taken over the validation set.
coefficients and linear transformation parameter
matrix computed by the k th attention mechanism. 5.2 Evaluation
We use a two-layer GAT, the first layer is fol- Following prior research for stock prediction (Ding
lowed by Exponential Linear Unit (Clevert et al., et al., 2014; Xu and Cohen, 2018), we use accuracy,
2015), and the second layer outputs a vector yi F1 score, MCC (implementations from sklearn6 )
for each stock i, which is then used to classify for classification performance. We use MCC be-
the stock’s future price movements. MAN-SF is cause, unlike the F1 score, MCC avoids bias due to
trained using the Adam optimiser by optimizing data skew as it does not depend on the choice of the
the cross-entropy loss, given as: positive class and accounts forthe TrueNegatives.
tp f n
|S| For a given confusion matrix :
X f p tn
Lcse = − Yi ln(yi ) + (1 − Yi ) ln(1 − yi ) (13)
i=1 tp × tn − f p × f n
MCC = p (14)
(tp + f p)(tp + f n)(tn + f p)(tn + f n)
where, Yi is the true price movement of stock i.
Like prior work (Kim et al., 2019; Feng et al.,
5 Experiments 2019b), to evaluate MAN-SF’s applicability to real-
5.1 Dataset and Training Setup world trading, we assess its profitability on the
test data of the S&P 500 index using two metrics:
We adopt the StockNet dataset (Xu and Cohen, Cumulative Profit and Sharpe Ratio (Sharpe, 1994).
2018) for the training and evaluation of MAN-SF. We follow a trading strategy where, if MAN-SF
The dataset contains data of high-trade-volume predicts a rise in a stock’s value the next day, then
stocks in the S&P 500 index in the NYSE and one share of that stock is bought (long position) at
NASDAQ markets. Stock specific tweets are ex- the closing price of the current trading session and
tracted using regex queries made out of NASDAQ sold on the next day’s closing price. Otherwise,
ticker symbols, for instance, $AMZN for Ama- if the strategy speculates a fall in price, a short
zon. The price data has been obtained from Ya- sell7 is performed. We compute the cumulative
hoo Finance5 . We shift a 5-day lag window along profit (Krauss, 2018) earned as:
the trading days to generate samples. We label
X pti − pt−1
the samples according to the movement percent- Profitt = i
t−1
(−1)Actioni (15)
t−1
age of the closing price such that those ≥ 0.55% i∈S
p i
and ≤ −0.5% are labeled positive and negative
where, S denotes the set of stocks, pti denotes the
samples, respectively. This leaves us with 26, 614
price of stock i at day t. Actiont−1 i is a binary
samples divided as 49.78% and 50.22% in the two
value [0, 1]. The Actiont−1
i is 0 if the long position
classes. We temporally split the dataset in a ra-
is taken at time t for stock i; otherwise it is 1.
tio of Train:Validation:Test in 70:10:20, leaving us
6
with date ranges from 01/01/2014 to 31/07/2015 for sklearn: https://scikit-learn.org
7
Short sell: https://en.wikipedia.org/wiki/
5
https://finance.yahoo.com/industries Short_(finance)
8420Model F1 ↑ Accuracy ↑ MCC ↑
RAND 0.502 ± 8e−4 0.509 ± 8e−4 −0.002 ± 1e−3
TA ARIMA (Brown, 2004) 0.513 ± 1e−3 0.514 ± 1e−3 −0.021 ± 2e−3
Selvin et al. (2017) 0.529 ± 5e−2 0.530 ± 5e−2 −0.004 ± 7e−2
RandForest (Venkata Sasank Pagolu, 2016) 0.527 ± 2e−3 0.531 ± 2e−3 0.013 ± 4e−3
TSLDA (Nguyen and Shirai, 2015) 0.539 ± 6e−3 0.541 ± 6e−3 0.065 ± 7e−3
HAN (Hu et al., 2018) 0.572 ± 4e−3 0.576 ± 4e−3 0.052 ± 5e−3
StockNet - TechnicalAnalyst (Xu and Cohen, 2018) 0.546 ± − 0.550 ± − 0.017 ± −
StockNet - FundamentalAnalyst (Xu and Cohen, 2018) 0.572 ± − 0.582 ± − 0.072 ± −
StockNet - IndependentAnalyst (Xu and Cohen, 2018) 0.573 ± − 0.575 ± − 0.037 ± −
FA StockNet - DiscriminativeAnalyst (Xu and Cohen, 2018) 0.559 ± − 0.562 ± − 0.056 ± −
StockNet - HedgeFundAnalyst (Xu and Cohen, 2018) 0.575 ± − 0.582 ± − 0.081 ± −
HATS (Kim et al., 2019) 0.560 ± 2e−3 0.562 ± 2e−3 0.117 ± 6e−3
Chen et al. (2018) 0.530 ± 7e−3 0.532 ± 7e−3 0.093 ± 9e−3
Adversarial LSTM (Feng et al., 2019a) 0.570 ± − 0.572 ± − 0.148 ± −
MAN-SF (This work) 0.605 ± 2e−4 0.608 ± 2e−4 0.195 ± 6e−4
Table 1: Results compared with baselines. Bold shows the best results. Green is indicative of higher performance.
TA and FA represent Technical Analysis and Fundamental Analysis models, respectively.
The Sharpe Ratio is a measure of the return of • HAN: A hierarchical attention mechanism to
a portfolio compared to its risk. We calculate the encode textual information during a day and
Sharpe ratio by computing the ratio of the expected across multiple days (Hu et al., 2018).
return Ra of a portfolio to its standard deviation as:
• StockNet: A variational Autoencoder (VAE)
E[Ra ] that uses price and text information. Text is
Sharpe Ratioa = (16)
std[Ra ] encoded using hierarchical attention during
and across days. Price features are modeled
5.3 Baselines
sequentially (Xu and Cohen, 2018). We com-
We compare MAN-SF with the below baselines pare with all five variants of StockNet.
spanning both technical and fundamental analysis.
• HATS: A hierarchical graph attention method
Technical Analysis: These methods uses only that uses a multi-graph to weigh different rela-
historical price information. tionships between stocks. It uses only histori-
cal price data (Kim et al., 2019).
• RAND: Random guess as price rise or fall.
• ARIMA: Autoregressive Integrated Moving • Chen et al. (2018): GCNs to model inter
Average models historical prices as a non- stock relations with only historical price data.
stationary time series (Brown, 2004).
6 Results and Analysis
• Selvin et al. (2017): Three deep neural archi-
tectures (RNN, CNN and LSTM) using prices. We now discuss the experimental results and some
We compare with the best performing LSTM. findings with their financial implications.
Performance Comparison Table 1 shows the
Fundamental Analysis: These methods use
performance of the compared methods on Stock-
other modalities such as text information and com-
Net’s test data split from 01/10/2015 to 31/12/2015
pany relationships along with historical prices.
on the S&P 500 index averaged over ten differ-
• RandForest: Random Forests classifier ent runs. Using a learned blend of historical price
trained over word2vec (Mikolov et al., 2013) and tweets using corporate relationships, MAN-
embeddings for tweets. SF achieves the best performance, outperforming
the strongest baselines, StockNet, and Adversarial
• TSLDA: Topic Sentiment Latent Dirichlet Al- LSTM. We also note that Fundamental Analysis
location model is a generative model that uses (FA) techniques outperform numerical only Tech-
sentiments and topic modeling on social me- nical Analysis (TA) methods, reiterating the effec-
dia (Nguyen and Shirai, 2015). tiveness of factoring in social media signals and
8421Model Component F1 ↑ MCC ↑ 4 Adv-LSTM Stock-Net
Table 3: Annualized sharpe 3.5
HATS
MAN-SF
MAN-SF (Concat)
LSTM + Historical Price 0.521 0.002 Ratio comparison with 3
GRU + Social Media Text (BERT) 0.539 0.077 baselines. Bold and italics 2.5
GCN + Historical Price 0.532 0.093 2
GRU + Social Media Text (USE) 0.546 0.101
denotes best and second 1.5
GCN + Social Media Text (USE) 0.555 0.102 best results, respectively. 1
0.5
GAT + Historical Price 0.562 0.117
0
MAN-SF (Concatenation) 0.588 0.156 Model Sharpe Ratio↑
15 08
15 18
15 28
15 07
15 17
15 27
15 07
15 17
27
MAN-SF (Attention Fusion) 0.594 0.173
20 10-
20 10-
20 10-
20 11-
20 11-
20 11-
20 12-
20 12-
2-
Stocknet 0.83
-1
-
-
-
-
-
-
-
-
15
MAN-SF (Bilinear Transformation) 0.605 0.195
20
HATS 0.78
MAN-SF 1.05 Figure 6: Cumulative
Table 2: Ablation study over MAN-SF’s components.
profit trend
ships between the two signals leading to a joint
representation that captures more specific features
noticed by areas of concentrated attention as com-
pared to simple concatenation based fusion.
Analyzing Graph Attention We notice that
equally weighing all correlations using GCN-based
(a) Feature fusion maps (b) Graph attention map models leads to smaller performance gains, as
Figure 4: Feature weight heatmaps for MAN-SF
shown in Table 2, as compared to GAT (GAT, and
MAN-SF variants). To analyze this difference, we
first calculate each neighbor’s attention scores in
inter stock relations. These results empirically vali- the stock relations graph, as shown in Figure 4b.
date the effectiveness of multimodal signals due to By analyzing the different stock associations with
a broader capture of stock price influencing infor- the highest and lowest attention scores, we observe
mation, including tweets and other related stocks. that some relations between stocks, such as being
a part of the same industry or having the same
Ablation Study In Table 2, we observe the abil- founder, are more critical than other relations like
ity of price and text models to predict the market stocks having the same country of origin. For in-
trend to an extent using unimodal features. Im- stance, C (CitiCorp) and JPM (JP Morgan) have
provements over individual modalities are noted a relatively high attention score and are a part of
with the inclusion of a graph-based learning model, the same investment and banking industry, whereas
i.e., GCN and GAT validating the premise of us- the attention score for JPM and CSCO (Cisco) is
ing inter stock relations for enhanced forecasting. relatively low. We also observe that some stocks
When the text and price signals are fused, and more share hidden correlations captured by the GAT due
relevant information is extracted using the atten- to the market’s temporal nature. We explain one
tion mechanisms, a performance gain is seen. The such example in Section 7.
ablation study ties up with the EMH, as we add ad-
ditional modalities, we note an increment in MAN- Profitability We examine MAN-SF’s practical
SF’s ability for stock prediction. Two critical obser- applicability through a profitability analysis on real-
vations from Table 2 are the substantial MCC gains world stock data. From Table 3 and Figure 6, we
when using GAT over GCN and the contrast be- note that MAN-SF achieves higher risk-adjusted
tween fusing text and prices via concatenation and returns and an overall profit. MAN-SF outperforms
bilinear transformations. We discuss these next. different baselines over the common testing period
of three months using the stocks data in the S&P
Impact of Bilinear Transformations Bilinear 500 index. These observations show the profitabil-
blending outperforms concatenation, and attention ity of MAN-SF over models that do not capture
fusion variants, as seen in Table 2. We postulate stock correlations (StockNet) and models that do
that the bilinear transformation can better learn the not use the impact of textual data (HATS). We
interplay between the signals compared to other potentially attribute these improvements to MAN-
variants. On examining Figure 4a, we observe that SF’s ability to learn a more concentrated blend of
the bilinear layer blends highly non-linear relation- text and price features as opposed to competitive
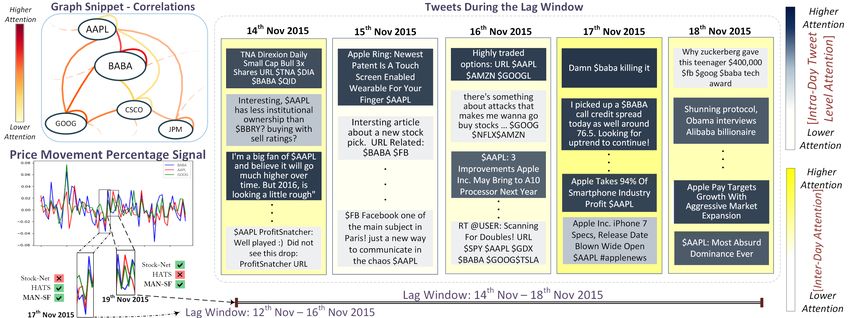
8422Figure 5: Graph sample showing attention weights for stock correlations (top left); Stock price movement depicting
inter-stock relationships (bottom left); Tweets with hierarchical temporal attention weights (right)
models. We extend this analysis in the next section. attention weights during the lookback window,
indicating a possible increase in Apple’s price.
7 Qualitative Analysis MAN-SF uses hierarchical attention mechanisms
We conduct an extended analysis across two high- over tweets and inter-stock correlations correctly.
risk scenarios, as shown in Figure 5, to study the ap- Thereby likely predicting a rise in Apple’s stock
plicability of MAN-SF to investors in the stock mar- price, similar to models such as StockNet. As op-
ket. The study is based on Apple’s (AAPL) trend posed to these, models such as HATS forecast a
during 12th Nov - 18th Nov. Figure 5 shows some continual decrease in Apple’s price, potentially due
of the tweets posted and AAPL’s relations with to not factoring in social media data.
relevant stocks such as Alibaba (BABA), Google
(GOOG), and among others during that period. 8 Conclusion and Future Work
12th Nov to 16th Nov: Failure of StockNet and We study stock movement prediction by using nat-
models that do not capture inter stock relations: ural language, graph-based and numeric features.
From Figure 5, we see from the price movement We propose MAN-SF, a neural model that jointly
that 12th to 16th November 2015 shows a decline in learns temporally relevant signals from chaotic
Apple’s stock price. Here, we observe that Stock- multimodal data spanning historical prices, tweets,
Net predicts a further drop in Apple’s price, and and inter stock correlations in a hierarchical fashion.
similar models that use only price and text are un- Extensive quantitative and qualitative experiments
able to predict the price rise for Apple on 17th on real market data demonstrate MAN-SF’s appli-
November correctly. However, we discover that cability for neural stock forecasting. We plan to
Apple shares a strong relationship with Alibaba further use news articles, earnings calls, and other
and Google during that time, as indicated by the at- data sources to capture market dynamics better. An-
tention weights. MAN-SF incorporates inter-stock other interesting direction of future research is to
relations through graph attention to learn latent cor- explore the cold start problem, where MAN-SF
relations between AAPL, BABA, and GOOG, as could be leveraged to predict stock movements for
shown by the graph snippet in Figure 5. MAN-SF new stocks. Lastly, we would also like to extend
correctly predicts a rise in Apple’s price and makes MAN-SF’s architecture to not be limited to model
a profit, unlike StockNet. We attribute this predic- all stocks together (because of its GAT component)
tion to MAN-SF likely having a broader context by to increase scalability to cross-market scenarios.
blending multimodal signals.
14th Nov to 18th Nov: Failure of HATS and References
models that do not leverage social media data: Yaser S. Abu-Mostafa and Amir F. Atiya. 1996. In-
Despite Apple’s sharp fall on 18th November, we troduction to financial forecasting. Applied Intelli-
see tweets with positive sentiment having higher gence, 6(3):205–213.
8423Klaus Adam, Albert Marcet, and Juan Pablo Nicoli. Djork-Arné Clevert, Thomas Unterthiner, and Sepp
2016. Stock market volatility and learning. The Hochreiter. 2015. Fast and accurate deep network
Journal of Finance, 71(1):33–82. learning by exponential linear units (elus). arXiv
preprint arXiv:1511.07289.
Leif B. G. Andersen. 2007. Efficient simulation of the
heston stochastic volatility model. SSRN Electronic Shumin Deng, Ningyu Zhang, Wen Zhang, Jiaoyan
Journal. Chen, Jeff Z. Pan, and Huajun Chen. 2019.
Knowledge-driven stock trend prediction and expla-
Joseph H Anthony and K Ramesh. 1992. Associa- nation via temporal convolutional network. In Com-
tion between accounting performance measures and panion Proceedings of The 2019 World Wide Web
stock prices. Journal of Accounting and Economics, Conference, WWW ’19, page 678–685, New York,
15(2-3):203–227. NY, USA. Association for Computing Machinery.
Uma Devi B, Sundar D, and Alli P. 2013. An effective Ilia D. Dichev and Vicki Wei Tang. 2006. Earnings
time series analysis for stock trend prediction using volatility and earnings predictability. SSRN Elec-
ARIMA model for nifty midcap-50. International tronic Journal.
Journal of Data Mining & Knowledge Management
Process, 3(1):65–78. F.X. Diebold and K. Yilmaz. 2014. On the network
topology of variance decompositions: Measuring
Dzmitry Bahdanau, Kyunghyun Cho, and Yoshua Ben- the connectedness of financial firms. Journal of
gio. 2014. Neural machine translation by jointly Econometrics, 182(1):119–134. Cited By 416.
learning to align and translate. arXiv preprint
arXiv:1409.0473. Guangyu Ding and Liangxi Qin. 2019. Study on the
prediction of stock price based on the associated net-
Fischer Black and Myron Scholes. 1973. The pricing work model of lstm. International Journal of Ma-
of options and corporate liabilities. Journal of Polit- chine Learning and Cybernetics.
ical Economy, 81(3):637–654.
Xiao Ding, Yue Zhang, Ting Liu, and Junwen Duan.
David C Blitz and Pim Van Vliet. 2007. The volatil- 2014. Using structured events to predict stock price
ity effect. The Journal of Portfolio Management, movement: An empirical investigation. In Proceed-
34(1):102–113. ings of the 2014 Conference on Empirical Methods
in Natural Language Processing (EMNLP), pages
J. Bollen, H. Mao, and X. Zeng. 2011. Twitter mood 1415–1425.
predicts the stock market. Journal of Computational
Science, 2(1):1–8. Cited By 2072. Edwin J Elton, Martin J Gruber, Stephen J Brown, and
William N Goetzmann. 2009. Modern portfolio the-
Tim Bollerslev. 1986. Generalized autoregressive con- ory and investment analysis. John Wiley & Sons.
ditional heteroskedasticity. Journal of Economet-
rics, 31(3):307–327. Claude B Erb, Campbell R Harvey, and Tadas E
Viskanta. 1994. Forecasting international equity cor-
Robert Goodell Brown. 2004. Smoothing, forecasting relations. Financial analysts journal, 50(6):32–45.
and prediction of discrete time series. Courier Cor-
poration. Fuli Feng, Huimin Chen, Xiangnan He, Ji Ding,
Maosong Sun, and Tat-Seng Chua. 2019a. En-
Daniel Cer, Yinfei Yang, Sheng-yi Kong, Nan Hua, hancing stock movement prediction with adversar-
Nicole Limtiaco, Rhomni St John, Noah Constant, ial training. In Proceedings of the Twenty-Eighth
Mario Guajardo-Cespedes, Steve Yuan, Chris Tar, International Joint Conference on Artificial Intel-
et al. 2018. Universal sentence encoder for english. ligence, IJCAI-19, pages 5843–5849. International
In Proceedings of the 2018 Conference on Empirical Joint Conferences on Artificial Intelligence Organi-
Methods in Natural Language Processing: System zation.
Demonstrations, pages 169–174.
Fuli Feng, Xiangnan He, Xiang Wang, Cheng Luo,
Yingmei Chen, Zhongyu Wei, and Xuanjing Huang. Yiqun Liu, and Tat-Seng Chua. 2019b. Temporal
2018. Incorporating corporation relationship via relational ranking for stock prediction. ACM Trans.
graph convolutional neural networks for stock price Inf. Syst., 37(2).
prediction. In Proceedings of the 27th ACM Inter-
national Conference on Information and Knowledge Gabriel Pui Cheong Fung, Jeffrey Xu Yu, and Wai Lam.
Management, CIKM ’18, page 1655–1658, New 2002. News sensitive stock trend prediction. In Ad-
York, NY, USA. Association for Computing Machin- vances in Knowledge Discovery and Data Mining,
ery. pages 481–493. Springer Berlin Heidelberg.
Kyunghyun Cho, Bart Van Merriënboer, Dzmitry Bah- C. Lee Giles, Steve Lawrence, and Ah Chung Tsoi.
danau, and Yoshua Bengio. 2014. On the properties 2001. Noisy time series prediction using a recurrent
of neural machine translation: Encoder-decoder ap- neural network and grammatical inference. Machine
proaches. arXiv preprint arXiv:1409.1259. Learning, 44(1/2):161–183.
8424Justin Gilmer, Samuel S. Schoenholz, Patrick F. Ri- Xiaodong Li, Xiaodi Huang, Xiaotie Deng, and Shan-
ley, Oriol Vinyals, and George E. Dahl. 2017. Neu- feng Zhu. 2014. Enhancing quantitative intra-day
ral message passing for quantum chemistry. In stock return prediction by integrating both market
Proceedings of the 34th International Conference news and stock prices information. Neurocomput-
on Machine Learning - Volume 70, ICML’17, page ing, 142:228–238.
1263–1272. JMLR.org.
Xiaodong Li, Haoran Xie, Ran Wang, Yi Cai, Jingjing
Alexandre Hocquard, Sunny Ng, and Nicolas Papa- Cao, Feng Wang, Huaqing Min, and Xiaotie Deng.
georgiou. 2013. A constant-volatility framework for 2016. Empirical analysis: stock market prediction
managing tail risk. The Journal of Portfolio Man- via extreme learning machine. Neural Computing
agement, 39(2):28–40. and Applications, 27(1):67–78.
Ehsan Hoseinzade, Saman Haratizadeh, and Arash Burton G. Malkiel. 1989. Efficient market hypothe-
Khoeini. 2019. U-cnnpred: A universal cnn-based sis. In Finance, pages 127–134. Palgrave Macmillan
predictor for stock markets. UK.
Daiki Matsunaga, Toyotaro Suzumura, and Toshihiro
Ziniu Hu, Weiqing Liu, Jiang Bian, Xuanzhe Liu, and
Takahashi. 2019. Exploring graph neural networks
Tie-Yan Liu. 2018. Listening to chaotic whispers:
for stock market predictions with rolling window
A deep learning framework for news-oriented stock
analysis. ArXiv, abs/1909.10660.
trend prediction. In Proceedings of the eleventh
ACM international conference on web search and Tomas Mikolov, Kai Chen, Greg Corrado, and Jef-
data mining, pages 261–269. frey Dean. 2013. Efficient estimation of word
representations in vector space. arXiv preprint
Monique Jeanblanc, Marc Yor, and Marc Chesney. arXiv:1301.3781.
2009. Mathematical methods for financial markets.
Springer Science & Business Media. Robert Neal and Simon M Wheatley. 1998. Do mea-
sures of investor sentiment predict returns? Journal
Weiwei Jiang. 2020. Applications of deep learning in of Financial and Quantitative Analysis, 33(4):523–
stock market prediction: recent progress. 547.
Armand Joulin, Édouard Grave, Piotr Bojanowski, and Duc Huu Dat Nguyen, Loc Phuoc Tran, and
Tomáš Mikolov. 2017. Bag of tricks for efficient text Vu Nguyen. 2019. Predicting stock prices using
classification. In Proceedings of the 15th Confer- dynamic LSTM models. In Communications in
ence of the European Chapter of the Association for Computer and Information Science, pages 199–212.
Computational Linguistics: Volume 2, Short Papers, Springer International Publishing.
pages 427–431.
Thi-Thu Nguyen and Seokhoon Yoon. 2019. A novel
Wei Du Jue Liu, Zhuocheng Lu. 2019. Combining en- approach to short-term stock price movement pre-
terprise knowledge graph and news sentiment analy- diction using transfer learning. Applied Sciences,
sis for stock price volatility prediction. Proceedings 9(22):4745.
of the 52nd Hawaii International Conference on Sys-
tem Sciences. Thien Hai Nguyen and Kiyoaki Shirai. 2015. Topic
modeling based sentiment analysis on social media
for stock market prediction. In Proceedings of the
Raehyun Kim, Chan Ho So, Minbyul Jeong, Sanghoon
53rd Annual Meeting of the Association for Compu-
Lee, Jinkyu Kim, and Jaewoo Kang. 2019. Hats: A
tational Linguistics and the 7th International Joint
hierarchical graph attention network for stock move-
Conference on Natural Language Processing (Vol-
ment prediction. arXiv preprint arXiv:1908.07999.
ume 1: Long Papers), pages 1354–1364.
Kazuhiro Kohara, Tsutomu Ishikawa, Yoshimi Mahla Nikou, Gholamreza Mansourfar, and Jamshid
Fukuhara, and Yukihiro Nakamura. 1997. Stock Bagherzadeh. 2019. Stock price prediction using
price prediction using prior knowledge and neu- deep learning algorithm and its comparison with ma-
ral networks. Intelligent Systems in Accounting, chine learning algorithms. Intelligent Systems in Ac-
Finance & Management, 6(1):11–22. counting, Finance and Management, 26.
Thomas Fischer Christopher Krauss. 2018. Deep learn- Jeffrey Pennington, Richard Socher, and Christopher
ing with long short-term memory networks for finan- Manning. 2014. GloVe: Global vectors for word
cial market predictions. European Journal of Oper- representation. In Proceedings of the 2014 Confer-
ational Research. ence on Empirical Methods in Natural Language
Processing (EMNLP), pages 1532–1543, Doha,
Hao Li, Yanyan Shen, and Yanmin Zhu. 2018. Stock Qatar. Association for Computational Linguistics.
price prediction using attention-based multi-input
lstm. In ACML, volume 95 of Proceedings of Ma- Yao Qin, Dongjin Song, Haifeng Chen, Wei Cheng,
chine Learning Research, pages 454–469. PMLR. Guofei Jiang, and Garrison Cottrell. 2017. A
8425dual-stage attention-based recurrent neural net- Babita Majhi Venkata Sasank Pagolu, Kamal Nayan
work for time series prediction. arXiv preprint Reddy ; Ganapati Panda. 2016. Sentiment analy-
arXiv:1704.02971. sis of twitter data for predicting stock market move-
ments. SCOPES.
Yu Qin and Yi Yang. 2019. What you say and how
you say it matters: Predicting financial risk using Yumo Xu and Shay B. Cohen. 2018. Stock move-
verbal and vocal cues. In 57th Annual Meeting of ment prediction from tweets and historical prices. In
the Association for Computational Linguistics (ACL Proceedings of the 56th Annual Meeting of the As-
2019), page 390. sociation for Computational Linguistics (Volume 1:
Long Papers), pages 1970–1979, Melbourne, Aus-
Robert Rich and Joseph Tracy. 2004. Uncertainty and tralia. Association for Computational Linguistics.
labor contract durations. Review of Economics and
Linyi Yang, Tin Lok James Ng, Barry Smyth, and Ri-
Statistics, 86(1):270–287.
uhai Dong. 2020. Html: Hierarchical transformer-
based multi-task learning for volatility prediction.
Hsinchun Chen Robert P. Schumaker. 2019. Textual In Proceedings of The Web Conference 2020, WWW
analysis of stock market prediction using breaking ’20, page 441–451, New York, NY, USA. Associa-
financial news: The azfin text system. ACM Trans- tion for Computing Machinery.
actions on Information Systems.
Zichao Yang, Diyi Yang, Chris Dyer, Xiaodong He,
Ramit Sawhney, Shivam Agarwal, Arnav Wadhwa, and Alex Smola, and Eduard Hovy. 2016. Hierarchi-
Rajiv Ratn Shah. 2020a. Spatiotemporal hyper- cal attention networks for document classification.
graph convolution network for stock forecasting. In In Proceedings of the 2016 conference of the North
2020 IEEE International Conference on Data Min- American chapter of the association for computa-
ing (ICDM). tional linguistics: human language technologies,
pages 1480–1489.
Ramit Sawhney, Puneet Mathur, Ayush Mangal, Piyush
Khanna, Rajiv Shah, and Roger Zimmermann. Zhou Yu, Jun Yu, Jianping Fan, and Dacheng Tao.
2020b. Multimodal multi-task financial risk fore- 2017. Multi-modal factorized bilinear pooling with
casting. In Proceedings of the 28th ACM Interna- co-attention learning for visual question answering.
tional Conference on Multimedia, MM ’20, New In Proceedings of the IEEE international conference
York, NY, USA. Association for Computing Machin- on computer vision, pages 1821–1830.
ery.
Z. Zhao, R. Rao, S. Tu, and J. Shi. 2017. Time-
Sreelekshmy Selvin, R Vinayakumar, EA Gopalakrish- weighted lstm model with redefined labeling for
nan, Vijay Krishna Menon, and KP Soman. 2017. stock trend prediction. In 2017 IEEE 29th Inter-
Stock price prediction using lstm, rnn and cnn- national Conference on Tools with Artificial Intelli-
sliding window model. In 2017 international con- gence (ICTAI), pages 1210–1217.
ference on advances in computing, communications
and informatics (icacci), pages 1643–1647. IEEE.
William F Sharpe. 1994. The sharpe ratio. Journal of
portfolio management, 21(1):49–58.
Matheus José Silva de Souza, Danilo
Guimarães Franco Ramos, Marina Garcia Pena,
Vinicius Amorim Sobreiro, and Herbert Kimura.
2018. Examination of the profitability of technical
analysis based on moving average strategies in brics.
Financial Innovation, 4(1):3.
Paul C. Tetlock. 2007. Giving content to investor sen-
timent: The role of media in the stock market. Jour-
nal of Finance.
Ashish Vaswani, Noam Shazeer, Niki Parmar, Jakob
Uszkoreit, Llion Jones, Aidan N. Gomez, Lukasz
Kaiser, and Illia Polosukhin. 2017. Attention is all
you need.
Petar Veličković, Guillem Cucurull, Arantxa Casanova,
Adriana Romero, Pietro Lio, and Yoshua Bengio.
2017. Graph attention networks. arXiv preprint
arXiv:1710.10903.
8426You can also read