Deep learning based automatic meibomian gland segmentation and morphology assessment in infrared meibography - Nature
←
→
Page content transcription
If your browser does not render page correctly, please read the page content below
www.nature.com/scientificreports
OPEN Deep learning‑based automatic
meibomian gland segmentation
and morphology assessment
in infrared meibography
1,2
Md Asif Khan Setu , Jens Horstmann1, Stefan Schmidt4, Michael E. Stern1,2,3 &
Philipp Steven1,2*
Meibomian glands (MG) are large sebaceous glands located below the tarsal conjunctiva and the
abnormalities of these glands cause Meibomian gland dysfunction (MGD) which is responsible for
evaporative dry eye disease (DED). Accurate MG segmentation is a key prerequisite for automated
imaging based MGD related DED diagnosis. However, Automatic MG segmentation in infrared
meibography is a challenging task due to image artifacts. A deep learning-based MG segmentation
has been proposed which directly learns MG features from the training image dataset without any
image pre-processing. The model is trained and evaluated using 728 anonymized clinical meibography
images. Additionally, automatic MG morphometric parameters, gland number, length, width, and
tortuosity assessment were proposed. The average precision, recall, and F1 score were achieved 83%,
81%, and 84% respectively on the testing dataset with AUC value of 0.96 based on ROC curve and
dice coefficient of 84%. Single image segmentation and morphometric parameter evaluation took on
average 1.33 s. To the best of our knowledge, this is the first time that a validated deep learning-based
approach is applied in MG segmentation and evaluation for both upper and lower eyelids.
Dry eye disease (DED) is one of the pervasive diseases of the ocular surface due to its multifactorial nature where
tear film instability, hyperosmolarity, neurosensory abnormalities, ocular surface inflammation, ocular surface
damage, and meibomian gland dysfunction (MGD) play etiological r oles1–4. DED affects visual acuity and causes
ocular discomfort and other symptoms, leading to changes in the quality of l ife2,5.
MGD is a chronic disease and caused by diffuse abnormalities of meibomian glands, terminal duct obstruc-
tion, and changes in the glandular secretion. Obstructive MGD is a common cause of evaporative dry eye and
eficiency5–7. Infrared (IR) Meibography is a well-established non-contact optical imaging technique,
lipid layer d
which uses IR illumination to depict MG morphology by examining the everted eyelid7. Clinically, it is widely
accepted, and also recommended to image and quantify MG during dry-eye examination. Meibography is non-
invasive, provides large image areas, detailed morphometric information of MG, and is easy to operate for
clinicians and technicians.
Several grading schemes and methods to analyze MG have been published by Pult et al.8, Srinivasan et al.9,
Arita et al.10, and Engel et al.11 However, these MG segmentation methods are subjective or semi-automatic
and require user interaction, which is laborious, time-consuming and non-repeatable. In previous r esearch8–11,
meibography images have been segmented and quantified using ImageJ (National Institute of Health; http://
imagej.nih.gov/ij) software where clinicians need to involve manually to identify the MG. In addition, different
clinicians identify glands differently, which causes inter-observer v ariability12.
A reliable automatic MG segmentation technique may overcome the difficulties of manual image segmenta-
tion, as infrared meibography images often contain various artifacts such as low contrast, non-uniform illumi-
nation, defocus gland area, or specular reflections which make image segmentation more c hallenging13. Until
now, Koh et al.12, Llorens-Quintana et al.13, Arita et al.14, Celik et al.15, and Koprowski et al.16 have proposed
automatic MG segmentation methods. However, all of these methods rely on intensity-thresholding based image
1
Department of Ophthalmology, Faculty of Medicine, University Hospital Cologne, University of Cologne,
50937 Cologne, Germany. 2Division of Dry Eye and Ocular GvHD, University Hospital Cologne, 50937 Cologne,
Germany. 3ImmunEyez LLC, Irvine, CA, USA. 4Heidelberg Engineering GmbH, 69115 Heidelberg, Germany. *email:
philipp.steven@uk-koeln.de
Scientific Reports | (2021) 11:7649 | https://doi.org/10.1038/s41598-021-87314-8 1
Vol.:(0123456789)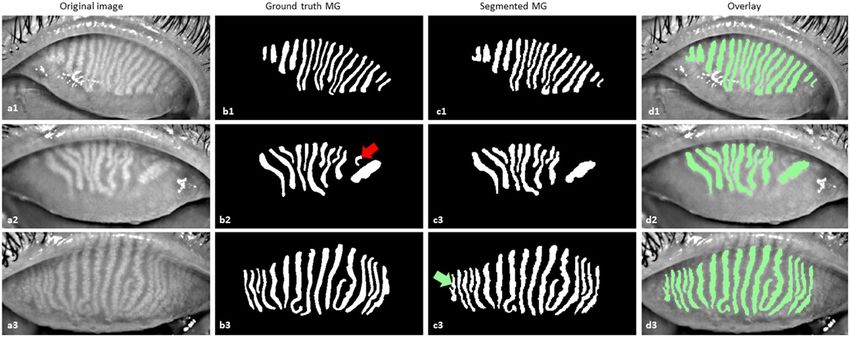
www.nature.com/scientificreports/
segmentation which performance heavily depends on image quality. At the same time, it is quite challenging for
examiners to repeatedly acquire sufficient quality images.
In contrast to intensity-thresholding based image segmentation methods, a deep learning-based method has
the advantages of learning useful features and representations from the raw images automatically17 and could
thus overcome the above-mentioned restrictions. In a previous study18, we have compared intensity-thresholding,
region growing, and deep learning method to automatic analysis of IR meibography images. Among these three
implemented approaches, we have demonstrated that deep learning could produce high quality and reliable
results for the challenging task of automated IR meibography image segmentation and quantification. In the
past years, deep learning has been paid increasing attention in the field of ophthalmology19–22. Using a neural
network and a high volume of image data, a deep learning algorithm can learn to detect specific objects from the
images. Nowadays, deep learning algorithms perform well due to increased computational power and image data.
U-net, a state-of-the-art biomedical image segmentation method was first introduced by Ronneberger et al.23
The algorithm provides high performance while requiring less training image data and gaining more accuracy
than the conventional neural network.
In this research, an automatic MG segmentation method is proposed based on U-net. The detailed deep
learning model training procedure and application to new images is illustrated in supplementary Fig. S1.
Unlike previous image segmentation techniques whose performance heavily depends on the image quality,
the proposed deep learning-based MG segmentation method directly learns the MG features from the train-
ing images, which does not require any pre-processing such as artifact removal or image enhancement. It can
automatically segment MG on new images. We demonstrate the good performance of the proposed technique
by assessing various evaluation metrics.
Materials and methods
Meibography data collection. In total 728 anonymized clinical infrared meibography images of both
upper (398) and lower (330) eyelids of adults male and female humans (age > 18 years) were randomly collected
using the database of an Oculus Keratograph 5 M (Oculus GmbH, Wetzlar, Germany) device at the Eye Hos-
pital, Department of Ophthalmology, University Hospital Cologne, Germany. The image collection adhered to
the tenets of the Declaration of Helsinki and was approved by the Ethics and Institutional review board (IRB)
from the University of Cologne—Germany (approval number #16-045). As this research study was conducted
retrospectively using anonymized non-biometric data, the need for participant’s informed consent was waived
by the Ethics committee and IRB.
Data annotations. All collected clinical meibography images were manually annotated using Fiji (fiji.sc),
which is an open-source image processing software, with the Segmentation Editor (https://imagej.net/Segme
ntation_Editor) plugin to generate ground truth masks. In the segmentation editor plugin window, the Exterior
was set to black, and the Interior was set to white to generate a binary ground truth mask. One of the authors
(M.A.K.S.) created a polygon boundary around the glands and saved the annotation mask images as JPG file
format. Ground truth masks were generated for both upper and lower eyelids. Examples of training images and
their corresponding masks of upper and lower eyelids are presented in Fig. 1. Finally, all annotated ground truth
mask images were verified and corrected by an experienced senior ophthalmologist (P.S.) from the University
Hospital Cologne before they were used in deep learning model training and testing.
Data preparation and allocation. From the overall collected 728 anonymized clinical meibography
images, 100 were prepared as a test dataset to measure the true performance of our trained model. The remain-
ing 628 images were randomly divided into training and validation datasets. Approximately, 80% (502 images)
and 20% (126 images) of image data were used to train and validate respectively the deep learning model. Due
to variations in the size of data set images, all images were resized to 256 × 256 pixels (width × height). Training
images were used for deep learning model training and validation images were used to fine-tune the hyper-
parameters such as epochs, learning rate, momentum, validation steps.
Deep learning model design and training. We have applied transfer learning with a pre-trained back-
bone to increase the learning efficiency of the deep learning model. In this research work, Inception-ResNet-
v224, a pre-trained backbone based on a publicly available ImageNet25 dataset was used for transfer learning.
In the beginning, we pre-trained our model with the Montgomery Chest X-ray images26 for five epochs, which
helps transfer learning performance as such medical image data is closer to our target application than the origi-
nal ImageNet dataset. There are 138 publicly available X-ray images acquired by the Department of Health and
Human Services of Montgomery County, MD, USA. The approach is to pre-train the baseline U-Net model to
increase learning efficiency. After that, we re-trained the U-net model again using the meibography images and
their respective masks. To optimize the deep learning model, both cross-entropy (CE) and Dice loss were used.
The CE loss, Dice loss, and total loss were computed by the following equations,
CE = w(x)gl (x) log pl (x)
(1)
x∈Ω
2�x∈� pl (x)gl (x)
Dice = 1 − (2)
�x∈� gl2 (x) + �x∈� pl2 (x)
Scientific Reports | (2021) 11:7649 | https://doi.org/10.1038/s41598-021-87314-8 2
Vol:.(1234567890)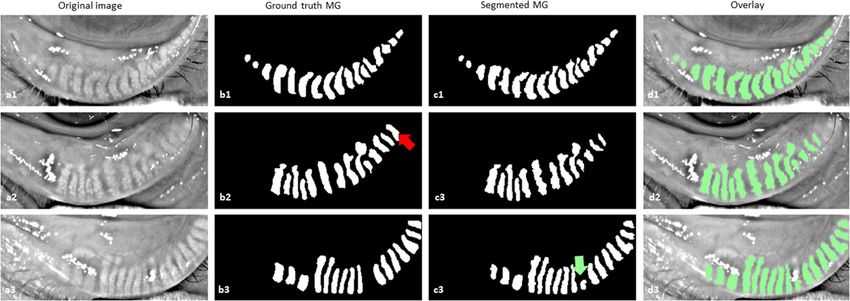
www.nature.com/scientificreports/

                                  Figure 1.  Example of training images and their corresponding ground truth images. (a1–a2) anonymized
                                  upper eyelid images, (a3–a4) anonymized lower eyelid images, (b1–b2) upper eyelid ground truth images, and
                                  (b3–b4) lower eyelid ground truth images.

                                                                                Total loss = CE + Dice                                               (3)
                                  where w(x) is the weight assigned to the pixel x ∈ Ω, gl (x) is the ground truth pixel for layer l , pl (x) is the seg-
                                  mented pixel for layer l and total loss is the summation of the cross-entropy and dice loss.
                                     Adam27, a gradient-based stochastic optimizer that is one of the most efficient optimization algorithms for
                                  deep learning model optimization was also used to optimize the deep learning model.

                                  Cross‑validation study.         To evaluate a deep learning model k-Fold cross-validation is generally used. In
                                  this research, k = 5 was applied. The total 628 images were randomly split into 5 sub-groups and each time four
                                  groups were selected as a training dataset and one group was selected as a validation dataset. In total 502 and 126
                                  images were used as training and validation datasets respectively on every fold for training the model.

                                  Evaluation metrics. For the MG segmentation task in this research, the common evaluation metrics Pre-
                                  cision (P), Recall (R), and F1 score have been used. The MG pixels (e.g. white pixels in the binary segmented
                                  masks) are considered as positive instances. Based on the combination of the ground truth masks and segmented
                                  masks, these pixels are categorized into four categories: true positive (TP), true negative (TN), false positive (FP),
                                  and false negative (FN). Then we can interpret Precision, and Recall in the following equations:
                                                                                             TP
                                                                                     P=                                                              (4)
                                                                                           TP + FP

Scientific Reports |   (2021) 11:7649 |                https://doi.org/10.1038/s41598-021-87314-8                                                      3

                                                                                                                                                  Vol.:(0123456789)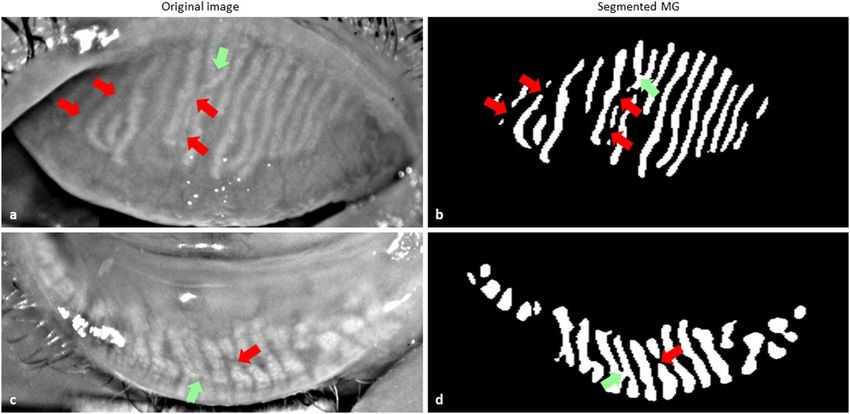
www.nature.com/scientificreports/
Figure 2. Morphometric parameters assessment of MG. (a) Binary segmented image, (b) skeletonized MGs of
one-pixel width, (c) Individual gland width measurement. The Red line indicates the leftmost white pixel ( X0)
and rightmost white pixel (X1) at the Yth row, and (d) Number of each MG is presented on top of each gland.
TP
R= (5)
TP + FN
F1 score is interpreted as a weighted average of precision and recall and based on the following equation:
2·P·R
F1 = (6)
P+R
Morphometric parameters assessment. To better analyze the MG’s morphology, gland number,
length, width, and tortuosity were measured. These morphometric parameters were computed directly from the
output of a deep learning-based binary segmentation image. To calculate the morphometric parameters, each
segmented gland was analyzed individually. However, to generalize these morphometric parameters, the mean
gland length, width, and tortuosity were calculated for an individual eyelid.
To compute the individual gland width, the difference of the leftmost white pixel (X0) and the rightmost
white pixel ( X1) at each row (Y) within the range of the length of the gland ( Ymin, Ymax) were measured and then
averaged (Fig. 2c). The number of MGs were computed based on the total number of separated white objects in
the binary segmented image and put the number on top of each MG (Fig. 2d).
To compute the length and tortuosity of the gland, first, the binary-segmented image (Fig. 2a) was skel-
etonized (Fig. 2b) into one-pixel width using a custom-made python-based software. Then the path length
(distance over the gland’s skeletonized path) and the chord length (Euclidean distance between the first and last
pixel of an individual skeletonized gland) were calculated. Finally, tortuosity τ for each gland g was measured as:
Path length
(7)
τ g =
Chord length
The deep learning model training, validation, testing, data preparation, and morphometric parameters assess-
ment were conducted on a laptop running on Windows 10 Professional, 64-bit Intel Core i7-9750H CPU @
2.6 GHz with 12 MB of cache memory, SSD 512 GB M.2 Samsung 970 Pro PCIe 3.0 × 4 NVMe, RAM 32 GB
DDR4 @ 2666 MHz and NVIDIA GeForce RTX 2070 Max-Q with 8 GB GDDR6 of memory. Data preparation,
deep learning model design, and training, morphometric parameters assessment software was written in Python
(version: 3.6.6) using Keras (version: 2.2.5) with TensorFlow (TensorFlow version: 1.4, CUDA version: 10.0,
cuDNN version: 7.6.3) in the backend.
Test–retest reliability. To determine the variability and repeatability (test–retest reliability)28,29 of the
developed algorithm, we additionally have compared two manual annotations by the same observer with two
automatic segmentations, using the same test dataset of 100 images (50 upper and 50 lower eyelids). The same
observer (M.A.K.S.) manually re-annotated individual MG of the test dataset. Dice similarity coefficient (DSC)30,
Cohen’s kappa coefficient31, and inter-class correlation coefficient (ICC)32 were used to measure the variability
and repeatability between manual annotations and between automatic segmentations of the test dataset.
Scientific Reports | (2021) 11:7649 | https://doi.org/10.1038/s41598-021-87314-8 4
Vol:.(1234567890)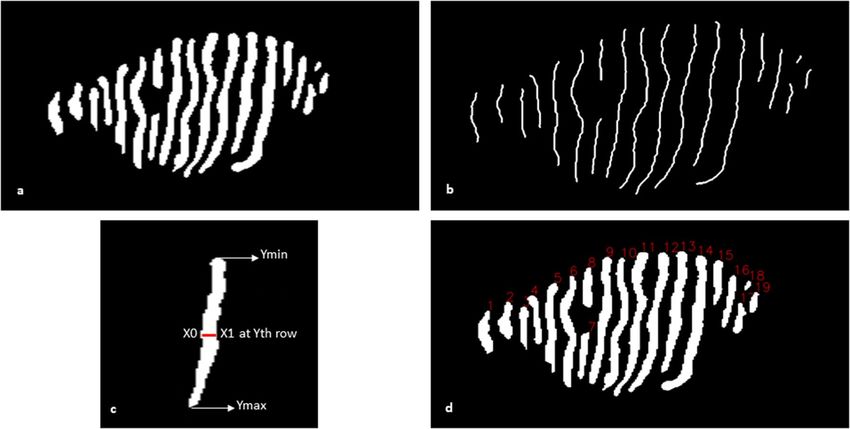
www.nature.com/scientificreports/
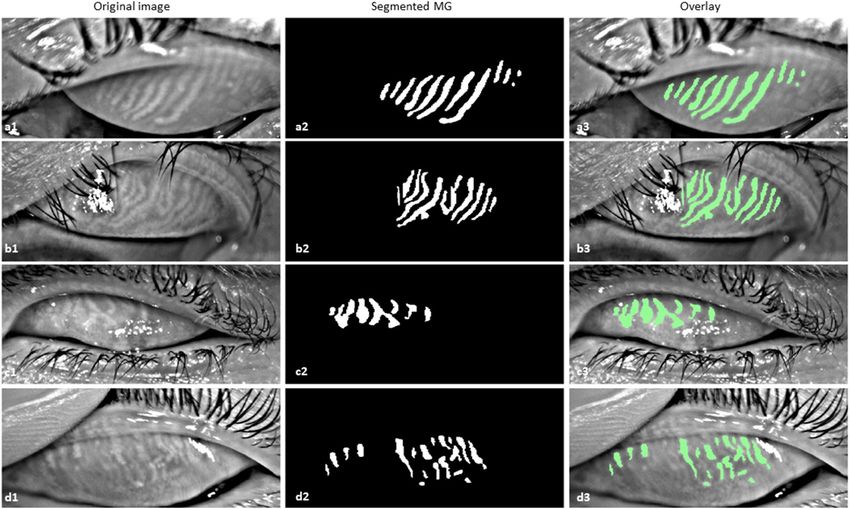
Figure 3. Example of MG segmentation from upper eyelid on test images. (a1–a3) Original images, (b1–b3)
ground truth MG, (c1–c3) segmented MG, and (d1–d3) overlay of the original image and segmented MG. The
red (b2) and green (c3) arrows indicate the missing gland and false gland segmentation respectively.
Figure 4. Example of MG segmentation from lower eyelid on test images. (a1–a3) original images, (b1–b3)
ground truth MG, (c1–c3) Segmented MG, and (d1–d3) overlay of the original image and segmented MG. The
red (b2) and green (c3) arrows indicate the missing gland and false gland segmentation respectively.
Statistics. The deep learning-based MG segmentation method was compared with the manually segmented
MGs. The performance of the deep learning-based segmentation was measured using the Bland–Altman
method33. Open-source program Python (version 3.6.6) based SciPy (version 1.5.2) library was used to perform
the statistical analysis.
Results
Meibomian glands segmentation. MG segmentation model training for 30 epochs with a batch size of
5 took approximately 8 h and 24 min using the above described hard- and software. To segment and evaluate all
100 testing images, took 1 min 58 s on average 1.33 s per image. The average precision, recall, and F1 score were
achieved 83%, 81%, and 84% respectively on the testing dataset with an AUC value of 0.96 based on the ROC
curve (Supplementary Fig. S2) and dice coefficient of 84%. Examples of upper and lower eyelid testing images
segmentation are presented in Figs. 3 and 4.
In general, MGs were reliably segmented in all testing images of both upper and lower eyelids using the
trained deep learning model. However, the glands were not accurately segmented in all-test images. In some
cases, two glands were connected which need to appear separately and the single gland was divided into two,
which need to be a continuous gland. Examples of segmented MGs where glands are connected and separated are
illustrated in Fig. 5. Among the 100 upper (50) and lower (50) eyelid test images, 39 upper and 37 lower eyelid
images were segmented correctly. One MG was missing in 6 upper and 7 lower eyelid images while two MGs
missing in only one lower eyelid image. Furthermore, one MG was falsely segmented in 4 upper and 5 lower
eyelid images while two MGs falsely segmented only one upper eyelid image.
Scientific Reports | (2021) 11:7649 | https://doi.org/10.1038/s41598-021-87314-8 5
Vol.:(0123456789)www.nature.com/scientificreports/
Figure 5. Example of MG segmentation where MG did not segment accurately. (a,c) Original images. (b,d)
Segmented MGs. Green arrows indicate the MGs where glands need to appear separate and red arrows indicate
where MGs need to become continuous.
Upper eyelid parameters Ground truth MG Segmented MG p value
Number of glands 15.02 ± 2.68 15.00 ± 2.61 0.79
Mean gland length 269.87 ± 188.78 249.20 ± 181.65 0.58
Mean gland width 18.14 ± 2.95 19.20 ± 2.81 0.07
Mean tortuosity 1.74 ± 0.95 1.68 ± 0.91 0.18
Table 1. Morphometric parameters analysis of upper eyelid. p value is between ground truth versus
segmented MGs.
Lower eyelid parameters Ground truth MG Segmented MG p value
Number of glands 15.41 ± 3.18 15.32 ± 3.19 0.32
Mean gland length 105.60 ± 90.21 99.96 ± 87.36 0.09
Mean gland width 22.33 ± 5.40 22.66 ± 5.21 0.04
Mean tortuosity 1.78 ± 0.94 1.83 ± 0.94 0.61
Table 2. Morphometric parameters analysis of lower eyelid. p value is between ground truth versus segmented
MGs.
Morphometric parameters assessment. The morphometric parameters MGs number, length, width,
and tortuosity were computed from the binary-segmented images of test dataset. These are important clini-
cal parameters to analysis the MG status. Our developed Python-based software provides automatic morpho-
metric parameters assessment from the binary segmented image. All morphometric parameters of the binary
segmented images of test dataset for both upper and lower eyelids were compared with the manually annotated
images and the p value (using paired t-test) between ground truth and automatic segmentation is also presented.
The results are tabulated in Tables 1 and 2.
To determine the consistency of the automatic MGs segmentation and manual annotation, Bland–Altman
analysis was performed for all morphometric parameters. The statistical plots for upper eyelid are presented in
Fig. 6. The total 50 upper eyelid testing images were used for this analysis. The middle solid line indicates the
mean of manual and segmented MG which are 0.02, 20.67, − 1.06 and 0.07 for gland number, length, width and
tortuosity respectively. All mean values are close to zero, thus the ground truth and automatic segmentation are
not significantly different (p > 0.005). The two dotted lines indicate the limit of agreement (+ 1.96 SD) and the
values were in between 1.13 and − 1.09 for gland number, 88.45 and − 47.11 for length, 1.27 and − 3.39 for width
and 0.72 and − 0.59 for tortuosity. The gray bar indicates the confidence interval of 95%. Among the all 50 test
images only 1, 2, 0, and 3 values were outside the limit of agreement thus the 98%, 96%, 100%, and 94% of the
values are within the limit of agreement.
Scientific Reports | (2021) 11:7649 | https://doi.org/10.1038/s41598-021-87314-8 6
Vol:.(1234567890)www.nature.com/scientificreports/
Figure 6. Bland–Altman plots of MGs number, length, width, and tortuosity between ground truth and deep
learning segmentation for upper eyelid. The middle solid line indicates the mean value, the two dotted lines
indicate the limit of agreement (± 1.96 SD), and the gray bar indicates the confidence interval of 95%.
Figure 7 represents the lower eyelid analysis. The total 50 lower eyelid testing images were used for this
analysis. The middle solid line indicates the mean of manual and segmented MG which are 0.08, 5.64, − 0.34
and − 0.04 for gland number, length, width and tortuosity respectively. All mean values are close to zero, thus
the ground truth and automatic segmentation are not significantly different (p > 0.005). The two dotted lines
indicate the limit of agreement (± 1.96 SD) and the values were in between 1.20 and − 1.04 for gland number,
40.04 and − 28.75 for length, 1.72 and − 2.39 for width, and 0.93 and − 1.00 for tortuosity. The gray bar indicates
the confidence interval of 95%. Among the all 50 test images only 1, 0, 1, and 2 values were outside the limit of
agreement thus the 98%, 100%, 98%, and 96% of the values are within the limit of agreement.
Test–retest reliability. The developed algorithm achieved 0% variability and 100% repeatability, while
running two tests, in contrast, there was variability between two manual annotations with the same observer
and using the same test dataset. The variability and repeatability between manual annotations (intra-observer)
and between automatic segmentations (intra-method) are presented in the Table 3.
Performance evaluation of inferior quality images. The trained deep learning model was also able to
segment MGs from different inferior quality of meibography images, which were not considered during the deep
learning model training, validation, and testing such as out of focus image, eyelashes in the glands area, partially
everted upper eyelid, and artifact of everting finger in the top left of the image. Examples of MGs segmentation
on inferior quality images are illustrated in Fig. 8.
Discussion
In several previous publications, MGs were detected using the image processing software I mageJ8–11. User inter-
action is needed with this software to define the MGs manually for each image to quantify the meibography
images. Users may draw the gland regions differently and therefore intra- or inter-observer variability occurs.
The first automatic MG detection algorithm was published by Koh et al.12 and the algorithm was able to detect
glands from both healthy and unhealthy glands. The most important part of this research work depended on
how the meibography images were acquired. Small artifacts may cause complications during the MG detection
and thus the final result was affected. Later, another automated algorithm for quantitative analysis of MG was
developed by Arita et al.14 based on image enhancement methods where various image processing techniques
were applied. In their research work, user interaction was needed for a manual correction after the MG detection
Scientific Reports | (2021) 11:7649 | https://doi.org/10.1038/s41598-021-87314-8 7
Vol.:(0123456789)www.nature.com/scientificreports/
Figure 7. Bland–Altman plots of MGs number, length, width, and tortuosity between ground truth and deep
learning segmentation for lower eyelid. The middle solid line indicates the mean value, the two dotted lines
indicate the limit of agreement (± 1.96 SD), and the gray bar indicates the confidence interval of 95%.
Upper eyelid Lower eyelid
Metrics Intra-observer Intra-method Intra-observer Intra-method
DSC 0.96 ± 0.01 1.0 ± 0.0 0.97 ± 0.01 1.0 ± 0.0
Kappa 0.87 ± 0.04 1.0 ± 0.0 0.83 ± 0.08 1.0 ± 0.0
ICC 0.90 ± 0.06 1.0 ± 0.0 0.86 ± 0.11 1.0 ± 0.0
Table 3. Variability and repeatability analysis of intra-observer and intra-method on test dataset images.
Intra-observer = between manual annotations of the same observer, Intra-method = between automatic
segmentations running two tests.
when the images had too many specular reflections and extensive MG loss. Thus, the algorithm was not fully
automatic. In recent works, Llorens-Quintana et al.13 proposed a fully automatic MG detection based on image
enhancement methods using various image processing techniques. In their research work, they also proposed
a gland irregularity measurement which was very helpful for clinicians for a follow-up checkup. However, user
input was necessary, and the algorithm did not work for several images as they were not taken properly and
there were some artifacts such as defocus areas, out of frame image and everted upper eyelid touching the lower
eyelid. Additionally, this algorithm was designed only for the upper eyelid MG detection.
A machine learning-based automatic MG detection was developed by Celik et al.15, which was able to detect
MG using the Gabor filter. A supervised machine learning algorithm, support vector machine (SVM), was used
to classify the pixels that belong to either glands or inter-glands areas. However, while our model is trained with a
gland class and a general background class, their model solely learns from the gland and inter-gland areas, which
could potentially lead to false detection. Furthermore, this algorithm was tested for the upper eyelid. Another
artificial intelligence (AI) based MG detection was proposed by Koprowski et al.16, where the SVM classifier was
used to classify healthy, at-risk, and affected subjects with very high sensitivity (99.3%) and specificity (97.5%).
The main limitations of this algorithm were the use of handcrafted features and preprocessing, which provided
only the centerline information of each MG and there were no options to separate the glands. Also, the quanti-
fication of MGD was not possible using global analysis, and the AI (SVM classifier) sometimes produced false
results due to the lack of classification features.
Scientific Reports | (2021) 11:7649 | https://doi.org/10.1038/s41598-021-87314-8 8
Vol:.(1234567890)www.nature.com/scientificreports/
Figure 8. Example of MG segmentation on inferior quality images. (a1–a3) Out of focus image, segmented
MGs, and overlay, (b1–b3) Eyelashes in the glands area image, segmented MGs, and overlay, (c1–c3) Partially
everted upper eyelid image, segmented MGs, and overlay, and (d1–d3) Artifact of everting finger in the top left
of the image, segmented MGs, and overlay.
Unlike the traditional AI, deep learning-based methods do not require handcrafted features or image pre-
processing and it extracts the useful features from the raw images a utomatically17 using the hidden layers.
First‚ deep learning-based MG segmentation and morphometric quantification based on U-Net architecture
was proposed by Prabhu et al.34 They achieved acceptable p values (p > 0.005) between manual annotation and
automatic segmentation method. However, comparison to our model performance is not possible as no deep
learning performance metrics were mentioned. The authors calculated gland width by measuring the pixels
exclusively at the mid-line of the automatic segmented image. In our research study, we instead calculated indi-
vidual gland width by measuring the difference of the leftmost pixel and the rightmost pixel at each row within
the range of the length of the gland and then averaged. Furthermore, in contrast to the previously published
model, which was trained for 300 epochs without transfer learning, our model was trained using two stage
transfer learning, enabling 30 epochs, which is more efficient and computationally inexpensive35. In addition,
their proposed method tested only upper eyelid meibographies. Another deep learning-based MG segmentation
based on pyramid scene parsing (PSP) network has been proposed by Wang et al.36, where they achieved 95.4%
accuracy and 66.7% intersection over union (IoU) to analyze gland atrophy regions. In contrast, our proposed
U-Net based method achieved 84% dice coefficient to segment individual MGs. Maruoka et al.37 proposed a deep
learning-based method to detect obstructive MGD using in vivo confocal microscopy (IVCM). They achieved
94.2% sensitivity and 82.1% specificity to detect normal and obstructive MG acini. Though IVCM provides
high resolution images but it is not routinely used to image meibomian gland, and their field of view is small to
analyses the full length of MG or total area of the eyelid.
Our research study proposed a deep learning-based method to automatically segment and evaluate various
morphometric features of MGs from IR meibography images without any image pre-processing. This deep
learning model achieved high performance with 0% variability and 100% repeatability (test–retest reliability).
The average computational time for segmentation and evaluation per IR meibography image was approximately
1.33 s (experiments were performed on above mentioned laptop). To evaluate 1000 disease images our method
could take only 22 min without any clinicians’ involvement within a single click which reduces significant
processing time and computational cost. Furthermore, statistical analysis presents that more than 95% of all
morphometric parameters value for both upper and lower eyelids are within the limit of agreement. Our pro-
posed method achieved very high performance with on average 84% dice coefficient. The single trained model
is able to segment MG of both upper and lower eyelids. From the visualization of the automated segmentation
of MGs have high visual similarity with manual ground truth MGs. Overall, our research results demonstrate a
fully automated and reliable deep learning-based technique for MG segmentation and morphometric evaluation
from IR meibography images.
Scientific Reports | (2021) 11:7649 | https://doi.org/10.1038/s41598-021-87314-8 9
Vol.:(0123456789)www.nature.com/scientificreports/
This research work has some limitations. Firstly, the proposed deep learning-based technique is device-
specific, where training, validation, and testing images were acquired using a Keratography 5 M device. However,
for the training of the neural network, MG features were automatically selected from training images by the
model itself. Thus, the algorithm may segment MG from images of other IR meibography devices that need to
be tested and validated. Secondly, all ground truth masks were generated manually where there is a possibility
of inter-observer variability. However, all ground truth masks were validated and corrected by an experienced
clinician. Finally, MGs are not accurately segmented in all test images. In some cases, two glands are connected,
which need to appear separately and in other cases, single glands are separated into two or more glands, which
need to be a continuous gland (Fig. 5). In all of these cases, meibography images were not acquired correctly and
the acquisition problems were encountered due to the strong specular reflections, unfocused image, and MGs
morphology. From Fig. 5a and c, it is clearly visible in the original images, where the glands are separated (red
arrows), and the glands are connected (green arrows), that the images were not acquired correctly and the MGs
are connected or overlapping. To overcome these limitations, in the future, we plan to increase the number of
training dataset to more than 1000 patients and increase the number of inferior quality images thus the trained
model could learn the MG features more precisely. This would also increase the learning efficiency of the deep
learning model and able to segment MG more accurately from the inferior quality of images.
Conclusions
A deep learning-based automated IR meibography image segmentation method has been proposed in this
research work. It reliably segments the MG as well as provides automated morphometric evaluation. The pro-
posed technique overcomes the limitations of subjective MG segmentation and assessments which enables faster,
non-invasive, precise, accurate and reproducible MG characterization thus specify better and faster disease diag-
nosis, new drug development, and clinical trials for a new drug of MGD related DED. These automated analyses
provide valuable objective information regarding MG, which reduces, inter- or intra-observer variability and
time associated with manual perception to analyze the large volume of clinical images.
Data availability
The image data utilized in this study are not publicly available due to the patients’ privacy.
Received: 7 October 2020; Accepted: 21 March 2021
References
1. Craig, J. P. et al. TFOS DEWS II report executive summary. Ocular Surf. 15, 802–812 (2017).
2. Stapleton, F. et al. TFOS DEWS II epidemiology report. Ocular Surf. 15, 334–365 (2017).
3. Craig, J. P. et al. TFOS DEWS II definition and classification report. Ocular Surf. 15, 276–283 (2017).
4. Stern, M. E., Gao, J., Siemasko, K. F., Beuerman, R. W. & Pflugfelder, S. C. The role of the lacrimal functional unit in the patho-
physiology of dry eye. Exp. Eye Res. 78, 409–416 (2004).
5. Nichols, K. K. et al. The international workshop on meibomian gland dysfunction: executive summary. Investig. Ophthalmol. Vis.
Sci. 52, 1922–1929 (2011).
6. Knop, E., Knop, N., Millar, T., Obata, H. & Sullivan, D. A. The international workshop on meibomian gland dysfunction: report
of the subcommittee on anatomy, physiology, and pathophysiology of the meibomian gland. Investig. Ophthalmol. Vis. Sci. 52,
1938–1978 (2011).
7. Mathers, W. D. Ocular evaporation in meibomian gland dysfunction and dry eye. Ophthalmology 100, 347–351 (1993).
8. Pult, H. & Nichols, J. J. A review of meibography. Optom. Vis. Sci. 89, E760–E769 (2012).
9. Srinivasan, S., Menzies, K., Sorbara, L. & Jones, L. Infrared imaging of meibomian gland structure using a novel keratograph.
Optom. Vis. Sci. 89, 788–794 (2012).
10. Arita, R., Itoh, K., Inoue, K. & Amano, S. Noncontact infrared meibography to document age-related changes of the meibomian
glands in a normal population. Ophthalmology 115, 911–915 (2008).
11. Engel, L. A. et al. Meibography and meibomian gland measurements in ocular graft-versus-host disease. Bone Marrow Transplant.
50, 961–967 (2015).
12. Koh, Y. W. Detection of meibomian glands and classification of meibography images. J. Biomed. Opt. 17, 086008 (2012).
13. Llorens-Quintana, C., Rico-Del-Viejo, L., Syga, P., Madrid-Costa, D. & Iskander, D. R. A novel automated approach for infrared-
based assessment of meibomian gland morphology. Transl. Vis. Sci. Technol. 8, 17–17 (2019).
14. Arita, R. et al. Objective image analysis of the meibomian gland area. Br. J. Ophthalmol. 98, 746–755 (2014).
15. Celik, T., Lee, H. K., Petznick, A. & Tong, L. Bioimage informatics approach to automated meibomian gland analysis in infrared
images of meibography. J. Optom. 6, 194–204 (2013).
16. Koprowski, R. et al. A quantitative method for assessing the quality of meibomian glands. Comput. Biol. Med. 75, 130–138 (2016).
17. Lundervold, A. S. & Lundervold, A. An overview of deep learning in medical imaging focusing on MRI. Z. Med. Phys. 29, 102–127
(2019).
18. Abstractband DOG 2019. Ophthalmologe 116, 25–218 (2019).
19. Ting, D. S. W. et al. Artificial intelligence and deep learning in ophthalmology. Br. J. Ophthalmol. 103, 167–175 (2019).
20. Gargeya, R. & Leng, T. Automated identification of diabetic retinopathy using deep learning. Ophthalmology 124, 962–969 (2017).
21. Grewal, P. S., Oloumi, F., Rubin, U. & Tennant, M. T. S. Deep learning in ophthalmology: a review. Can. J. Ophthalmol. 53, 309–313
(2018).
22. Ting, D. S. W. et al. Deep learning in ophthalmology: the technical and clinical considerations. Prog. Retin. Eye Res. 72, 100759
(2019).
23. Ronneberger, O., Fischer, P. & Brox, T. U-net: Convolutional networks for biomedical image segmentation. In Lecture Notes in
Computer Science (including subseries Lecture Notes in Artificial Intelligence and Lecture Notes in Bioinformatics) vol. 9351, 234–241
(Springer Verlag, 2015).
24. Szegedy, C., Ioffe, S., Vanhoucke, V. & Alemi, A. A. Inception-v4, inception-ResNet and the impact of residual connections on
learning. In 31st AAAI Conference on Artificial Intelligence, AAAI 2017 4278–4284 (AAAI Press, 2017).
25. Russakovsky, O. et al. ImageNet large scale visual recognition challenge. Int. J. Comput. Vis. 115, 211–252 (2015).
Scientific Reports | (2021) 11:7649 | https://doi.org/10.1038/s41598-021-87314-8 10
Vol:.(1234567890)www.nature.com/scientificreports/
26. Jaeger, S. et al. Two public chest X-ray datasets for computer-aided screening of pulmonary diseases. Quant. Imaging Med. Surg.
4, 475–477 (2014).
27. Kingma, D. P. & Ba, J. L. Adam: a method for stochastic optimization. In 3rd International Conference on Learning Representations,
ICLR 2015—Conference Track Proceedings (International Conference on Learning Representations, ICLR, 2015).
28. Haarburger, C. et al. Radiomics feature reproducibility under inter-rater variability in segmentations of CT images. Sci. Rep. 10,
12688 (2020).
29. Gerig, G., Jomier, M. & Chakos, M. Valmet: a new validation tool for assessing and improving 3D object segmentation. In Lecture
Notes in Computer Science (Including Subseries Lecture Notes in Artificial Intelligence and Lecture Notes in Bioinformatics) vol. 2208,
516–523 (Springer, 2001).
30. Zou, K. H. et al. Statistical validation of image segmentation quality based on a spatial overlap index. Acad. Radiol. 11, 178–189
(2004).
31. McHugh, M. L. Interrater reliability: the kappa statistic. Biochem. Medica 22, 276–282 (2012).
32. Koo, T. K. & Li, M. Y. A Guideline of selecting and reporting intraclass correlation coefficients for reliability research. J. Chiropr.
Med. 15, 155–163 (2016).
33. Martin Bland, J. & Altman, D. G. Statistical methods for assessing agreement between two methods of clinical measurement. Lancet
327, 307–310 (1986).
34. Prabhu, S. M., Chakiat, A., Shashank, S., Vunnava, K. P. & Shetty, R. Deep learning segmentation and quantification of Meibomian
glands. Biomed. Signal Process. Control 57, 101776 (2020).
35. Raghu, M., Zhang, C., Kleinberg, J. & Bengio, S. Transfusion: understanding transfer learning for medical imaging. arXiv (2019).
36. Wang, J., Yeh, T. N., Chakraborty, R., Yu, S. X. & Lin, M. C. A deep learning approach for meibomian gland atrophy evaluation in
meibography images. Transl. Vis. Sci. Technol. 8, 37–37 (2019).
37. Maruoka, S. et al. Deep neural network-based method for detecting obstructive meibomian gland dysfunction with in vivo laser
confocal microscopy. Cornea 39, 720–725 (2020).
Acknowledgements
This research work is funded by the European Union’s Horizon 2020 Innovative Training Network (ITN) under
the Marie Skłodowska-Curie Actions [Integrated Training in Dry Eye Disease Drug Development (IT-DED3),
Grant Number 765608].
Author contributions
M.A.K.S. developed the deep learning algorithm and morphology assessment software, processed, and
anonymized the meibography data, generated ground truth mask images, and wrote the main manuscript text.
J.H. and S.S. provided technical knowledge and reviewed the manuscript. M.E.S. participated in study design
and reviewed and commented on the manuscript. P.S. generated the main idea of this research, provided clinical
background knowledge, collected clinical meibography data, and wrote and reviewed the manuscript.
Funding
Open Access funding enabled and organized by Projekt DEAL.
Competing interests
MAKS, JH has no conflict of interest. SS is an employee of Heidelberg Engineering GmbH. MES is the chief
scientific officer of ImmunEyez LLC and a member of the scientific advisory board of Novaliq GmbH. PS has
received financial support from Novaliq GmbH, Roche, Bausch&Lomb, Ursapharm. The Division of Dry-eye
and Ocular GvHD received donations from Novaliq, Ursapharm, and Juergen‚ and Monika Ziehm.
Additional information
Supplementary Information The online version contains supplementary material available at https://doi.org/
10.1038/s41598-021-87314-8.
Correspondence and requests for materials should be addressed to P.S.
Reprints and permissions information is available at www.nature.com/reprints.
Publisher’s note Springer Nature remains neutral with regard to jurisdictional claims in published maps and
institutional affiliations.
Open Access This article is licensed under a Creative Commons Attribution 4.0 International
License, which permits use, sharing, adaptation, distribution and reproduction in any medium or
format, as long as you give appropriate credit to the original author(s) and the source, provide a link to the
Creative Commons licence, and indicate if changes were made. The images or other third party material in this
article are included in the article’s Creative Commons licence, unless indicated otherwise in a credit line to the
material. If material is not included in the article’s Creative Commons licence and your intended use is not
permitted by statutory regulation or exceeds the permitted use, you will need to obtain permission directly from
the copyright holder. To view a copy of this licence, visit http://creativecommons.org/licenses/by/4.0/.
© The Author(s) 2021
Scientific Reports | (2021) 11:7649 | https://doi.org/10.1038/s41598-021-87314-8 11
Vol.:(0123456789)You can also read