Delta variant apex + USA COVID-19 seasonality + Bitcoin "signal" argues August could be "risk-on" - FSInsight
←
→
Page content transcription
If your browser does not render page correctly, please read the page content below
This document is being provided publicly in the following form. Please subscribe to FSInsight.com
for more.

Members Area       First Word     Delta variant apex + USA COVID-19 seasonality + Bitcoin "signa

       First Word

Delta variant apex + USA COVID-19
seasonality + Bitcoin "signal" argues August
could be "risk-on"
July 30

               Tom Lee
               HEAD OF RESEARCH

Tickers on this report: $SPHB, $OIH, $XLE, $FNGS, $XLK, $BTC, $WTI, $AAPL, $AMZN, $AXP,
$BF, $BIIB, $CLX, $CSCO, $GILD, $GOOG, $GRMN, $LOW, $MSFT, $NTAP, $NVDA, $PG,
$PM, $PSX, $PYPL, $QCOM, $QRVO, $REGN, $TGT, $TSLA, $UPS, $XLNX, $D, $EBAY, $EIX,
$MNST, $MO, $MU, $MXIM, $SWKS

Click HERE to access the FSInsight COVID-19 Daily Chartbook.

We are shifting to a 4-day a week publication schedule:

   Monday
   Tuesday
   Wednesday
   SKIP THURSDAY
   Friday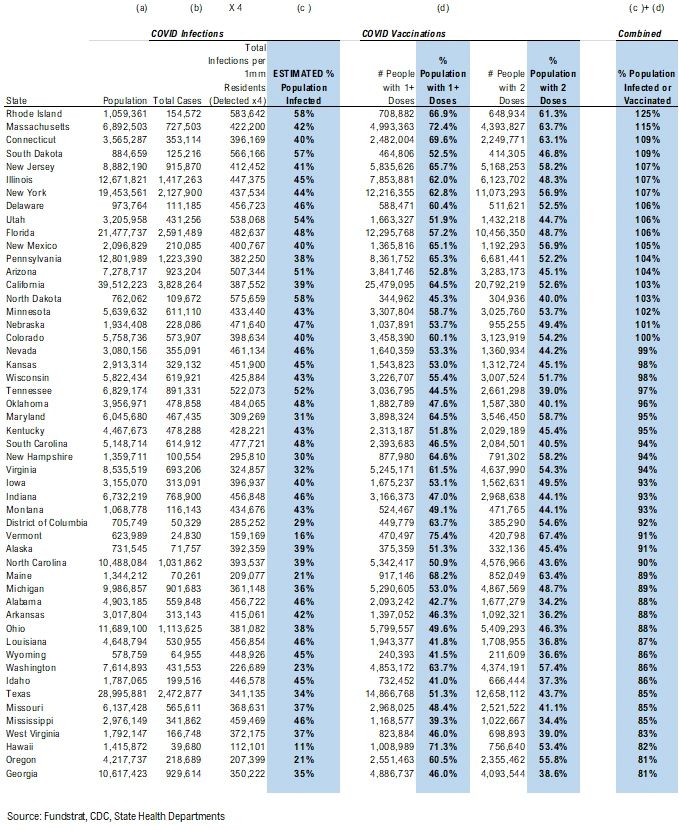
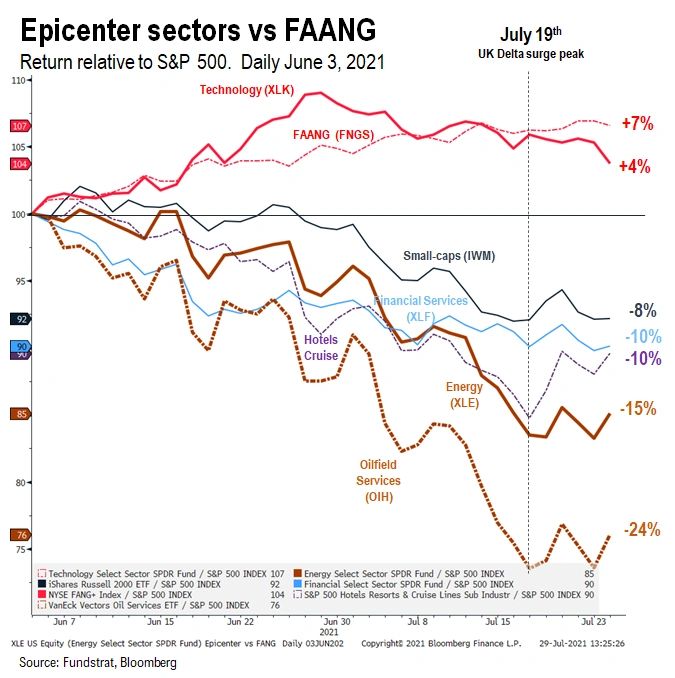
STRATEGY: Delta variant apex + USA COVID-19 seasonality + Bitcoin “signal” argues
August could be “risk-on”
For the past 45 days, we think the singular factor impacting financial markets, in my
opinion, has been the course of the Delta COVID-19 variant. The transmissibility and
potential ability to evade existing vaccinations has added considerable uncertainty
for investors.

From a sector perspective, the last 45 days have been very challenging. This where the
market “chop” has been most evident:

– Since June 3 (UK delta surge)
– See how Epicenter sectors collapsed ($SPHB)
– Energy hit the hardest -15% vs S&P 500 ($OIH $XLE)
– FAANG/Technology led ($FNGS $XLK)

– FYI, we upgraded FAANG to OW on 6/11/2021 given our view on interest rates

– Epicenter sectors have seen relatively stability/ slight outperformance since July 19th
(see below)
…historically, July/August are not months to “be a hero”
Thus, the chop was most evident in this violent sector rotation. In our opinion (mostly
our opinion), we have “never made money” in July/August and thus, we view this two-
month period as one where investors should not try to be a “hero” — this is in part due
to reduced market liquidity:

– many investors take vacation in July/August
– this equates to a “buyers strike” and thus, tape bombs can roil markets

– Since 1900, during the 12 periods when 1H gains >13%, you can see July/August “chop”
is the baseline
– “don’t be a hero” means generally avoiding leverage and short-term options
– term premia gets eaten up during “chop”
Tireless Ken and team compiled some data and as you can see, since 1928, August is
not generally a great month for stocks. The win-ratio is low at 54% overall.

– when S&P 500 >13% 1H, August return -0.5%
– all years, August return +0.5%

So August base case would argue to be “cautious” — but for reasons discussed below,
we think this will not come into play as strongly.
STRATEGY: Delta variant apex + USA COVID-19 seasonality + Bitcoin “signal” argues
August could be “risk-on”
So while our base case is July “chop” would possibly stretch into August, we think
exigent factors in 2021 actually potentially change this base case.

To be clear, what I am saying is that the “I never make $$$ in July/August” may not
apply in August 2021:

– Seasonal analysis suggests USA Delta spike could end in next 10-12 days, or sooner
– Pfizer just released data showing 3rd shot significantly boosts delta antibody
response by 5X (vs 2 dose)
– Bitcoin, the global non-US “risk on” proxy is pushing above $40,000 = risk on!

– lastly, many of our clients have been so bludgeoned by the past 45 days, they are
outright de-risked

So, for now, we are upgrading our baseline expectations for August. Instead of “chop,”
it’s “upside bias”

…Seasonals suggest Delta wave peaks within next 10-12 days
One of our Boston clients, thanks RP (have a great vacation), asked us to look at
seasonality for Florida counties. Our data science team looked at the 5 largest
counties in FL:

– Miami highest fully Vax rate less seasonality (61% vax)
– Tampa with lowest fully Vax rate far worse seasonality (43% vax)

– but for all counties, notice the seasonality?
– daily cases surging might be due to “air conditioning” season
– should peak this week or next

Florida has been among the worst USA Delta outbreaks. Thus, this is a positive
inflection, if the cases turn down next week.

Pfizer data suggest Dose 3 = 100-fold increase in Delta neutralizing antibodies… wow
Pfizer on their earnings call also addressed the efficacy of a potential vaccine booster
shot:

– Dose 3 boosts Delta antibodies by 5X vs Dose 2
– versus “non-vax” person, this is 100X

In other words, the case for boosters is very high and is a sound policy strategy, if the
USA and other nations pursue this.

– of course, 31% of USA adults are not “vaxxed” at all.
– so there remains a tricky policy question how to deal with the “unvaxed”

But this should not change the fact that the Delta risk to the US is strongly diminished.
And thus, we are seeing positive tilt on the Delta variant risk.
Source: Pfizer

…Bitcoin pushing above the $30,000-$40,000 range –> Global “risk-on” signal
Finally, Bitcoin is emerging from this 4-month range of $30,000-$40,000. Our base case
has been Bitcoin to close >$100,000 in 2021:

– Bitcoin $BTC, in our view, is the risk-on asset for EM investors, more than equities
– risk appetite seems to be returning in past week
– a lot of bad news priced in given China crackdown and US tax scrutiny

This is also consistent with our “everything rallies” in 2H2021. A broad risk-on rally.
…Oil (WTI) has also perked up considerably
While anxiety about economic resilience surged in last 45 days, the key commodity to
watch, in our view, is $WTI and as you can see below, Oil has staged a big recovery. Oil
has rallied sharply since late June and is now within a stone’s throw of the 2-year high
of $77.

– we expect Oil to exceed $80 in 2H2021
– this will also be a positive catalyst for Energy equities ($XLE $OIH)
– more on this in the coming week
STRATEGY: Granny Shot rebalance –> 6 additions, -8 deletions –> YTD S&P 500
outperformance +537bp

Thursday, we did our quarterly rebalance of the Granny Shots portfolio. Our granny
shots, as many recall, are based upon finding the “best of best” ideas from our 6
tactical/thematic portfolios. These are what we consider to be the best risk/reward
long term ideas.

– 6 stocks added
– 8 stocks deleted

= 26 stocks in revised Granny Shots list

6 Additions:

Consumer Discretionary: LOW, TGT

Consumer Staples: CL, CLX
Industrials: UPS

Information Technology: NTAP

8 Deletions:

Information Technology: MU, MXIM, SWKS

Consumer Discretionary: EBAY

Utilities: D, EIX

Consumer Staples: MNST, MO

Complete list of 26 Granny Shot Ideas:

Consumer Discretionary: AMZN, GRMN, LOW, TGT, TSLA

Communication Services: GOOG

Information Technology: AAPL, CSCO, MSFT, NTAP, NVDA, PYPL, QCOM, QRVO, XLNX

Industrials: UPS

Financials: AXP

Energy: PSX

Health Care: BIIB, GILD, REGN

Consumer Staples: BF/B, CL, CLX, PG, PM
…Granny Shots is outperforming S&P 500 by +537bp YTD
Granny Shots is managing to outperform S&P 500 by +537bp YTD:

– Granny Shots +23.0%
– S&P 500 +17.7%
– Relative +537bp
As for monthly performance, July has been a tougher month for Granny Shots, with
relative return for the month -1.8% vs S&P 500. But given the July “chop” this is
expected, in our view.
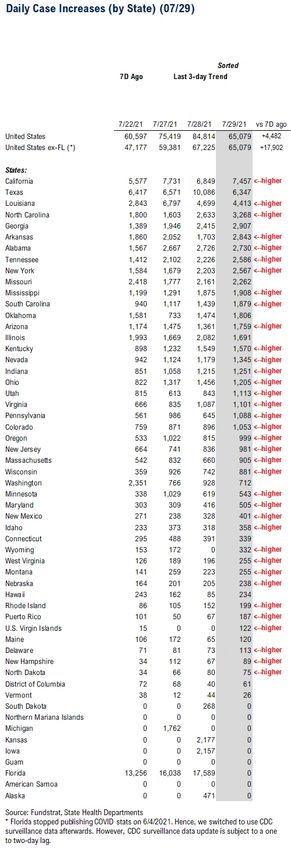
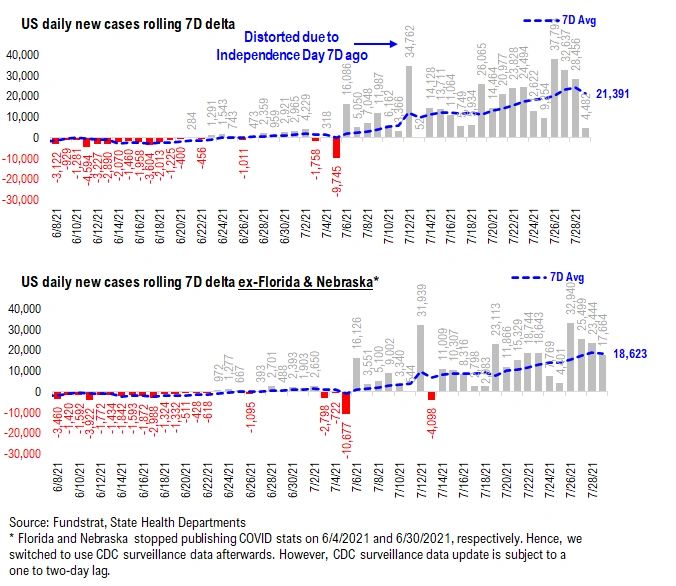
__________________________

26 Granny Shot Ideas:

$AAPL, $AMZN, $AXP, $BF/B, $BIIB, $CLX, $CSCO, $GILD, $GOOG, $GRMN, $LOW, $MSFT,
$NTAP, $NVDA, $PG, $PM, $PSX, $PYPL, $QCOM, $QRVO, $REGN, $TGT, $TSLA, $UPS,
$XLNX

8 Deletions:

$D, $EBAY, $EIX, $MNST, $MO, $MU, $MXIM, $SWKS

___________________________

POINT 1: Daily COVID-19 cases 65,079, up +17,902 (ex-FL) vs 7D ago… 7D delta in daily
cases seems peaking… If so, early sign of case rollover…
_____________________________

Current Trends — COVID-19 cases:
– Daily cases 65,079 vs 60,597 7D ago, up +4,482
– Daily cases ex-FL 65,079 vs 47,177 7D ago, up +17,902
– 7D positivity rate 6.4% vs 5.7% 7D ago
– Hospitalized patients 39,112, up +35% vs 7D ago
– Daily deaths 288, up +11% vs 7D ago
_____________________________

*** Florida and Nebraska stopped publishing daily COVID stats updates on 6/4 and 6/30,
respectively. We switched to use CDC surveillance data as the substitute. However,
since CDC surveillance data is subject to a one-to-two day lag, we added a “US ex-
FL&NE” in our daily cases and 7D delta sections in order to demonstrate a more
comparable COVID development.

The latest COVID daily cases came in at 65,079, up +17,902 (ex-FL) vs 7D ago. The case
counts are generally rising across all US states. The 7D delta in daily cases (the speed
of case rise) has risen to ~19,000 but seems to be peaking. Recall, in order for the daily
cases to roll over, the 7D delta has to turn downwards first – it indicates that the
speed of case rise is slowing and that daily cases are starting to peak. And next, when
the 7D delta turns to negative, it means the daily cases roll over.

As you can see, a peaking 7D delta is good news and it’s an early sign of case rollover.
It is consistent with what we have noted in the last few reports that US could follow
the same pattern as UK and India and peak in the next two to three weeks. Besides,
the reintroduction of a mask mandate could further cut down the transmission of the
Delta variant and expediate the process of case rollover. We will be watching the
relevant data closely.
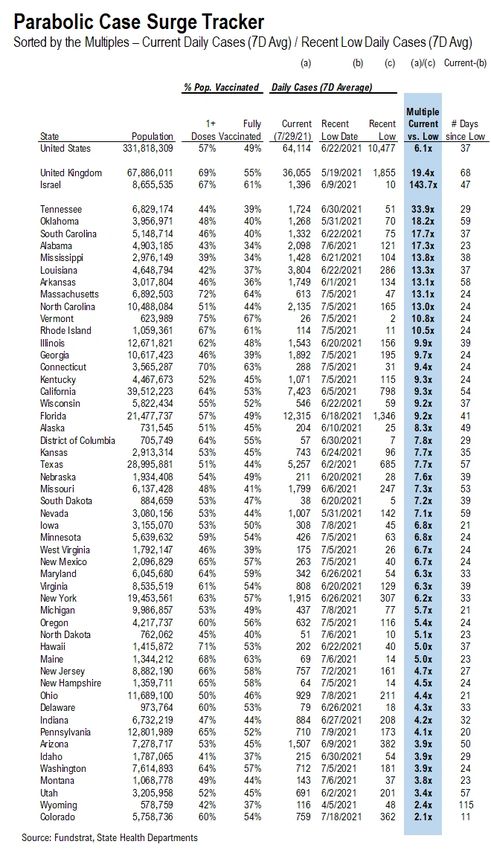
7D delta in daily cases has been slowly rising, now at ~19,000…
The 7D delta in daily cases has been rising over the past two weeks. But as shown in
the chart below, it seems the speed of case rise has slowed down, and it could be an
early sign of case rollover – US cases will continue to rise but will do so at a slower
speed until the day that 7D delta turns to negative.

Low vaccinated states seem to have a larger increase in daily cases compared to their
recent low…
Below, we added a new section called “Parabolic Case Surge Tracker” to monitor the
possible parabolic surge in daily case figures. In the table, we included both the
vaccine penetration and the recent case trend for 50 US states + DC. The table is
sorted by the multiple of their current daily cases divided by their recent low in daily
cases.

– The states with higher ranks are the states that have seen a more significant rise in
daily cases
– We also calculated the number of days between now and the recent low date; a
state with a high multiple but low number of days since its low means the state is
facing a relatively rapid surge in daily cases
– The US as a whole, UK, and Israel are also shown at the top as a reference
Current hospitalization and positivity rates are rising… Daily deaths remain low…
Below we show the aggregate number of patients hospitalized due to COVID, daily
mortality associated with COVID, and the daily positivity rate for COVID. As you can
see, hospitalization and daily deaths are relatively low compared to the prior waves.
However, with the recent increase in daily cases, current hospitalization is clearly
turning upwards. Regarding positivity rate, it recently exceeded 5%, which is higher
than the positivity rate we observed during the “mini” wave this April and significantly
higher than the recent low of
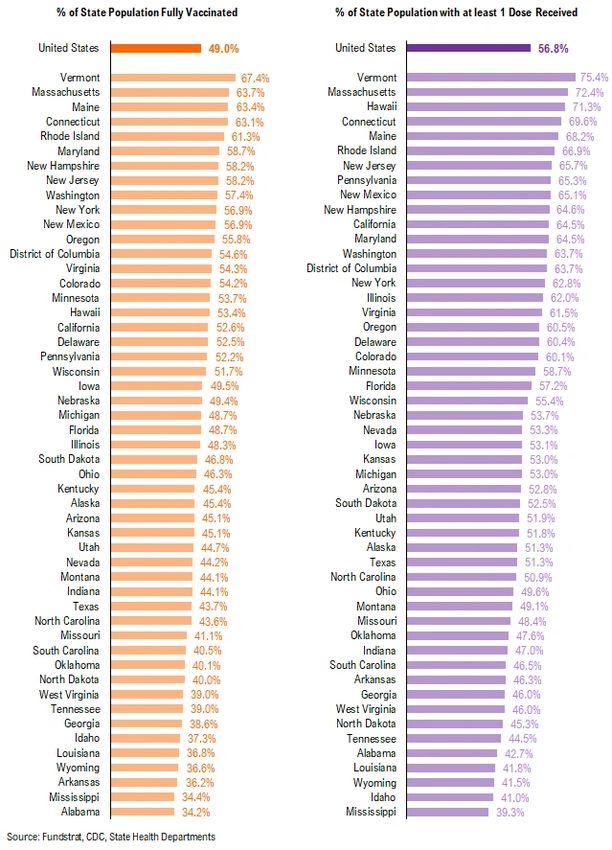
POINT 2: VACCINE: vaccination pace has been slightly rising over the past few days…
_____________________________

Current Trends — Vaccinations:
– avg 0.6 million this past week vs 0.5 million last week
– overall, 49.0% fully vaccinated, 56.8% 1-dose+ received
_____________________________

Vaccination frontier update –> all states now near or above 80% combined
penetration (vaccines + infections)

Below we sorted the states by the combined penetration (vaccinations + infections).
The assumption is that a state with higher combined penetration is likely to be closer
to herd immunity, and therefore, less likely to see a parabolic surge in daily cases and
deaths. Please note that this “combined penetration” metric can be over 100%, as
infected people could also be vaccinated (actually recommended by CDC).

– Currently, all states are near or above 80% combined penetration
– RI, MA, SD, CT, NJ, IL, NY, DE, NM, UT, PA, ND, AZ, MN, CA, FL, NE are now above 100%
combined penetration (vaccines + infections). Again, this metric can be over 100%, as
infected people could also be vaccinated. But 100% combined penetration does not
mean that the entire population within each state is either infected or vaccinated.
Below is a diffusion chart that shows the % of US states (based on state population)
that have reached the combined penetration >60%/70%/80%/90%/100%. As you can
see, all states have reached 80% combined vaccination + infection. 69.0% of US states
(based on state population) have seen combined infection & vaccination >90% and
45.4% of US states have seen combined infection & vaccination >100% (Reminder: this
metric can be over 100%, as infected people could also be vaccinated. But 100%
combined penetration does not mean that the entire population within the state is
either infected or vaccinated).
There were a total of 696,436 doses administered reported on Thursday. Over the past
two weeks, the vaccination pace has been mostly flat, but recently it seems to edge
up slowly. Perhaps people are becoming more inclined to get vaccinated over growing
delta variant concerns. But this is actually a good sign since vaccination not only could
lower the chance and mitigate the severity of getting COVID, but also reduce the
virus’s transmission. Currently, 2/3 of the US population eligible (age 12+) to receive
COVID vaccines have already received at least one dose. For some people among the
remaining 1/3, vaccine hesitancy concerns might not easily be reversed. But in order to
prevent another parabolic surge in daily cases, hospitalizations, and fatalities, getting
more people fully vaccinated remains the key.
99.1% of the US has seen 1-dose penetration >40%…

To better illustrate the actual footprint of the US vaccination effort, we have a time
series showing the percent of the US with at least 45%/45%/50% of its residents fully
vaccinated, displayed as the orange line on the chart. Currently, 88.8% of US states
have seen 40% of their residents fully vaccinated. However, when looking at the
percentage of the US with at least 45% of its residents fully vaccinated, this figure is
67.8%. And only 44.5% of US (by state population) have seen 50% of its residents fully
vaccinated.

– While 99.1% of US states have seen vaccine penetration >40%, 93.4% of them have
seen 1 dose penetration >45% and 78.1% of them have seen 1 dose penetration > 50%.
– 88.8% of the US has at least 40% of its residents fully vaccinated, However, only 67.8%
of US has fully vaccinated >45% and 44.5% of US has fully vaccinated >50%.
This is the state by state data below, showing information for individuals with one dose
and two doses.
The ratio of vaccinations/ daily confirmed cases has been falling significantly (red line
is 7D moving avg). Both the surge in daily cases and decrease in daily vaccines
administered contributed to this.

– the 7D moving average is about ~15 for the past few days
– this means 15 vaccines dosed for every 1 confirmed case
In total, 342 million vaccine doses have been administered across the country.
Specifically, 188 million Americans (57% of US population) have received at least 1 dose
of the vaccine. And 163 million Americans (49% of US population) are fully vaccinated.

POINT 3: Tracking restrictions lifting and subsequent effects in individual states

Point #3 focuses primarily on tracking the lifting of restrictions, as states have eased
the majority of mandates. Keep in mind, easing/lifting restrictions are contingent upon
state of emergency ordinances being renewed.
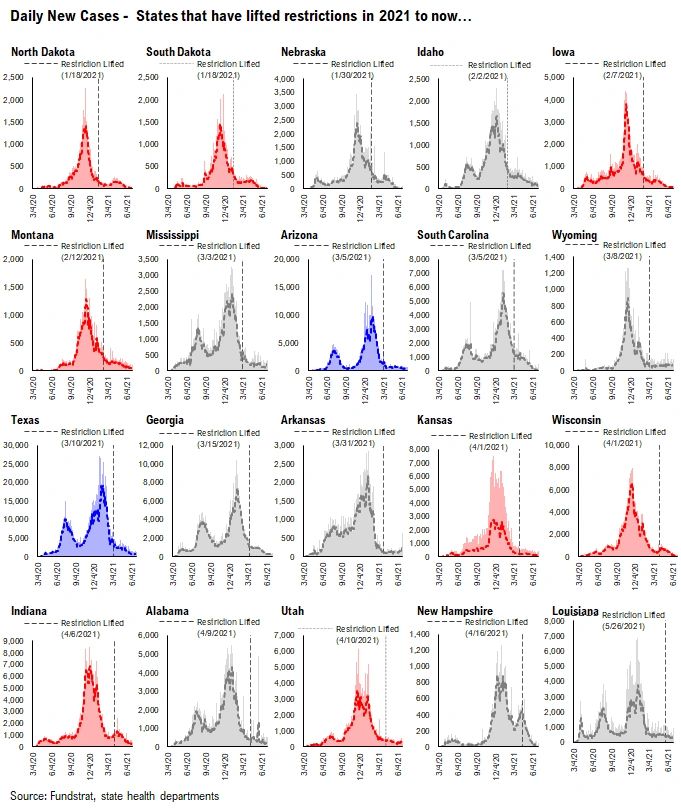
– States in groups 1 and 2 represent states that let their emergency ordinances expire,
or that never had one in the first place
– Note: IL and HI are not listed. This is because restrictions lifting is determined at the
county / island level, and no statewide policy will be established to lift restrictions until
a full reopening

So there is a spectrum of approaches. Our team is listing 3 tiers of states and these
are shown below.

– states that eased all restrictions in 2020: AK, OK, MO, FL, TN
– states that have eased all restrictions in 2021 to now: ND, SD, NE, ID, IA, MT, MS, AZ,
SC, WY, TX, GA, AR, KS, WI, IN, AL, UT, NH, LA, NJ, KY, MN, MA, VT, OH, WV, ME, MI, NY,
OR, PA, MD, DE
– states that are still easing restrictions in 2021: WA, NC, CA, NM, CO, NV, CT, VA, RI, DC

GROUP 1: States that lifted restrictions in 2020…
The daily case trends in these states are impressive and it is difficult to say that lifting
restrictions has actually caused a new wave of cases because the case trends in these
states look like other states.
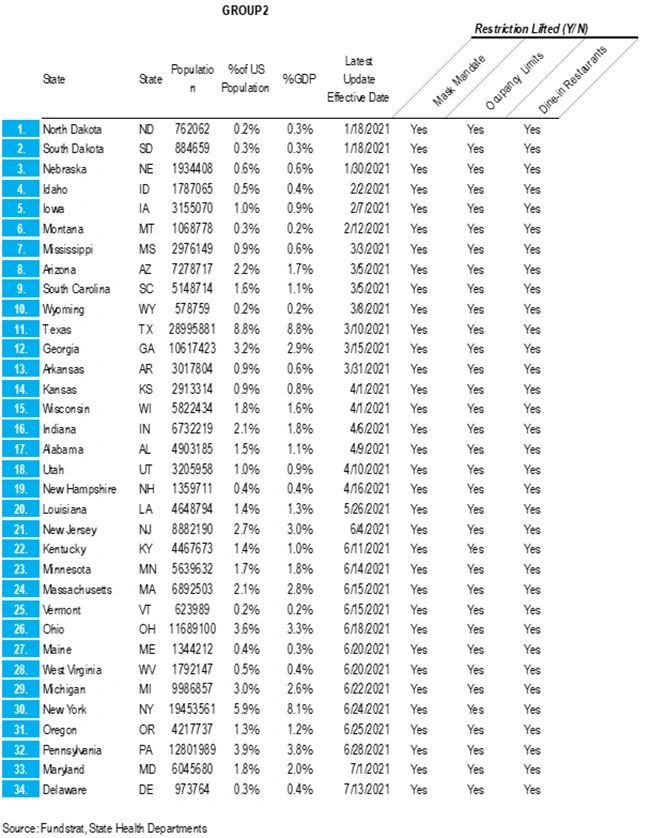
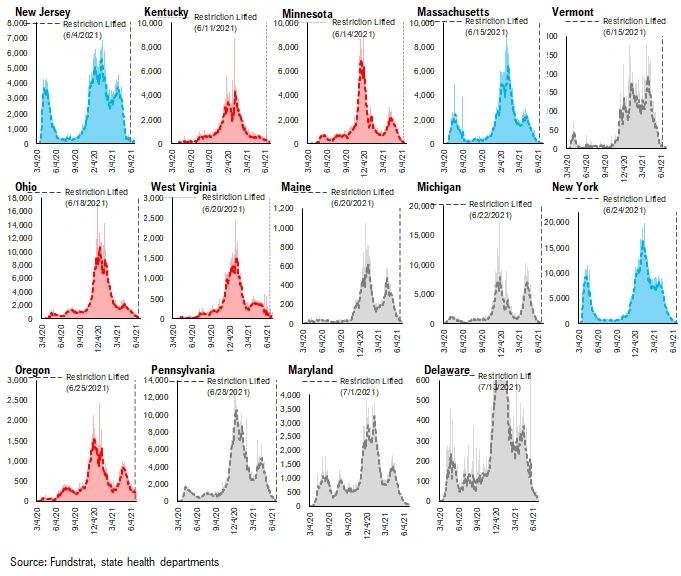
GROUP 2: States that have lifted restrictions in 2021 to now…
Similar to the list of states above, the daily case trends in these states are impressive
and it seems that lifting restrictions hasn’t caused an increase in cases.
GROUP 3: States that are still easing restrictions in 2021…
These states have begun to lift restrictions, but have yet to ease all restrictions. The
date of each state’s most recent restrictions lifting is indicated on each chart. The
case trends in these states have been mostly positive.

– Easing restrictions appears to have contributed to an increase in cases in several of
these states, most drastically in OR, ME, WA, and MN
Tom Lee
             HEAD OF RESEARCH

Disclosures (show)
You can also read