Detecting the Unexpected in Honey Through Routine Food Profiling - Waters ...
←
→
Page content transcription
If your browser does not render page correctly, please read the page content below
Application Note

Detecting the Unexpected in Honey Through
Routine Food Profiling

Gitte Barknowitz, Sara Stead

Waters Corporation

Abstract

This application note investigates whether untargeted metabolomics could differentiate honey samples from

Detecting the Unexpected in Honey Through Routine Food Profiling                                            1
polyfloral and single botanical origin and detect illicit fortification of a honey supplement, using a novel high-
performance bench-top orthogonal acceleration time-of-flight (Tof) LC-MS system with simplified and optimized

standard operation modes with intuitive software and automated workflow methods including multivariate

statistics.

Benefits
The ACQUITY RDa Detector as a tool for investigating typical frauds associated with honey offers streamlined
data acquisition and processing on a fit-for-purpose high-resolution LC-MS (Tof) platform enhancing

accessibility to new users that take first steps in the analysis of food integrity.

Introduction

A new orientation of consumers towards a healthy and natural lifestyle has recently given rise to a growing
global market for honey. Antioxidants and anti-inflammatory components, besides others, make honey an

attractive alternative to natural sugars, syrups, and artificial sweeteners for the food and beverage industry.
Recently, however, honey has also seen growing interest as an ingredient within the pharmaceutical and
consumer products ranging from wound dressings to cold remedies.1

Honey, as a high value food commodity is vulnerable to various forms of food fraud. For example, specialty
monofloral honey products, like Manuka, face adulteration to undercut competition, ultimately taking genuine
beekeepers out of business as they cannot compete with the price of adulterated products, with severe effects on
local ecosystems and agriculture. A third of our food depends on bees and protecting global bee populations by
keeping the producers in operation and fighting economic honey fraud remains an ongoing challenge on many

levels.2 In addition, natural health supplements containing honey that make various health and nutrition claims,
but are often illicitly fortified with undeclared pharmaceutically active compounds to deliver the purported

“efficacy” of the product, can be a risk to consumer safety.

Food and drink manufacturers rely on their supply chains to ensure consumer choice, affordability, consistent

quality of products, and continuity of supply. As the global supply system is under increasing pressure from
population increase, growing demand for limited resources and changing diets, companies also need to be alert

to the potential for food fraud and actively work with their customers and suppliers to identify and mitigate the

risks of food fraud.

Honey analysis is highly complex and requires the use of multiple analytical techniques as adulteration types can

Detecting the Unexpected in Honey Through Routine Food Profiling                                                     2
be numerous. The simultaneous detection of multiple components using spectroscopic and spectrometric
techniques, coupled with multivariate analysis (MVA), is a promising approach to achieve botanical

discrimination.3 LC-HRMS is one technique that has been used extensively for metabolic profiling in the food and

beverage industry including for the analysis of honey. In this study we investigated whether untargeted
metabolomics could differentiate honey samples from polyfloral and single botanical origin and detect illicit

fortification of a honey supplement, using a novel high-performance bench-top orthogonal acceleration time-of-
flight LC-MS system with simplified and optimized standard operation modes with intuitive software and

automated workflow methods including multivariate statistics.

The system is controlled by UNIFI Software which facilitates the operation by automating the setup and

calibration routines as well as the processing through an established non-targeted screening workflow,

illustrated in Figure 1.

Figure 1. Workflow from sample preparation to data processing for honey screening and

investigation on the ACQUITY RDa Detector with instrument setup, data acquisition, processing,

MVA, and investigation on a single platform.

Experimental

Honey samples of polyfloral and a single floral origin (Manuka) were analyzed. Three different samples per type

were selected and injected in triplicate (a total of 9 data points per group). A single honey health supplement
was also investigated. A quality control (QC) pool was generated, to evaluate the technical repeatability of the

Detecting the Unexpected in Honey Through Routine Food Profiling                                                   3
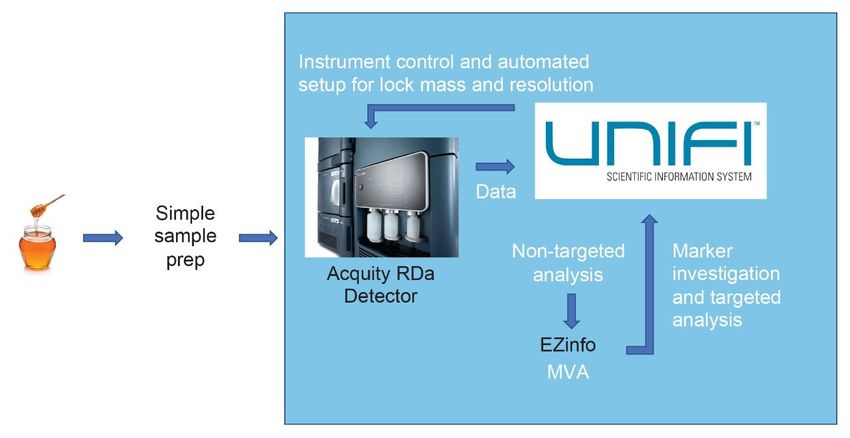
assay.

A fast and simplified sample preparation was chosen which takes about 30 minutes to conduct for batches of up

to 40 samples. Briefly, 1 mL of honey was weighed into a centrifuge tube, combined with 20 mL of extraction
solvent (methanol/water (30/70%, v/v) with 0.1% formic acid) and centrifuged at 5000 rpm for five minutes and

the supernatant was sonicated for one minute at 30 °C. Subsequently 1 mL of the sample extract was transferred

to UPLC glass vials and five microliters were injected and separated on an ACQUITY UPLC I-Class PLUS
coupled to an ACQUITY RDa Detector. The workflow is shown in Figure 1.

This instrument uses built-in SmartMS Technology to improve the setup for users new to high-resolution
instruments. With the ACQUITY RDa System, the setup solution is permanently connected to the instrument and

the instrument setup is presented to the operator on an optimized page. The system automatically completes the
detector setup, auto-tune and mass calibration and displays when it is ready to acquire.

The data was acquired and processed using UNIFI on waters_connect (version 1.2.0, Waters) with EZinfo
(version 3.0.3, Umetrics) performing the peak picking in UNIFI and the multivariate analysis in EZinfo. Prior to
processing, the sample list in UNIFI was edited with an additional column for ‘Group ID’ which automates marker
labelling in EZinfo. Mass range and retention time limits were set to full range for marker discovery, resulting in
about 40,000 markers generated by UNIFI. The markers were transferred via an automated routine to EZinfo for

multivariate analysis. Model scaling was set to Pareto and labels were changed to ‘Group ID’. An S-Plot was
generated for a comparison of the measured health supplement honey and the quality control pool.

LC Conditions

LC System:                                                ACQUITY UPLC I-CLASS PLUS

Column:                                                   ACQUITY BEH C18 2.1 x 100 mm, 1.7 µm

Mobile phase A:                                           10 mM ammonium acetate in water

Mobile phase B:                                           Acetonitrile

Column temperature:                                       45 °C

Injection volume:                                         5 µl

Detecting the Unexpected in Honey Through Routine Food Profiling                                                      4
Gradient

Time(min)                           Mobile phase B (%)                 Curve settings

0.0                                 1                                  Initial

0.75                                1                                  6

2.0                                 5                                  6

3.0                                 5                                  6

6.5                                 55                                 6

8.5                                 90                                 6

9.0                                 90                                 6

9.1                                 1                                  6

12.0                                1                                  6

MS Conditions

MS Detector:                                          ACQUITY RDa Detector

Mode:                                                 Full scan with fragmentation (pseudo-MSE
                                                      acquisition)

Mass range:                                           Low (50-2000 m/z)

Polarity:                                             Positive

Scan rate:                                            10 Hz

Detecting the Unexpected in Honey Through Routine Food Profiling                                 5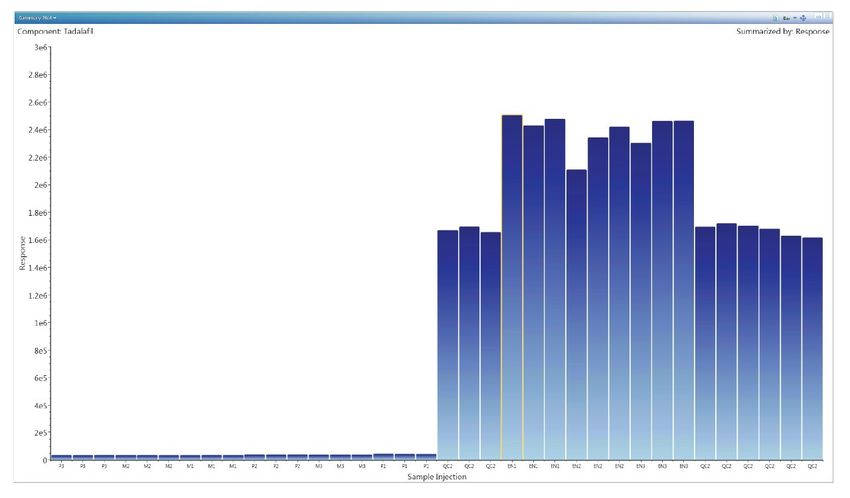
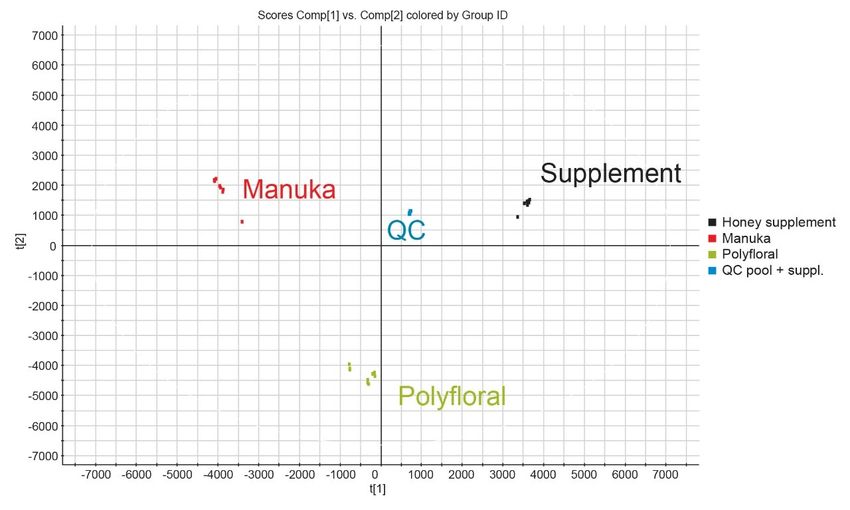
Cone voltage:                                             30 V

Fragmentation cone voltage:                               60-180 V

Capillary voltage:                                        1.5 kV

Desolvation temperature:                                  550 °C

Results and Discussion

Non-Targeting Profiling and MVA
Using the 10k resolution LC-Tof with unsupervised MVA (PCA) honey samples were readily discriminated
according to poly- and mono-floral variety showing good intra- and inter-group clustering. Replicate injections of
the QC pool sample were included at randomized intervals throughout the course of the acquisition to assess
technical variance. The QC pool injections were found to cluster in very close proximity, falling between the poly-
and mono-floral honey populations in the PCA scores plot indicating the technical variance of the overall system

is low and fit-for-purpose for multi-variate analysis.

Figure 2 reveals the discrimination between the tested groups of honey according to poly- or mono-floral origin,

honey health supplement, and the pooled QC sample. The health supplement honey groups distinctly away from
the other groups and was investigated separately within EZinfo against the QC pools. Also visible are

pronounced intra-group differences between the three polyfloral and the three Manuka honey samples.

Detecting the Unexpected in Honey Through Routine Food Profiling                                                      6
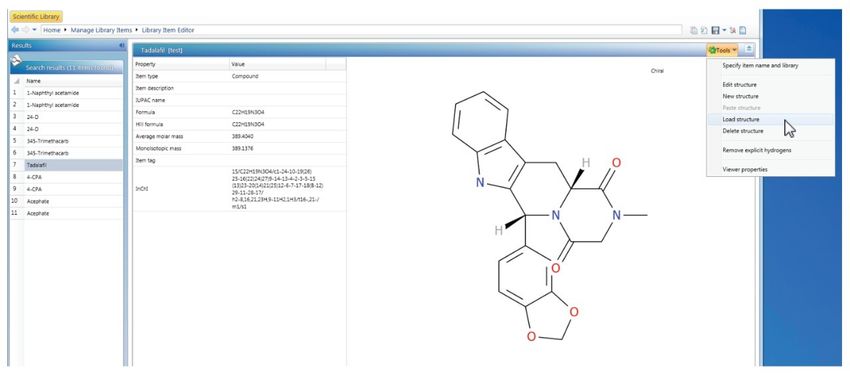
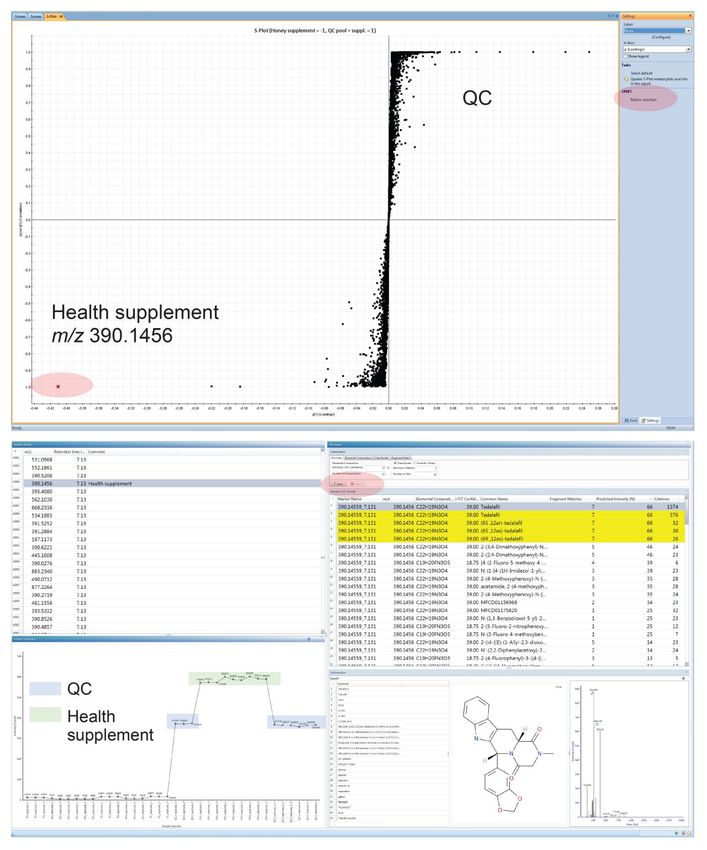
Figure 2. Pareto model of analyzed honeys with pooled QC samples. Model generated from 28,000
markers.

Marker Elucidation Tools
The health honey supplement showed an abundant, unique marker ion (m/z of 390.1456) in the generated S-plot

(Figure 3).

Detecting the Unexpected in Honey Through Routine Food Profiling                                              7
Figure 3. The upper part shows the S-plot of the health supplement honey versus the QC pool. The lower part
shows the window
The selected markerthat
wasopens after the
tentatively return of
identified as the
the marker of interestcompound
pharmaceutical to UNIFI and after pressing
tadalafil, following the
a start
button whichsearch
Chemspider initiates thethe
with Chemspider
precursor database
mass andsearch. The
fragment highlighted
ion ellipses
confirmation whichmark
wasthe placesbywhere
enabled clicks in
the pseudo-
the
MSEsoftware are with
acquisition required.
cone voltage ramping that was used for initial data acquisition. The investigation was
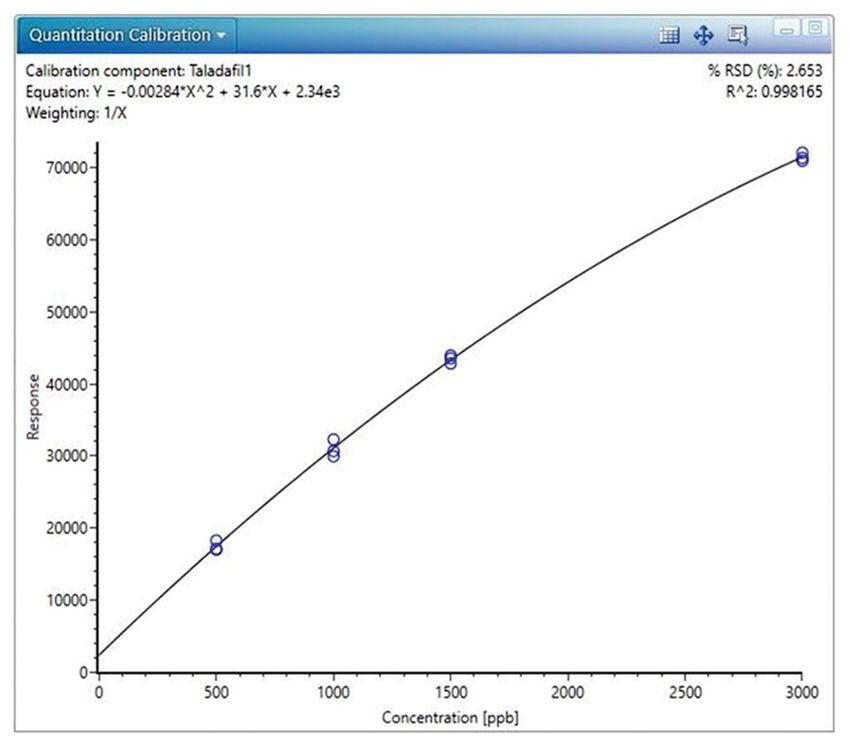
Detecting the Unexpected in Honey Through Routine Food Profiling 8performed in UNIFI after re-importing the marker of interest from the S-plot in EZinfo with three clicks as shown in Figure 3. In the lower left corner of Figure 3 an automatically generated marker summary plot is displayed in UNIFI, which shows the abundance of the selected marker across the sample set. EN1, EN2, and EN3 are the honey health supplement injections obtained from three different aliquots of the product. QC2 is the QC pool containing the health supplement which is referred to in this document as the QC pool. Quantitative Analysis Toolset After marker identification a quantitative analysis of the tadalafil standard was performed. A library entry was created in UNIFI and a molfile downloaded from Chemspider was added to that entry (Figure 5) allowing UNIFI to generate predicted fragments from the structure and look for these in the pseudo-MSE data. Afterwards the processing method in UNIFI was updated by adding the new tadalafil library entry and the data was reprocessed for threshold estimation. Non-linear curve fitting was applied within UNIFI and showed an R2 of 0.994 over 500 to 3000 ng/mL (Figure 4). The calculated concentration of tadalafil in the honey based health supplement was estimated to exceed the maximum formulation dosage in the pharmaceutical product Cialis thus posing a potential health risk to the unsuspecting consumer. This functionality is a powerful aspect for the estimation of adulterant levels prior to subsequent analysis required for full quantitative analysis. Detecting the Unexpected in Honey Through Routine Food Profiling 9
Figure 4. Calibration curve of tadalafil.

Detecting the Unexpected in Honey Through Routine Food Profiling   10
Figure 5. UNIFI screenshot showing how a newly created library entry can be manually modified by addition of a
molfile.

Figure 6. Automatically generated summary plot of the compound tadalafil across the sample list in UNIFI.

Conclusion

Detecting the Unexpected in Honey Through Routine Food Profiling                                                 11
■   The ACQUITY UPLC I-Class PLUS with ACQUITY RDa Detector provides high efficiency separations with
     comprehensive, unbiased MS acquisition to provide information-rich data including accurate mass and

     isotope distribution for precursor and fragment ions to be used in metabolomics workflows in UNIFI.

 ■   The system is applicable for conducting profiling analysis in complex food matrices such as honey. Questions

     such as the differentiation between poly- and mono-floral honey types can be addressed along with the
     retrospective detection of illicit additives, unexpected contaminants and adulterants.

 ■   The simplified instrument system set up and streamlined workflow provides an improved experience for users

     that enables laboratories to find answers fast.

 ■   In this application note we used honey as the target matrix but also see potential for this technology platform
     and workflow in many different application areas within the food and beverage testing sector.

References

  1. Honey Market Size, Share & Trends Analysis Report by Application (Food & Beverages, Personal Care &
     Cosmetics, Pharmaceutical), by Distribution Channel, by Region, and Segment Forecasts, 2019–2025, Grand

     View Research, 2020 via https://www.grandviewresearch.com/industry-analysis/honey-market <
     https://www.grandviewresearch.com/industry-analysis/honey-market> .

 2. Honey Fraud – The Impact on Beekeeping, Poelsma, 2020 via https://www.vatorex.com/blog/bee-culture-
     3/post/honey-fraud-the-impact-on-beekeeping-17.

 3. Discrimination of Different Unifloral Honeys using an Untargeted High-Definition Mass Spectrometry

     Metabolomic Workflow, Wallace et al., 2017, Waters Application Note 720005963EN <
     https://www.waters.com/nextgen/us/en/library/application-notes/2017/discrimination-of-different-unifloral-

     honeys-using-an-untargeted-high-definition-mass-spectrometry-metabolomic-workflow.html> .

Featured Products

 ■   ACQUITY UPLC I-Class PLUS System

Detecting the Unexpected in Honey Through Routine Food Profiling                                                   12
■ UNIFI Scientific Information System ■ waters_connect HUB 720007087, January 2021 © 2021 Waters Corporation. All Rights Reserved. Detecting the Unexpected in Honey Through Routine Food Profiling 13
You can also read