Detection of Dust pollution using a Ka-Band Doppler Radar in a Tropical Location of West Africa

Page created by Annie Solis
 
CONTINUE READING
Detection of Dust pollution using a Ka-Band Doppler Radar in a Tropical Location of West Africa
ution Effec                                                                                                  OPEN     ACCESS Freely available online
               oll
           P

                           ts
                                          Journal of Pollution Effects & Control
   rnal of

                              & Control
Jou

         ISSN: 2375-4397

                                                                                                                                                            Research

Detection of Dust pollution using a Ka-Band Doppler Radar in a
Tropical Location of West Africa
Ayodeji Oluleye1*, Joseph Sunday Ojo2
1
 Department of Meteorology and Climate Science, Federal University of Technology, Akure, Nigeria; 2Physics Department, Federal University
of Technology, Akure, Nigeria

                                  ABSTRACT
                                  Apart from posing as leading cause of respiratory ailment, dust pollution over West Africa is known to hamper
                                  flight operations by reducing visibility during the dry season. Inspection of visibility is usually made through visual
                                  observation by meteorological observer, it accurate estimation therefore depends on the visual judgment of the
                                  observer. Also profile observations of atmospheric dust are not included in visibility record of meteorological
                                  stations. Much of the dust load in the atmosphere is held up in a layer above the surface which could descend to
                                  ground level resulting into poor visibility or lifted leading to clearance. In this paper, a method of dust pollution
                                  detection using radar reflectivity has been developed. Through this method, atmospheric dust load could be
                                  estimated and converted to visibility. Results of comparison between radar-derived visibility and observation show a
                                  good agreement with correlation coefficient of 0.81. Consequently, dust load beyond the reach of visual observation
                                  could be made enhancing atmospheric dust load prediction for aviation and health purpose among others.
                                  Keywords: Radar reflectivity; Aerosol dust; Pollution; Visibility; Particulate matters

Introduction                                                                                   asthma and sore throat. Good horizontal visibility is one of the
                                                                                               essential conditions for effective and smooth aviation operations.
Radiative properties of atmospheric dust aerosol significantly affect                          Impaired visibility could lead to accident, flight cancellation and
surface radiation balance when greater percentage of the incoming                              delays. Early dust outbreak detection could ameliorate most of the
solar radiations is reflected back to the atmosphere due to presence                           problems related to dust pollution and hospitalization. Various
of dust particles. The radiation effect may as well have direct                                methods of dust detection have been employed over years which
relationship with crops performance when radiation budgets are                                 include satellite measurements. As early as 1972, estimation of
alter dramatically. Apart from general radiative balance, the impact                           dust concentration in the atmosphere has been carried out when
of dust presence in the atmosphere over West Africa appears to                                 Prospero and Carlson [3] used satellite images (AVHRR) to derive
be diverse. Dust emanating from the Saharan and Sahel part of                                  dust emission estimates emanating from over West Africa to
West Africa has been analyzed and found to contain lot of minerals                             Florida and the Caribbean. Measurements from AVHRR were
and chemical compounds that alter the biogeochemical cycle over                                verified to be inadequate in monitoring dust pollution because it
both land and ocean. Part of dry Sahel support Agriculture where                               failed to distinguish between smoke, stratospheric aerosol, sea salt
inorganic fertilizer containing chemical compounds are used to                                 and dust pollution. Total Ozone Mapping Spectrometer (TOMS)
boost agricultural production. These chemicals compounds are                                   uses spectral difference between two contrasting wavelength to
carried along with loose dust particle during the period of dust                               estimate and distinguish between absorbing and non – absorbing
mobilization to distant locations where it will deposit as a form of                           aerosols [4]. TOMS measurements have long records of aerosol
nutrient to enrich the soil [1] and perhaps inhaled by human. Dust                             dataset spanning between November 1979 to December 2006
inhalation poses a threat to human health and has been reported to                             from where Ozone Monitoring Instruments (OMI) took over.
be a leading cause of epidemic such as meningitis [2]. Similarly, the                          TOMS data are sensitive to aerosol heights and can be misleading
presence of dust greatly reduces air quality and horizontal visibility.                        while interpreting dust pollution trapped within the Planetary
Poor air quality as a result of dust is often led to hospitalization                           Boundary Layer (PBL). Another satellite-based dataset is Moderate
for various respiratory diseases such as cough, allergic reactions,                            Resolution Imaging Spectroradiometer (MODIS) which started in

*Corresponding author: Ayodeji Oluleye, Department of Meteorology and Climate Science, Federal University of Technology, Akure,
Nigeria, E-mail: aoluleye@futa.edu.ng
Received date: March 16, 2020; Accepted date: April 09, 2020; Published date: April 16, 2020
Citation: Oluleye A, Ojo JS (2020) Detection of Dust pollution using a Ka-Band Doppler Radar in a Tropical Location of West Africa. J
Pollut Eff Cont 8:241. doi: 10.35248/2375-4397.20.8.241.
Copyright: © 2020 Oluleye A, et al. This is an open-access article distributed under the terms of the Creative Commons Attribution
License, which permits unrestricted use, distribution, and reproduction in any medium, provided the original author and source are
credited.

J Pollut Eff Cont, Vol. 8 Iss. 2 No: 241                                                                                                                           1
Detection of Dust pollution using a Ka-Band Doppler Radar in a Tropical Location of West Africa
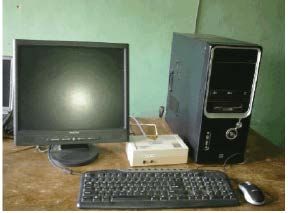
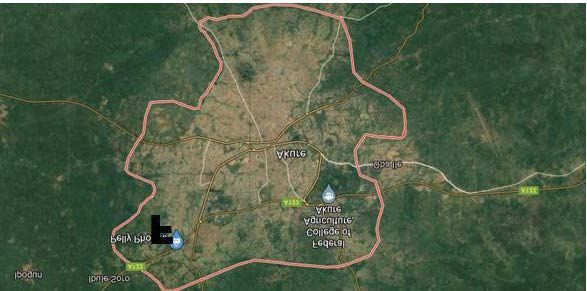
Oluleye A, et al.                                                                                                    OPEN      ACCESS Freely available online

1999 onboard of sun synchronous polar orbiting Terra (EOS AM)                     visibility from radar attenuation and concludes that visibility varies
satellite and capture data in about 36 spectral bands. It provides                between 10 m to 500 m for attenuation between 13 dbkm-1 and
accurate measurements of optical thickness. MODIS data can be                     0.2dBkm-1. Radar method of dust detection follows the principle of
used to estimate dust concentrations, flux and oceanic deposition                 rainfall estimation where intense pulses of microwave are emitted
[5]. Visual range observation is another method, but a ground-based               and directed to hit object of interest. The reflected backscattered
approach, by which dust pollution can be measured. Generally                      energy is transmitted to the receiver system of the radar. In rain-free
this method is usually employed in determination of visibility for                atmosphere, attenuation of the emitted microwaves is usually due
aeronautic operations at meteorological stations. Anuforom et al.                 to atmospheric particulate matters. From this assumption, dust
[6] found good correlation (r= -0.92) between TOMS UV absorbing                   pollution detection at different layers in the atmosphere can be
aerosol and horizontal visibility during the sub-Sharan Harmattan                 estimated. The focus of this research is on an attempt to detect
season over West Africa. Visibility data are not usually adequate in              dust pollution using the known characteristics of Sahara dust and
estimating large scale dust pollution because it is often recorded                Ka-band radar reflectivity factor. The specific objectives of this
as point data which preclude spatial display of pollution over a                  scheme are that (1) dust pollution at different atmospheric layers
large area. Since visibility depends on the visual capability of the              can be estimated by determining the atmospheric dust load using
observer, it suffers from observer’s judgment and therefore unable                the radar attenuation characteristics. (2) Comparison between the
to provide any information on the evolution of dust pollution.                    radar estimated dust load and actual “visibility” will be explored to
Ground instrumentations of various algorithms are available but                   determine the radar “sensitivity” to dust pollution detection which
Aerosol Robotic Network (AERONET) provides a global ground                        is important to air quality management.
station aerosol dataset. AERONET (a ground –based observation)
data had been used to test and improve dust emission and                          STUDY AREA AND METHOD
transport models [7], and analyze the characteristics of outbreak                 Akure, (latitude 7.20o - 7.32o and longitude 5.13o - 5.26o) a city in
of dust episode. AERONET data is still very inadequate because of                 Nigeria, shown in Figure 1, is tropical location with two distinct
its spatial coverage, for example, only few stations cover the entire             seasons namely; the dry season, which begins in November and lasts
West Africa. Similarly, Chin et al. [1] used a ground based Thermo                till March the following year and the wet season which starts with
Scientific Tapered Element Oscillating Microbalance (TEOM) to                     the pre-rainy period in March, spans through the peak of monsoon
sample PM10 over Cayenne and Guadeloupe. Like many ground                         period in June/July and ends in October. Akure is typically a
based measurements, the campaign is limited to very limited                       rainforest zone, which experiences a period of little dry season in
coverage.                                                                         August [10]. Average annual rainfall during the wet season is about
Radar system is also being used in dust pollution detection but                   1500 mm while average temperature ranges between 21.4 oC and
much of works on this subject had been based on estimating the dust               31.3 oC per annum, annual average humidity also ranges between
permittivity factors. The permittivity factor is necessary in designing           45.4% and 100% [11]. The dry season is characterized by episode
higher frequency links for areas affected by dust storms. However,                of severe pollution as a result of dust incursion into the area. The
permittivity factor alone only provides vague information about                   dust, which emanates from Sahara region of West Africa advects
dust pollution. Marzano [8] explored the potential of using weather               with the northeasterly winds blowing over the area, is a source of
radar to estimate volcanic ash and established the relationship                   many pathogens causing acute respiratory problems in humans
between radar reflectivity factor, ash concentrations and ash fall                [12,13]. Air quality and flight operations are adversely affected as a
rate. Islam et al. [9] explores the possibility of determining the                result of dust circulation during this period.

Figure 1: Akure Google map showing the approximate location of (Lat 7.25oN, Long 5.20oE). Letter “F” is the location of Federal University of Technology, Akure
where the MMR is sited.

J Pollut Eff Cont, Vol. 8 Iss. 2 No: 241                                                                                                                   2
Detection of Dust pollution using a Ka-Band Doppler Radar in a Tropical Location of West Africa
Oluleye A, et al.                                                                                                         OPEN   ACCESS Freely available online

Radar specifics, measurement site and method of dust                                 130 and 760 Tgyr-1 of dust are transported across West Africa.
estimation                                                                           Weather over the site is also influenced by wet south westerly wind
                                                                                     flow during the rainy season emanating from the Atlantic coast
Ka –band weather radar having technical characteristics shown                        and extending to the fringe of Sahel savanna between March and
in Table 1 was installed at the communication and research                           September on annual cycle. Dust pollution during the rainy season
measurement site in the campus Federal University of Technology,                     is low and is mainly due to local sources.
Akure, Nigeria. There are some radar bands are actually not suitable
for dust pollution detection. For example, Goldhrish [14] argued     Expression for derivation of dust pollution
that attenuation of radar signal as at L -band may be considered     Dust particles are capable of reflecting electromagnetic wave
negligible, meaning that such radar system may not detect dust       sent out from radar back to the earth. This backscatter echo
accurately. Dust attenuation at Ka radar frequency is very high;                              N
                                                                      P = ∑N ( D ) P ( D ) is related to the diameter spectrum of dust particles
dust detection using this band is also expected to increase in                        r
                                                                                           i =0
                                                                                                  i   i

accuracy. The equipment at our site is 8 cm wavelength vertically =   N ( Di ) N= o p ( Di )   i [ 0, N ] and can be expressed as in equation 1.
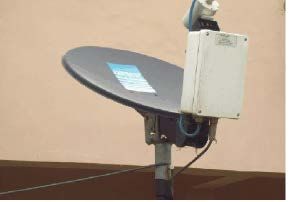
pointing, MMR-2 radar, shown in Figure 2, which measures                          N
reflectivity at 64 spectral frequencies. The radar was configured to       Pr = ∑N ( Di ) P ( Di ) 				                                           (1)
                                                                                i =0
a vertical range resolution of 30 m and Pulse Repetition of 0.2
                                                                     where Pr ∑N ( Di ) P ( Di ) is the probability that dust particle
microseconds. The site is a tropical location that often experiences
severe dust pollution during the boreal winter. During this period   diameter lies within dust diameter spectrum per meter
the Sahara dust migrates from the source regions of Faya Largeau,
Bodele depression and parts of Western Sahara desert aided by        square otherwise known as particle probability. Zhang et al.
                                                                                                                 N
dry but strong north easterly winds to the coast of Atlantic Ocean   [16] has shown that Pr = ∑N ( Di ) P ( Di ) , dust particle spectrum
and beyond. In the process of dust migration, visibility downwind                                              i =0

                                                                     diameter  =      N ( Di ) N= o p ( Di ) i [ 0, N ] and total number of particles
is always very poor with attendant hospitalization for respiratory
related diseases. Goudie and Middleton [15] estimated that between =  N ( Di ) N=   o p ( Di )   i [ 0, N ] are related by;

                                      Table 1: Technical characteristics of the Ka-band radar compared to other radar bands.
             Radar system                             Radar                         Radar                         Radar                       Radar
             Characteristics                         Ka- band                      S- band                       C- band                     X- band
                   Band                                  K                            S                             C                            X
                Frequency                           24.23GHz                  2.70 – 2.90 GHz                5.45 – 5.82 GHz                9.375 GHz
               Transmitter                          Gunn-diode                   Magnetron                      Magnetron                   Magnetron
         Transmit Peak Power                          50 mW                       600 kW                         250 kW                       50 kW
            RF Pulse Width                             0.2 µs                     0.8 -2 µs                      0.5 -2 µs                   0.5 -2 µs
                     PRF                            125,000 Hz                  250-5000 Hz                    250-2500 Hz                 250-2500 Hz
             Antenna Type                          Circ parabolic              Circ parabolic                 Circ parabolic              Circ parabolic
             Antenna Gain                             40.1 dB                      45 dB                          45 dB                       41.6 dB
               Polarization                          Linear H                     Linear H                       Linear H                    H and V
              Beam Width                                2.0o                        1.0o                           1.0o                         1.3o
           Reflector diameter                          0.6 m                        8.5 m                         4.2 m                        2.1 m
           Sensitivity (MDS)                         -37 dBm                      -113 dBm                      -113 dBm                     -112 dBm
         Receiver Noise Figure                         2 dB                         2 dB                           2 dB                       2.3 dB
                                           Table is modified after Marzano, with inclusion of K-band radar characteristics.

                 A                                                                        B

Figure 2: The MMR-2 unit (A) Indoor unit B) Outdoors unit.

J Pollut Eff Cont, Vol. 8 Iss. 2 No: 241                                                                                                                    3
Oluleye A, et al.                                                                                                            OPEN     ACCESS Freely available online

N ( Di ) N=
=         o p ( Di ) i              [0, N ] 			                                      (2)               5.51× 10⁻⁴ 				                                           (9)
                                                                                                Vx =
Combining equations (1) and (2) yields the relationship                                                   NT r 2

between echo power
                                             N
                                    Pr = ∑N ( Di ) P ( Di ) ,    particle probability       An average value for particle size diameter of 0.0005 mm [19] has
       N
                                            i =0                                            been used in consistency with mean dust probability over West
 Pr = ∑N ( Di ) P ( Di ) , total number of particle
                                               =    N ( Di ) N=
                                                              o p ( Di ) i        [0, N ]   Africa.
      i =0
                                                           N

and the echo power per each particle Pr = ∑N ( Di ) P ( Di ) is expressed                   Visibility records usually made by observers at meteorological
                                                          i =0
                                                                                            stations are based on visual inspection and are quite subject to the
in equation 3 according to Wang et al.[17];                                                 personal judgment of the observer and are limited to few vertical
                N
      Pr = ∑N o P ( Di ) p ( Di ) 			                                                (3)    distances in meters. However, it can be used to the determine
               i =0                                                                         presence of dust load in the atmosphere. So in this paper, we have
The density of dust particle is an important parameter, which                               explored the use of radar reflectivity data to determine visibility
indicates turbidity status of the atmosphere during a dust event and                        and compare results with those “observations”.
it is a measure of horizontal poor visibility. The relationship
                                                         N
                                                                between                     This is possible because reflectivity is the radar signal obtained after
density=  w 3.79 × 10⁻⁷ NT and dust probability Pr = ∑N ( Di ) P ( Di ) can                 the initial signals sent out by the radar hit certain object (in the
be expressed as [14];                                  i =0
                                                                                            case dust particles) and scattered back to radar receivers at the base
             N ( Di )
     Pi =               					                                                        (4)    station. The scattered signal is a direct function of dust load in the
               NT
                                                                                            atmosphere. So when many dusts are present in the atmosphere
Mass loading of dust is directly related to the dust density                                more signals is scattered and reflectivity is high. This relationship is
                                                    N
w 3.79 × 10⁻⁷ NT
=                       and probability Pr = ∑N ( Di ) P ( Di ) [14];                       explored here and we found that it has a very good correlation with
                                                   i =0                                     observed visibility from observers’ record as shall be shown later.
         4                 
     w =  π NT ρ   ∑ri3 Pi         				                                          (5)
         3        i                                                                     Ground-based visibility, TOMS and Aqua terra AOD
where is the dust particle density assumed to 2.6 gm/cm3, and the                           Ground-based visibility data of year 2014 on daily basis,
                                                                                            corresponding to period of radar data, were obtained from the
                   4                 
value of       w =  π NT ρ   ∑ri3 Pi    has been inferred from the work of              archive of OGIMET SYNOP (https://www.ogimet.com/) over
                   3        i        
                                                                                            Akure. OGIMET SYNOP is a summary of daily weather for
Ghobrial [18] who measured particle size distribution for four
                                                                                            several countries of the world recorded in World Meteorological
dust storm events in Khartoum (Sudan). Based on various particle
                                                                                            Organization (WMO) international code format. Apart from
diameter distributions, Goldhrish [14] calculated the mean dust
                                                                                            dust, several other atmospheric constituents may be attributed to
                                           4                 
probability and found that             w =  π NT ρ   ∑ri3 Pi    is 3.48×10⁻⁵ (mm)3.     a reduction in visibility such as heavy rainfall and fog. However,
                                           3        i        
                                                                                            during the dry season over West Africa, poor visibility is majorly
Substituting these values into equation (5), it can be shown that
                                                                                            caused by dust incursion. Thus, the focus of the study shall be on
the mean dust mass loading (gm/m3) is;                                                      the dry period when there was prevailing dust circulation in the
   w 3.79 × 10⁻⁷ NT
   =                                                                                (6)     atmosphere. Ozone Monitoring Instrument (OMI) on aboard the
                                                                                            NASA Earth Observing System (EOS) Aura satellite also provides
Wang et al. [17], using radar data over the Taklimakan desert,                              a measure of atmospheric dust in form of UV absorbing aerosol
also showed that mass concentration M (µg/m3) of dust could be
                                                                                            index (UV_AI). OMI data was designed to continue the long-term
expressed in term of radar reflectivity in form of Z-M relationship
                                                                                            records of Total Ozone Mapping Spectrometer (TOMS). Kroon et
given in equation (7);
                                                                                            al. [20] compared TOMS and OMI data products and found that
      Z = AM b 					                                                                 (7)    up to 99% correlation exists between the two datasets and therefore
                                                                                            complementary. UV_AI value could range between 0 and 6. Higher
where A and b are constants whose values are 22,988.3 and 1.006
for a floating dust. Equations 6 and 7 can be combined to find                              values of 3 and above indicate high dust concentrations in the
the relationship between radar reflectivity Z and dust total density                        atmosphere [21]. Moderate Resolution Imaging Spectroradiometer
=w 3.79 × 10⁻⁷ NT by by adjusting the equation to have the same unit                        (MODIS) is an instrument on board of the Terra (EOS AM) and
and noting that dust mass loading and dust mass concentration                               Aqua (EOS PM) satellites. Aerosol Optical Depth (AOD 550
are the same, accordingly dust total density= w 3.79 × 10⁻⁷ NT can be                       nm) from aqua terra is another index that indicates the presence
expressed as;                                                                               of dust in the atmosphere. Details description of MODIS AOD
                                                                                            which include spatial resolution and retrieval error estimate can be
                        1/ b
            Z                                                                             found in Ridley et al. [22]. Both UV_IA and AOD 550 nm level 3
                  				                                                             (8)
             A
      NT =   −7                                                                           data were obtained from NASA gridded data interface (Giovanni
          3.79 × 10                                                                         https://giovanni.gsfc.nasa.gov/giovanni/) at daily time resolution
                                                                                            and extracted for the study location.
Finally, we obtained the visibility, Vx (km) from the expression
in equation 9 according to Goldhrish [14]. Equation 9 relates the                           RESULTS AND DISCUSSION
                                w 3.79 × 10⁻⁷ NT and particle radius
visibility with particle density=
r, which allows radar estimation of dust profile. Vertical profile                          Visibility observation
of dust allows the forecasters to make accurate forecast about                              Horizontal visibility range (visual distance from the observer) has
dust episode by knowing the dust thickness at each layer in the                             a direct relationship with the amount of particulate matters in the
atmosphere. This method can be incorporated into radar computer                             atmosphere. Anuforom et al. [6] categorized amount of dust in
algorithm which will gives final output of dust profile.                                    the atmosphere based on visibility range as Thick dust occurrence

 J Pollut Eff Cont, Vol. 8 Iss. 2 No: 241                                                                                                                        4
Oluleye A, et al.                                                                                                                                                     OPEN        ACCESS Freely available online

(THD) when visibility is ≤ 1,000 m, Light dust haze when visibility                                                 dust profile. Dust accumulation during the dry season occurs at
is ˃1,000 m and visibility ≤5, 000 m and clear atmosphere when                                                      such height above the ground that visual observation might not
visibility is > 5000 m. This categorization, which has been used also                                               adequately capture for recording. Due to atmospheric mixing,
by other researchers such as Goudie et al. [15] and Engelstaedter                                                   accumulated dust could descend rapidly within short time resulting
et al. [23], applies only during the dry season when atmospheric                                                    into visibility deterioration. This situation usually is unpredictable
dust accounts for almost all cases of turbidity in the atmosphere.                                                  using visual observation. However, radar profile measurements
In Table 2, daily frequency of occurrence of visibility is presented                                                would capture dust accumulation above the ground, thus making
which showed that THD occurred only in January four times and                                                       occurrence of dust prediction possible and increase the reliability
once in February. However, LHD occurrence was more frequent in                                                      of ground observation especially for flight operations.
the month of January, February, August October and December.
Since thick dust occurrence over Akure is very rare in August
                                                                                                                    Radar measurement of visibility
and October, only January, February, March and December poor                                                        Based on equation 9, radar-derived visibility was obtained as shown
visibility is attributable to dust occurrence. The total number of time                                             in Figure 3 (upper panel). This figure illustrates the time evolution
when both THD and LHD occurred in January and December was                                                          of dust occurrence during the course of a day on January 1, 2014. It
39 days out of 61 days with January as the haziest month of the year,                                               also showed the profile of visibility between the ground and a range
having a mean visibility range of about 4 km. During those times,                                                   of about 4 km. Visibility on this day varies between from 8 km close
frequent flight delay and cancelation could occur with attendant                                                    to the surface, to 12 km at an altitude of about 1000 m. It is clear
loss of productive time and income. It should be noted that the                                                     that visibility was rather poor in the morning hours recording about
visibility observation present here does not include the profile of                                                 8 km but improved during the afternoon hours to about 10 km
atmospheric dust, as visual observations cannot sufficiently estimate                                               and later became poor in the evening hours. This was also shown

                              Table 2: Visibility categorization based on frequency of occurrence using the daily data of year 2015.
       Months                   100-1000 (m)                                         1001 -5000 (m)                                5001 (m) and above                         Total            Mean (km)
        January                                            4                              21                                                  6                                   31              4.03
       February                                            1                                  7                                               20                                  28              7.90
        March                                              0                                  6                                               25                                  31              9.00
         April                                             0                                  0                                               30                                  30              12.3
          May                                              0                                  0                                               31                                  31              12.9
         June                                              0                                  0                                               30                                  30              12.1
          July                                             0                                  0                                               31                                  31              10.5
        August                                             0                                  4                                               27                                  31              9.20
      September                                            0                                  0                                               30                                  30              10.8
       October                                             0                                  1                                               30                                  31              10.7
      November                                             0                                  0                                               30                                  30              11.1
      December                                             0                              14                                                  17                                  31              6.82

                                                                                                          visibility (km)

                                                 4000

                                                                                                  0
                                                                                                  2
                                                                                                  4
                                                                                                  6
                                                                                                  8
                                                                                                  12
                                                                                                  10                    8
                                                 3000                                                  2
                                                                                                       02
                                                                                                       1
                                                                                                       6
                                                                                                       8 0 4        4
                                                                                                                    8
                                                                                                                    6                          4
                                                                                                                                               6
                                                                                                                                               8             40
                                                                                                                                                             6
                                                                                                                                                             82
                                                                                                                                                             10
                                                                                                                                                             12                 6
                                                                                                                                                                              108
                                                                                                                   12
                                                                                                                    0                          8
                                                                                                                                               4
                                                                                                                                               6
                                                                                                                                               2
                                                                                                                                              10                             412
                                Heigth (m)

                                                                                                                                               2
                                                                                                                                               0    4
                                                                                                                                                    2
                                                                                                                                                    8
                                                                                                                                                    6                        2
                                                                                                                                                                             0
                                                                                                                                                   10
                                                                       18
                                                                        6
                                                                        4
                                                                        2
                                                                        02
                                                                         0                                                                                             8
                                                                                                                                                                       6
                                                                                                                                                                       4
                                                                                                                                                                       2
                                                                                                                                                                      12
                                                                                                                                                                       0
                                                                                                                                                                       0
                                                 2000
                                                                             12          12
                                                 1000                                                                                                                        12
                                                                             10 12                                       1210                                              10
                                                                                              8                                                              8
                                                                             8                               8                            8                                8
                                                                                                                              10
                                                                   0                 5                         9                         14                      18

                                                                                                                 Time (hrs)

                                                           25

                                                                                                                                                                  vis160 m
                                                           20
                                                                                                                                                                  vis320 m
                                         visibility (km)

                                                           15

                                                           10

                                                               5
                                                                   0                 5                   9                          14                  18                        23

                                                                                                                 Time (hrs)

Figure 3: Visibility as estimated from radar reflectivity. Upper panel shows the diurnal variation of visibility profile while the lower panel indicates visibility
at the two lowest radar range of 160 m and 320 m.

J Pollut Eff Cont, Vol. 8 Iss. 2 No: 241                                                                                                                                                                     5
Oluleye A, et al.                                                                                                  OPEN   ACCESS Freely available online

in lower panel of Figure 3, that, between the hours of 900 GMT                   in the region emanates from, but decreases in accuracy towards the
and 1800 GMT there was an improved visibility. This diurnal dust                 cost of Gulf of Guinea (GoG). Accordingly, in Akure, a tropical
characteristic is an obvious feature of dusty atmosphere during the              rainforest location at the fringe of GoG, lack of correspondence
dry season over tropical West Africa and has direct relationship with            may be expected. Extraction of dust indices for single station is
the evolution of Atmospheric Boundary Layer (ABL) over the region.               generally less accurate than area or regional average and this may
During the hours of night and early morning, ABL is shallow and                  have affected it synchronization with single station observation.
typically much dust is retained in the lower atmosphere resulting into           During the period, both MODIS AOD and OMI-AI show
pollution. As the ABL deepens during the later morning around 1000               moderate dust concentration corresponding to 2.5 AI and 1.3
GMT due to convection, dust pollution is lifted leading to improved              AOD. Correlation between observed and radar-derived visibility
visibility. Convection becomes weakened during the evening hours                 is 0.81 as presented in Figure 5. Similar correlations between
and ABL depth becomes shallower resulting into dust pollution in the             observed visibility and AOD and OMI-AI are rather poor for
lower atmosphere close to ground level.                                          obvious reasons. However, we observed that correlation between
                                                                                 MODIS AOD and OMI_AI is very high (0.76), an indication that
Comparisons between Radar, observed visibility, OMI UV                           the two datasets could supplement each other.
aerosol index and MODIS AOD 550 nm
Radar-derived visibility was compared with some atmospheric
                                                                                 CONCLUSION
aerosol indices OMI_AI and MODIS AOD) and also with                              This study focused on detection of dust pollution using radar
observed visibility. Availability of fairly complete dataset dictates            reflectivity during the dry season in a tropical location in West
the choice of period for this comparison. We found the month                     Africa. Using ka-band radar characteristics, this paper has
of December 2014 most suitable as both radar and observed                        demonstrated a method through which dust pollution can be
visibility have only one missing day, thus comparison is based on                detected from the relationship between atmospheric dust load
30 days of continuous data. In Figure 4, a temporal variation for                and radar reflectivity. The result from this method was compared
month-long data is presented. Observed daily visibility at 9:00 AM               with actual visibility observation and a very good agreement was
shows clear visibility in the first 8 days recording up to 16 km and             found with correlation coefficient of 0.81. Since radar signal
deteriorates thereafter to poor visibility of about 6 km. Radar-                 could reach deeper into the atmosphere, profile of dust pollution
derived visibility followed the observed visibility closely showing              in the atmosphere could also be made from radar reflectivity.
similar pattern. However, records of MODIS AOD and OMI_                          Consequently radar-derived visibility measurement offers a unique
AI deviate significantly from both observed and radar—derived                    advantage over visual observation of visibility by providing layer-by-
visibility. Nevertheless, both MODIS AOD and OMI_AI show                         layer details of dust in the atmosphere and enhances prediction of
similar patterns. The reason for lack of correspondence between                  dust occurrence or clearing for aviation purposes among others.
observation and the satellite-derived dust indices could be due to
several factors such inconsistent time between satellites over-pass
                                                                                 DECLARATION OF INTERESTS
and observation as well as location factor. It has been show by                  The authors declare that they have no known competing financial
Anuforum et al. [6] that corresponding between UV_AI is very                     interests or personal relationships that could have appeared to
good in the Sahel region of West Africa where the dust circulating               influence the work reported in this paper.

                                         15                                                  20

                                                                                             15
                                                                            Rad Visibility
                        Obs visibility

                                         10

                                                                                             10

                                          5                                                    5
                                              0   10          20    30                             0   10          20          30

                                                       days                                                 days

                                          3                                                  1.5

                                          2                                                    1
                                                                         AOD 550nm
                            OMI-AI

                                          1                                                  0.5

                                          0                                                    0
                                              0   10          20    30                             0   10          20          30

                                                       days                                                 days
Figure 4: Temporal variation of radar-derived, MODIS 550 nm, OMI-AI and Observed visibility.

J Pollut Eff Cont, Vol. 8 Iss. 2 No: 241                                                                                                             6
Oluleye A, et al.                                                                                                                                                                                      OPEN       ACCESS Freely available online

                                                                           : R=0.81751
                                                                                                                                                                                        : R=-0.42084

                                                    Data                                                                                           16
                                       16                                                                                                                           Data
                                                    Fit
                                                                                                                                                                    Fit
                                                    Y=T
                                                                                                                                                                    Y=T
                                       15                                                                                                          14

                                       14
                                                                                                                                                   12

                                       13
                                                                                                                                                   10
               Radar Visibility (km)

                                                                                                                           Radar Visibility (km)
                                       12
                                                                                                                                                    8

                                       11

                                                                                                                                                    6
                                       10

                                                                                                                                                    4
                                        9

                                                                                                                                                    2
                                        8

                                        7                                                                                                           0
                                            7   8         9       10       11       12       13   14   15        16                                     0       2               4   6          8            10   12   14         16

                                                                  Observed visibility (km)                                                                                                   OMI-AI

                                                                           : R=-0.43825                                                                                                     : R=0.76995

                                       16                                                                                                                                 Data
                                                    Data
                                                    Fit                                                                                                                   Fit
                                                                                                                                                    2.5
                                                    Y=T                                                                                                                   Y=T
                                       14

                                       12
                                                                                                                                                        2

                                       10
               Radar Visibility (km)

                                                                                                                                                    1.5
                                                                                                                                OMI-AI

                                        8

                                        6                                                                                                               1

                                        4

                                                                                                                                                    0.5

                                        2

                                                                                                                                                        0
                                                2             4        6        8         10      12        14        16                                    0        0.5                1             1.5         2        2.5

                                                                            AOD 550nm                                                                                                       AOD 550nm

Figure 5: Line of best fit between radar-derived visibility, AOD 550nm, TOMS and Observed visibility.

ACKNOWLEDGEMENTS                                                                                                                     7. Prospero JM, Ginoux P, Torres O, Nicholson SE, Gill TE. Environmental
                                                                                                                                        characterization of global sources of atmospheric soil dust identified
The author wish to thank research team at the department of                                                                             with the Nimbus 7 Total Ozone Mapping Spectrometer (TOMS)
Physics, Federal University of Technology, Akure for making                                                                             absorbing aerosol product. Reviews of Geophysics. 2002;40(1):1-31.
available the radar data used for this study. Many thanks are also                                                                   8. Marzano FS. Volcanic ash cloud retrieval by ground-based microwave
due NASA data processing team for MODIS and OMI data.                                                                                   weather radar. EEE Transactions On Geoscience And Remote Sensing,
                                                                                                                                        2006;44(11):3235-3246.
REFERENCES
                                                                                                                                     9. Islam MR, Elshaikh O, Khalifa ZE, Alam OO, Khan AZ, Elabdin Z,
1. Chin M, Diehl T, Tan Q, Prospero JM, RA Kahn, Remer LA, et al. Multi-                                                                et al. Prediction of signal attenuation due to duststorms using mie
   decadal aerosol variations from 1980 to 2009: A perspective from observations                                                        scattering. IIUM Engineering Journal, 2010;11(1):71-87.
   and a global model. Atmos Chem Phys. 2014;14(7):3657–3690.
                                                                                                                                     10. Oluleye A, Okogbue EC. Analysis of temporal and spatial variability of
2. Sultan B, Labadi K, Guégan JF, Janicot S. Climate drives the meningitis                                                               total column ozone over West Africa using daily TOMS measurements.
   epidemics onset in West Africa. PLoS Med 2005;2(1): e6.                                                                               Journal Atmospheric Pollution Research,2013;85(9):387- 397.
3. Joseph M, ProsperoJ, Carlson TN. Vertical and areal distribution of                                                               11. Balogun AA, Morakinyo TE, Adegun OB. Effect of tree-shading
   Saharan dust over the western equatorial north Atlantic Ocean. Journal                                                                on energy demand of two similar buildings. Journal of Energy and
   of Geophysical Research. 1972;77(27): 5255-5265.                                                                                      Building. 2014;81:305-315.
4. Torres O, Bhartia PK, Herman JR, Sinyuk A, Ginoux P, Holben B.                                                                    12. Oluleye A. Role of meteorology in major dust pollution outbreak of
   A long-term record of aerosol optical depth from toms observations                                                                    20th – 29th march 2010 over South Coast of West Africa. Journal of
   and comparison to aeronet measurements. J Atmospheric Sciences.                                                                       pollution effects and control. 2017;5(2):192.
   2002;59:398–413.
                                                                                                                                     13. Oluleye A, Folorunsho A. Influence of atmospheric dynamic factors
5. Kaufman YJ, Boucher O, Tanré D, Chin M, Remer LA, Takemura                                                                            on dust aerosol mobilization over west Africa: simulations from WRF-
   H. Aerosol anthropogenic component estimated from satellite data.                                                                     chem Aerosol Science and Engineering. 2019;3:132-149.
   Journal of Geophysical Research Letters. 2005;32(17):1-4.
                                                                                                                                     14. Goldhirsh JA. Parameter review and assessment of attenuation and
6. Anuforum AC, Akeh, LE, Okeke PN, Opara FE. Interannual varaibility                                                                    backscatter properties associated with dust storms over desert regions
   and long-term trend of UV-absorbing aerosols during harmatan season                                                                   in the frequency range of 1 to 10 GHz. IEEE Trans. Antennas Propag.
   in sub-saharan West Africa. Atmos Environ 2006;41:1550-1559.                                                                          1982;30:1121-1127.

J Pollut Eff Cont, Vol. 8 Iss. 2 No: 241                                                                                                                                                                                                     7
Oluleye A, et al.                                                                                                OPEN     ACCESS Freely available online

15. Goudie AS, Middleton NJ. Sahara dust                  storms:   Nature     20.Kroon M, Veefkind JP, Sneep M, McPeters RD, Bhartia PK,
    andconsequences. Earth Sci Rev 2001;56:179-204.                               Levelt PF. Comparing OMI‐TOMS and OMI‐DOAS total ozone
                                                                                  column data. Journal of Geophysical Research Atmospheres.
16. Zhang RJ, Wang MX. Meteorology analysis of the sand/dust storm.
                                                                                  2008;113(16):1-17.
    Scientific Chinese, 2001;5: 12–13.
                                                                               21. Adeyewa ZD, Oluleye A. Relationship between aerosol index, ozone,
17. Wang M, Ming H, Ruan RL, Yang D. Qantitative detection of mass
                                                                                   solar zenith angle and surface reflectivity: a case study of satellite
    concetration of sand-dust storms via wind-profiling radar and analysis
                                                                                   observations over LagFos. International journal of remote sensing
    of Z-M relationship. Journal of Theoretical and applied climatology.
                                                                                   2011;32(9):2605-2620.
    2012;126:3-4.
                                                                               22.Ridley DA, Heald CL, Kok JF, Zhao C. An observationally constrained
18. Ghobrial SI. The effect of sand storms on microwave propagation, Proc
                                                                                  estimate of global dust aerosol optical depth. Atmos. Chem. Phys.,
    Bar Telecommun Corlf. 1980;2:43.5.1-43.5.4.
                                                                                  2016;16:15097-15117.
19. Ruike Y, Zhensen W, Jinguang Y. The study of MMW and MW
                                                                               23.Engelstaedter S, Tegen I, Washington R. North African dustemissions
    attenuation considering multiple scattering effect in sand and dust
                                                                                  and transport. Earth Sci Rev 2006;79:73-100.
    storms at slant paths,” International Journal of Infrared and Millimeter
    Waves, 2003;24(8):1383-1392.

J Pollut Eff Cont, Vol. 8 Iss. 2 No: 241                                                                                                             8
You can also read