Detroit's Long Road Ahead - Summer 2020 - MULTIFAMILY REPORT - Yardi Matrix
←
→
Page content transcription
If your browser does not render page correctly, please read the page content below

MULTIFAMILY REPORT

Detroit’s
Long Road
Ahead
Summer 2020

                              Unemployment Soars

                           Investment Activity Halts

                     Development Favors RBN Assets
DETROIT MULTIFAMILY
                                                                                Recent Detroit Transactions
                                                                                Independence Green

Investors Pull Back
As Job Losses Mount
Detroit’s multifamily market faced its share of challenges in                   City: Farmington Hills, Mich.
the first half of 2020, and the road is steep. Rent expansion re-               Buyer: JRK Property Holdings
                                                                                Purchase Price: $100 MM
mained positive at 0.2% on a trailing three-month basis through
                                                                                Price per Unit: $101,427
June. Lifestyle rates, typically more volatile during a downturn,
were up 0.3% as a result of limited supply. Renter-by-Necessity
figures increased by 0.1%. As nearly all of Detroit’s 4,895 units               Atrium
under construction fell into this category, we expect rent im-
provements to further soften as projects deliver.

Michigan entered a state of emergency in early March following
the state’s first confirmed cases of COVID-19, effectively bring-
ing Detroit’s economy to a halt. Unemployment jumped from
5.4% in March to 26.4% in May. Leisure and hospitality was the
hardest-hit area, but all sectors saw significant losses through                City: Southfield, Mich.
May. The recovery will be slow: Although Michigan moved closer                  Buyer: Contour Development
to reopening in June, concerns over a second wave of cases led                  Group
the governor to hit the brakes on easing further restrictions.                  Purchase Price: $4 MM
                                                                                Price per Unit: $37,500
Transaction volume reached $153 million in the first half of 2020.              Riverside Senior
All of the metro’s transactions during this period involved Renter-
by-Necessity properties—with value-add potential—in Detroit’s sub-
urbs. However, uncertainty stemming from the pandemic gave in-
vestors pause: No major transactions closed after the start of April.

                                                                                City: Utica, Mich.
Market Analysis | Summer 2020                                                   Buyer: Shamrock Acquisitions
                                                                                Purchase Price: $3 MM
                                                                                Price per Unit: $51,389
Contacts
Jeff Adler                                         Ron Brock, Jr.
                                                                                Dearborn View
Vice President & General                           Industry Principal, Matrix
Manager of Yardi Matrix                            JR.Brock@Yardi.com
Jeff.Adler@Yardi.com                               (480) 663-1149 x2404
(800) 303-615-3676
                                                   Author
Jack Kern                                          Jeff Hamann
Director of Research                               Associate Editor
and Publications
Jack.Kern@Yardi.com                                                             City: Inkster, Mich.
(800) 866-1124 x2444                                                            Buyer: The Goldstone Group
                                                                                Purchase Price: $26 MM
                                                                                Price per Unit: $55,315
On the cover: Photo by felixmizioznikov/iStockphoto.com
RENT TRENDS

➤ Detroit rents rose 0.2% on a trailing three-month        torium expired in July, Detroit renters were
  basis through June, contrary to the national rate’s      granted an extension through mid-August. Ad-
  0.3% decrease. The metro’s average rent was              ditionally, in July, the Michigan State Housing
  $1,022, 26.1% less than the $1,382 national price.       Development Authority set aside $50 million
                                                           for rental assistance for tenants earning up to
➤ Lifestyle rents in Detroit increased 0.3% to             100% of the area median income.
  $1,590, even as national higher-end rents fell
  0.3%, partly due to a lack of supply at the high      ➤ In June, the Bloomfield Hills/Birmingham
  end of the quality spectrum. Renter-by-Neces-           ($1,351), Dearborn ($1,340) and Detroit–
  sity rates increased 0.1% to $980. As the vast          Downtown ($1,322) submarkets had the high-
  majority of developments underway were RBN              est average rents. After decades of decay,
  projects, rents in lower-end properties may             Detroit’s downtown area has drawn interest
  soften amid new deliveries.                             in recent years, with major developments an-
                                                          nounced in 2018 and 2019, from Ford’s $740
➤ State and local governments took several ini-           million redevelopment of Michigan Central Sta-
  tiatives to reduce the economic fallout from            tion to the University of Michigan’s $300 million
  the crisis. Although a statewide eviction mora-         Detroit Center for Innovation.

Detroit vs. National Rent Growth (Trailing 3 Months)

Source: Yardi Matrix

Detroit Rent Growth by Asset Class (Trailing 3 Months)

Source: Yardi Matrix

                                                                    Detroit Multifamily | Summer 2020         3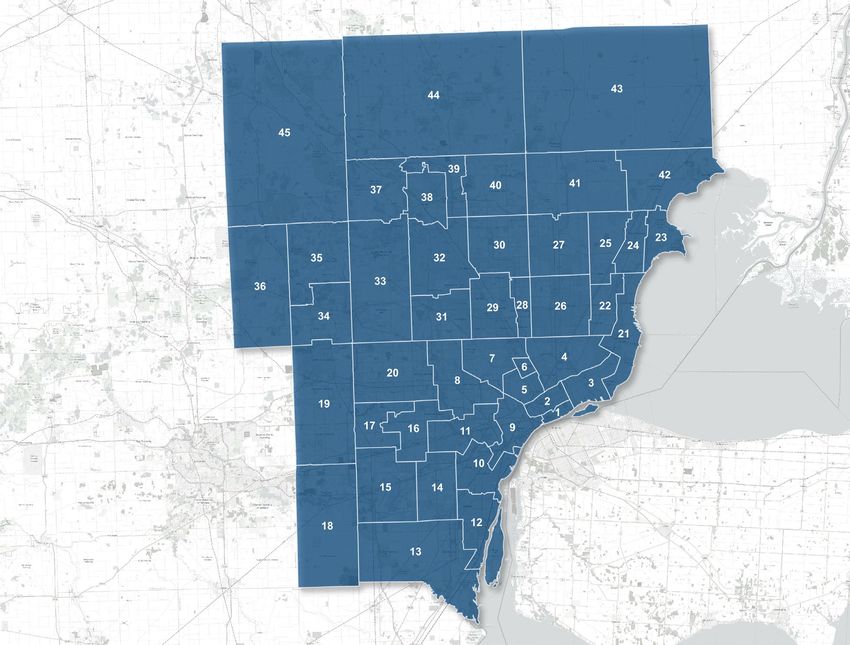
ECONOMIC SNAPSHOT

➤ The COVID-19 pandemic dealt Detroit’s econ-                       expected: In May and June, employers in the
  omy a significant blow. The metro’s unemploy-                     Detroit metro filed 32 notices under the Worker
  ment rate was 26.4% as of June, compared to                       Adjustment and Retraining Notification Act, af-
  the 11.1% U.S. rate. The largest job losses oc-                   fecting nearly 8,500 full-time positions.
  curred in the leisure and hospitality sector, which
  contracted by 52.8% year-over-year through                     ➤ After April’s initial surge in COVID-19 cases,
  May. None of Detroit’s employment sectors saw                    Gov. Gretchen Whitmer enacted a statewide
  gains, resulting in a 19.9% slide.                               shutdown, shuttering many businesses and
                                                                   restricting many nonessential activities. After
➤ Major employers had announced furloughs and                      entering Phase 4 of the the state’s reopening
  layoffs as a result of the pandemic. Among                       plan, an uptick in new cases forced the gover-
  many others, Henry Ford Health System and                        nor to extend Michigan’s state of emergency
  Trinity Health Michigan cut a combined total                     through early September, and reinstate
  of 5,400 jobs in April. Future redundancies are                  COVID-19-related restrictions.

Detroit Employment Share by Sector
                                                                                        Current Employment
 Code                          Employment Sector                                      (000)           % Share
  50      Information                                                                   25              1.5%
  55      Financial Activities                                                         115              7.0%
  90      Government                                                                   180             11.0%
  15      Mining, Logging and Construction                                              61              3.7%
  80      Other Services                                                                56              3.4%
  40      Trade, Transportation and Utilities                                          322             19.6%
  60      Professional and Business Services                                           338             20.6%
  65      Education and Health Services                                                262             16.0%
  30      Manufacturing                                                                185             11.3%
  70      Leisure and Hospitality                                                       97              5.9%
Sources: Yardi Matrix, Bureau of Labor Statistics

Population                                          Detroit vs. National Population

➤ The metro lost 6,813 residents in                                 2016           2017        2018        2019
  2019, contracting by 0.2%, while the
  U.S. population grew by 0.3%.                      National   323,071,342 325,147,121 327,167,434 328,239,523

➤ Suburbs have long buoyed the met-
                                                     Detroit
  ro’s demographics: The city of De-                               4,316,198     4,321,704    4,326,442   4,319,629
                                                     Metro
  troit’s population has declined every
  year since 2010, according to The                 Sources: U.S. Census, Moody’s Analytics
  Brookings Institution.

                                                                               Detroit Multifamily | Summer 2020      4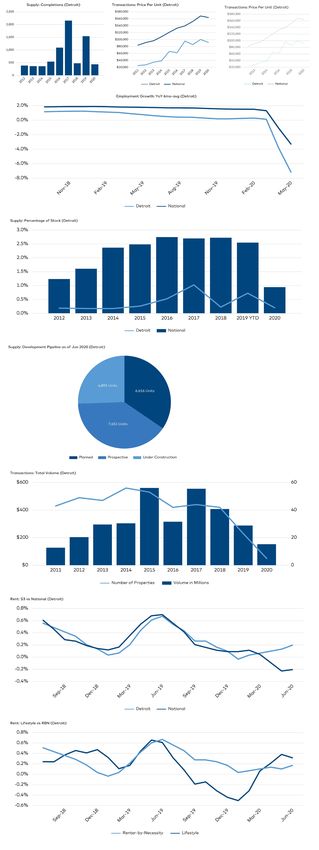
SUPPLY

➤ Detroit had 4,895 units under construction         ➤ Ginosko Development Co.’s January delivery
  as of June, accounting for 0.3% of completed         of the 200-unit Renaissance Estates of Ecorse
  inventory. An additional 14,000 units were in        in the Lincoln Park/Melvindale submarket was
  the planning and permitting stages. Although         the largest completion in the first half of 2020.
  Michigan’s government had halted nearly all          Developers broke ground on the fully affordable
  construction between March and late April due        development in early 2018. The property was
  to the coronavirus pandemic, developments            financed through Michigan State Housing De-
  moved forward once the sector was reopened.          velopment Authority bonds and HUD loans.

➤ After delivering 1,544 units in 2019, developers
  added 436 units, or 0.2% of total inventory, to       Detroit Completions (as of June 2020)
  Detroit’s rental stock in 2020 through June.
  While an additional 3,286 units were slated
  for completion by year-end, many projects will
  likely face delays given the myriad uncertain-
  ties surrounding the pandemic. Bucking a na-
  tionwide slant toward the Lifestyle segment,
  all of the year’s deliveries through June were
  in Renter-by-Necessity assets.

➤ Downtown Detroit led development activity
  with 1,027 units underway, or 21% of the con-
  struction pipeline. The largest project was Mo-
  ceri Cos.’ Montclair at Partridge Creek, a 613-
  unit development in the Clinton Township-
  West submarket. The project broke ground in
  2015 and is slated to deliver in 2022.                Source: Yardi Matrix

Detroit vs. National Completions as a Percentage of Total Stock (as of June 2020)

Source: Yardi Matrix

                                                                    Detroit Multifamily | Summer 2020      5
TRANSACTIONS

➤ In the first six months of 2020, Detroit’s trans-      was $92,140, an 8.4% decrease from 2019’s
  action volume totaled $153 million, though all         $100,547, and 39% lower than the national
  but one sale occurred in the first quarter. While      average of $152,119.
  significantly higher than the $25 million closed
  during the first half of 2019, activity came to a   ➤ JRK Property Holdings’ $99.5 million acquisition
  halt in early April as investors reassessed moves     of the 981-unit Independence Green in Farming-
  due to the COVID-19 pandemic.                         ton Hills was the metro’s largest transaction in
                                                        2020 through June. Berkadia provided the buyer
➤ All of Detroit’s multifamily sales in 2020            with an $82 million Fannie Mae loan for the pur-
  through June involved Renter-by-Necessity as-         chase. Seller Hayman Co. acquired the asset for
  sets in the suburbs. The average price per unit       $53 million from Aimco in late 2013.

Detroit Sales Volume and Number of Properties Sold (as of June 2020)

Source: Yardi Matrix

Top Submarkets for Transaction Volume1                Detroit vs. National Sales Price per Unit

                                     Volume
            Submarket                ($MM)
 Farmington Hills/West
                                      179
 Bloomfield
 Rochester Hills                       88
 Dearborn Heights/Inkster              26
 Waterford                             24
 Auburn Hills                          23
 Canton/Plymouth                       20
 Wayne/Romulus                         17
                                                      Source: Yardi Matrix
Source: Yardi Matrix
1 From July 2019 to June 2020

                                                                    Detroit Multifamily | Summer 2020      6
LISTICLE

                                                                                                    data by

Top 5 Markets for Transaction Growth

By Razvan Cimpean

The coronavirus outbreak has put a dent in real estate investment activity na-
tionwide. The total sales volume for multifamily transactions declined by al-
most a third in the first five months of 2020 compared to the same interval last
year, according to Yardi Matrix data. While transaction volume decreased in
most major multifamily markets across the nation, some smaller regions have
seen their dollar volume go up by double or triple digits, as investors sought
value-add opportunities in less expensive areas.

                                            Sales Volume Jan-May   Sales Volume Jan-May   Percentage
 Rank                 Market                      2019 (MM)              2020 (MM)         Change
 1             Detroit                                $16.6              $152.6            819.2%
 2             Wilmington                             $17.8              $110.5            520.8%
 3             White Plains                           $13.0              $61.6             373.8%
 4             Augusta                                $19.2              $82.8             330.8%
 5             Huntsville                             $27.5              $101.4            268.2%

DETROIT

For a multifamily market this size, Detroit witnessed
several underperforming quarters in terms of transactions
over the past two years. Year-to-date through May,
investors completed five transactions for a combined total
of $152.6 million. JRK Property Holdings’ acquisition of the
981-apartment Independence Green in the Farmington
Hills/West Bloomfield submarket was the largest
multifamily transaction of 2020 so far. The Los Angeles-
based firm paid $99.5 million to Hayman Co. for the
67-building asset.

                                                                      Detroit Multifamily | Summer 2020       7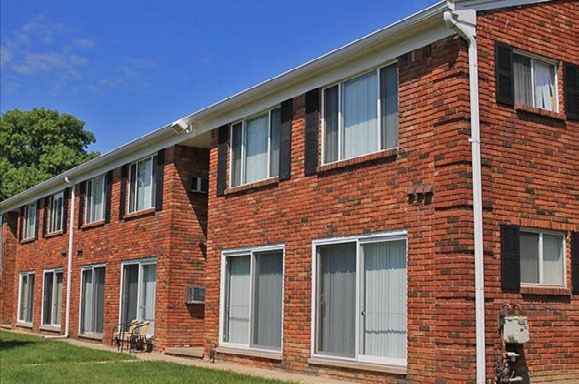
DETROIT SUBMARKETS

Area                             Area                                         Area
No.               Submarket      No.                Submarket                 No.                 Submarket
  1    Detroit–Downtown           16    Dearborn Heights/Inkster               31    Southfield
  2    Detroit–Midtown            17    Westland                               32    Bloomfield Hills/Birmingham
  3    Detroit–East               18    Belleville                             33    Farmington Hills/West Bloomfield
  4    Detroit–Northeast          29    Canton/Plymouth                        34    Novi
  5    Detroit–New Center         20    Livonia/Redford                        35    Wixom/Walled Lake
  6    Highland Park              21    St. Claire Shores/Grosse Pointe        36    South Lyon/Milford
  7    Detroit–North              22    Roseville                              37    Waterford
  8    Detroit–West               23    Harrison Township                      38    Pontiac
  9    Detroit–South              24    Clinton Township–East                  39    Auburn Hills
 10    Lincoln Park/Melvindale    25    Clinton Township–West                  40    Rochester Hills
 11    Dearborn                   26    Warren                                 41    Shelby Township
 12    Southgate/Riverview        27    Sterling Heights                       42    Chesterfield/New Baltimore
 13    Woodhaven/Brownstown       28    Madison Heights                        43    Washington/Richmond
 14    Taylor                     29    Royal Oak/Oak Park                     44    Clarkston/Orion
 15    Wayne/Romulus              30    Troy                                   45    Holly/White Lake

                                                                          Detroit Multifamily | Summer 2020             8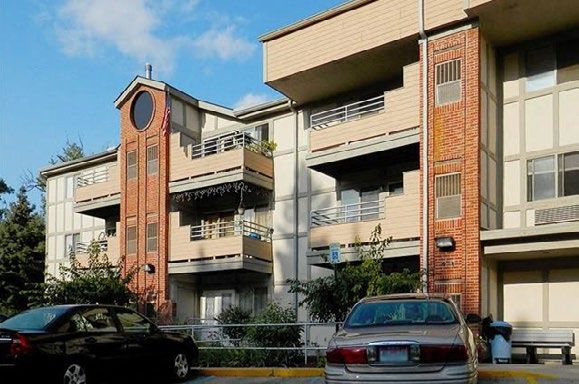
ECONOMIC SNAPSHOT
DEFINITIONS

Lifestyle households (renters by choice) have wealth sufficient to own but have chosen to rent.
Discretionary households, most typically a retired couple or single professional, have chosen the flexibility
associated with renting over the obligations of ownership.

Renter-by-Necessity households span a range. In descending order, household types can be:

➤ A young-professional, double-income-no-kids household with substantial income but without wealth
  needed to acquire a home or condominium;

➤ Students, who also June span a range of income capability, extending from affluent to barely getting by;

➤ Lower-middle-income (“gray-collar”) households, composed of office workers, policemen, firemen, techni-
  cal workers, teachers, etc.;

➤ Blue-collar households, which June barely meet rent demands each month and likely pay a disproportion-
  ate share of their income toward rent;

➤ Subsidized households, which pay a percentage of household income in rent, with the balance of rent
  paid through a governmental agency subsidy. Subsidized households, while typically low income, June
  extend to middle-income households in some high-cost markets, such as New York City;

➤ Military households, subject to frequency of relocation.

These differences can weigh heavily in determining a property’s ability to attract specific renter market
segments. The five-star resort serves a very different market than the down-and-outer motel. Apartments
are distinguished similarly, but distinctions are often not clearly definitive without investigation. The Yardi®
Matrix Context rating eliminates that requirement, designating property market positions as:

                       Market Position                           Improvements Ratings
                       Discretionary                                      A+ / A
                       High Mid-Range                                    A- / B+
                       Low Mid-Range                                      B / B-
                       Workforce                                     C+ / C / C- / D

The value in application of the Yardi® Matrix Context rating is that standardized data provides consistency;
information is more meaningful because there is less uncertainty. The user can move faster and more
efficiently, with more accurate end results.

The Yardi® Matrix Context rating is not intended as a final word concerning a property’s status—either
improvements or location. Rather, the result provides reasonable consistency for comparing one property
with another through reference to a consistently applied standard.

To learn more about Yardi® Matrix and subscribing, please visit www.yardimatrix.com or call Ron Brock,
Jr., at 480-663-1149 x2404.

                                                                        Detroit Multifamily | Summer 2020          9
Yardi Matrix                           ®

                                              Power your business with the industry’s leading source for originating,
                                     pre-underwriting and managing assets for profitable loans and investments.

                                                                                                                                          Yardi Matrix Multifamily provides
                                                                                                                                          accurate data on 18+ million units,
                                                                                                                                          covering over 90% of the U.S.
                                                                                                                                          population.

                                                                                                                                          Key features
                                                                                                                                          • Pierce the LLC every time with true ownership
                                                                                                                                            and contact info
                                                                                                                                          • Leverage patented improvement and location
                                                                                                                                            ratings, unit mix, rental, occupancy and
                                                                                                                                            current manager information
                                                                                                                                          • Gain complete new supply pipeline
                                                                                                                                            information at the asset, competitive set
                                                                                                                                            and market level
                                                                                                                                          • Find acquisition prospects based on in-place
                                                                                                                                            loans, maturity dates, lenders and originators
                                                                                                                                          • Access exclusive aggregated and anonymized
                                                                                                                                            residential revenue and expense comps

Get the latest market trends and forecasts at yardimatrix.com/publications

(800) 866-1144 | yardimatrix.com/multifamily
©2020 Yardi Systems, Inc. All Rights Reserved. Yardi, the Yardi logo, and all Yardi product names are trademarks of Yardi Systems, Inc.
DISCLAIMER
Although every effort is made to ensure the accuracy, timeliness and completeness of the information provided in this
publication, the information is provided “AS IS” and Yardi Matrix does not guarantee, warrant, represent or undertake that
the information provided is correct, accurate, current or complete. Yardi Matrix is not liable for any loss, claim, or demand
arising directly or indirectly from any use or reliance upon the information contained herein.
COPYRIGHT NOTICE
This document, publication and/or presentation (collectively, “document”) is protected by copyright, trademark and other
intellectual property laws. Use of this document is subject to the terms and conditions of Yardi Systems, Inc. dba Yardi
Matrix’s Terms of Use (http://www.yardimatrix.com/Terms) or other agreement including, but not limited to, restrictions
on its use, copying, disclosure, distribution and decompilation. No part of this document may be disclosed or reproduced
in any form by any means without the prior written authorization of Yardi Systems, Inc. This document may contain
proprietary information about software and service processes, algorithms, and data models which is confidential and
constitutes trade secrets. This document is intended for utilization solely in connection with Yardi Matrix publications and
for no other purpose.
Yardi®, Yardi Systems, Inc., the Yardi Logo, Yardi Matrix, and the names of Yardi products and services are trademarks or
registered trademarks of Yardi Systems, Inc. in the United States and may be protected as trademarks in other countries.
All other product, service, or company names mentioned in this document are claimed as trademarks and trade names by
their respective companies.
© 2020 Yardi Systems, Inc. All Rights Reserved.
Detroit Multifamily | Summer 2020 11You can also read