Development and Impact Monitoring of a Communication Strategy for the CGIAR Climate Security Program
←
→
Page content transcription
If your browser does not render page correctly, please read the page content below
Development and Impact
Monitoring of a
Communication Strategy
for the CGIAR Climate
Security Program
Working Paper No. 320

CGIAR Research Program on Climate Change,
Agriculture and Food Security (CCAFS)

CGIAR Focus Initiative on Climate Security

Isabel McLaughlin
Peter McKeown
Charles Spillane
Peter Läderach
Development and Impact Monitoring
of a Communication Strategy for the
CGIAR Climate Security Program

Working Paper No. 320

CGIAR Research Program on Climate Change, Agriculture and Food
Security (CCAFS)

Isabel McLaughlin
Peter McKeown
Charles Spillane
Peter Läderach*

* Author for correspondence

                                                             1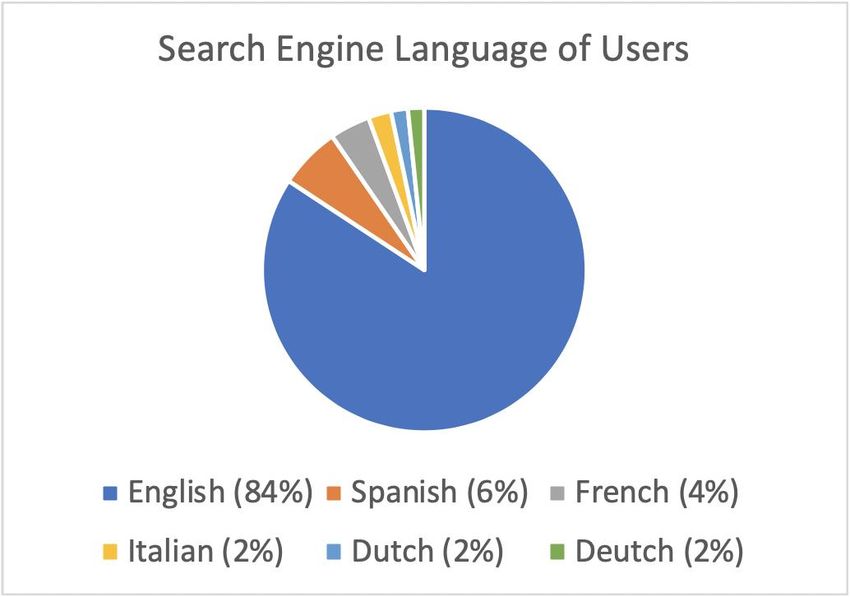
Correct citation:

McLaughlin I, McKeown PC, Spillane C, Laderach P 2020. Development and Impact Monitoring
of a Communication Strategy for the CGIAR Climate Security Program. CCAFS Working Paper
no. 320. Wageningen, the Netherlands: CGIAR Research Program on Climate Change,
Agriculture and Food Security (CCAFS). Available online at: www.ccafs.cgiar.org

Titles in this Working Paper series aim to disseminate interim climate change, agriculture and
food security research and practices and stimulate feedback from the scientific community.

The CGIAR Research Program on Climate Change, Agriculture and Food Security (CCAFS) is a
strategic partnership of CGIAR and Future Earth, led by the International Center for Tropical
Agriculture (CIAT). The Program is carried out with funding by CGIAR Fund Donors, Australia
(ACIAR), Ireland (Irish Aid), Netherlands (Ministry of Foreign Affairs), New Zealand Ministry of
Foreign Affairs & Trade; Switzerland (SDC); Thailand; The UK Government (UK Aid); USA
(USAID); The European Union (EU); and with technical support from The International Fund
for Agricultural Development (IFAD). For more information, please visit
https://ccafs.cgiar.org/donors.

Contact:
CCAFS Program Management Unit, Wageningen University & Research, Lumen building,
Droevendaalsesteeg 3a, 6708 PB Wageningen, the Netherlands. Email: ccafs@cgiar.org

Creative Commons License
This Working Paper is licensed under a Creative Commons Attribution – Non-commercial 4.0
International License.

© 2020 CGIAR Research Program on Climate Change, Agriculture and Food Security (CCAFS).
CCAFS Working Paper no. 320

DISCLAIMER:
This Working Paper has been prepared as an output for the Climate Security project under
the CCAFS program and has not been peer reviewed. Any opinions stated herein are those of
the author(s) and do not necessarily reflect the policies or opinions of CCAFS , donor agencies,
or partners.

All images remain the sole property of their source and may not be used for any purpose
without written permission of the source.

                                                                                              2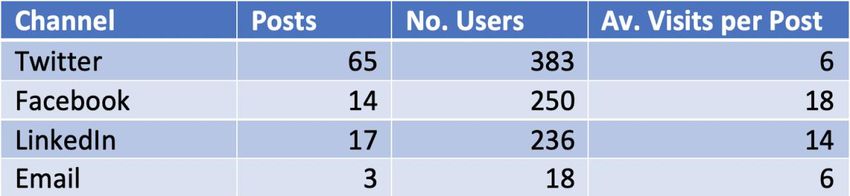
Abstract

In this study we investigate the different aspects of a communications strategy to determine
factors critical to success and to identify any adaptations and adjustments necessary for
improvement. It is vital that research endeavours have the appropriate tools to convey
messages of scientific significance to both policy makers, research implementers and the
public for the findings to be of value. This paper analyses the data from a communication
strategy formulated for CGIAR Climate Security, a new initiative by CGIAR to highlight the
extensive pathways by which outcomes of climate change can exacerbate conflict in
vulnerable regions. The communications strategy focuses on four main aspects – a Climate
Security website, Climate Security webinars streamed from Whova, YouTube and through the
UN Global Dispatch Podcast, blog posts and a social media campaign spread across three
platforms, Twitter, Facebook and LinkedIn. The strategy was developed and executed over a
two month period, where results from Twitter Analytics and Google Analytics were analysed
along with the engagement generated from all other platforms. Analysis of Twitter Analytics
was focused on aspects of tweets which drove URL clicks and visitors to the Climate Security
website. The most effective tweets for generating URL clicks were most commonly
accompanied by a video, posted later in the day (afternoon and evening) and later in the week
(Thursday to Sunday). The data from Google Analytics suggest that high levels of activity on
the Climate Security website produced levels of high engagement. When events such as the
Climate Security webinars were scheduled and promoted through social media a pattern of
high engagement was observed, compared to times of low activity and promotion. It can be
argued that the communications strategy was a success with the Climate Security website
generating 62,894 visits from 2,294 different users over the two-month period. Twitter posts
generated a total of 152,796 impressions on users. The Climate Security webinars had a
combined audience of 16,496 views across all streaming platforms. For sustainable
communications impact monitoring it would be necessary to conduct similar follow-on
studies in the future to analyse the impact of changes made to the communication strategy
developed for the CGIAR Climate Security initiative.

Keywords
Climate Security; communications strategy; engagement; URL clicks; webinars; Twitter;
Google Analytics.

                                                                                           3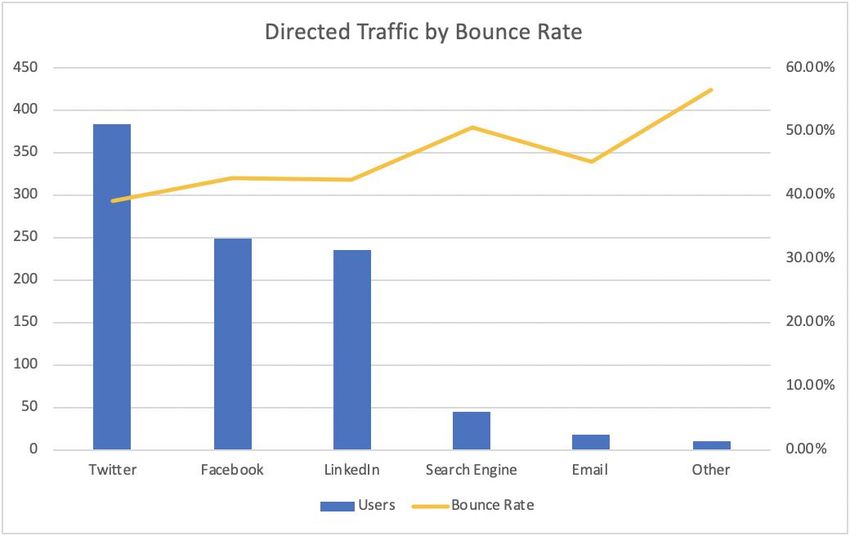
About the Authors

Isabel McLaughlin
MScCCAFS Program Student
Ryan Institute
National University of Ireland Galway
University Rd
H91 TK33
IRELAND
Email: isabelgmclaughlin@gmail.com

Dr. Peter Mc Keown
MScCCAFS Program Coordinator.
Ryan Institute
National University of Ireland Galway,
University Rd
H91 TK33
IRELAND
Email: peter.mckeown@nuigalway.ie

Prof. Charles Spillane
Director of Ryan Institute & Director of MScCCAFS Program,
Ryan Institute
National University of Ireland Galway,
University Rd
H91 TK33
IRELAND
Email: charles.spillane@nuigalway.ie

Dr. Peter Läderach
Lead CGIAR Climate Security
Flagship Leader Climate Smart Practices and Technologies
Rome
ITALY
Email: p.laderach@cgiar.org

Acknowledgements

The authors would like to acknowledge the guidance and assistance from the entire Climate
Security team for their on-going support throughout this research. We would also like to
thank the teams at CGIAR, CIAT and CCAFS for the use of their facilities which were
instrumental in carrying out this research.

                                                                                       4
Table of Contents
Introduction                                                                       8
  Background on Climate Security                                                   8
  The importance of communications in science.                                     9
Methodology                                                                       10
  Twitter Communications                                                          13
  Google Analytics                                                                15
Results                                                                           16
  The impact of impressions and engagement on URL clicks.                         16
  The influence of media type on engagement and URL clicks.                       17
  How the day of the week affects URL Clicks.                                     18
  How the time of posting impacts URL Clicks and engagement.                      19
  Daily active users of the Climate Security website.                             20
  Bounce rate of Climate Security website users.                                  21
  Site visits generated per promotional social media post.                        22
  Geo-data of website users.                                                      23
Discussion                                                                        24
  Impressions, engagements and media type are important for driving URL clicks.   24
  Influence of the day and time of posting on tweet engagement.                   24
  How activity and promotion affect website traffic.                              25
  Geo-data of users indicates a need for high standard linguistic translations.   25
Conclusion                                                                        26
References                                                                        27

                                                                                   5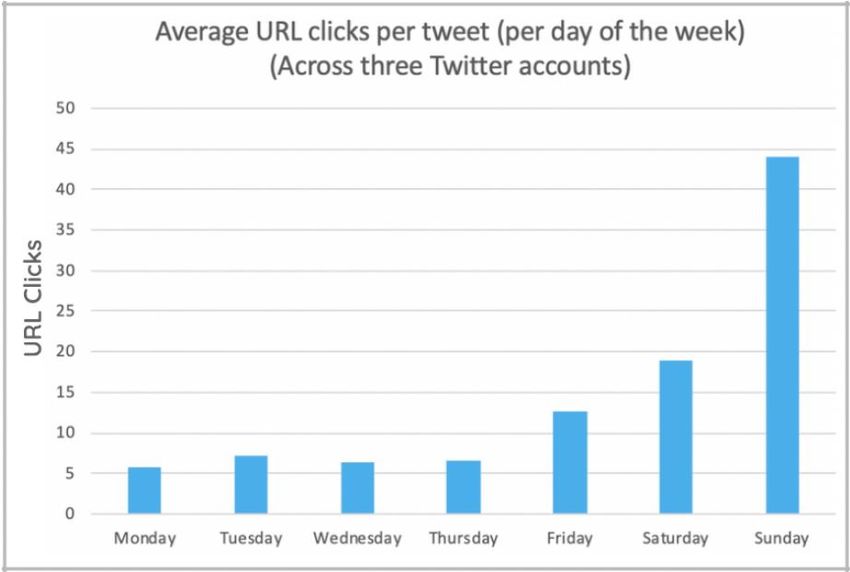
Introduction

The goal of this study is to investigate the success or lack thereof, of the communications
strategy established for CGIAR Climate Security. The overall goal of the communication
strategy was to generate an audience and to inform this audience of the necessity of Climate
Security to be included in the broader discussion around climate and security. We hoped to
achieve this by driving traffic to the Climate Security website.

This study is of significance to the scientific community, as now more than ever, it is vital that
scientists have the tools to communicate matters of importance to the general public. This
study aims to acknowledge the successes and shortfalls of a communications strategy in order
to determine if said strategy is effective. Researchers need to understand how to address the
oversights and flaws of communications in order to make improvements and ensure their
work can be appreciated by the desired audience.

The purpose of this research is to allow new programs such as the Climate Security initiative,
the opportunity to grow their influence and to reach the largest possible audience. To present
a guide of the information gap between our research and current communication methods.
We hope to present our findings in a concise way to highlight what underpins a successful
communications strategy and what should be avoided, providing an opportunity for
successful communications of similar scientific endeavours.

We hope to achieve the above by testing the success of the communications strategy for
Climate Security based on the analysis of the overall reach of the Climate Security initiative.
The main goal of our communication strategy was to drive users to the Climate Security
website through two main channels. The first was the production of three Climate Security
Webinars which would be hosted on the site. The second was the promotion of the site
though social media channels Twitter, LinkedIn and Facebook. To test the effectiveness of the
communications strategy we implemented it over a two month period and gathered
statistical data throughout. To decipher if the strategy was successful in terms of driving traffic
to the Climate Security website we analysed data gathered from Google Analytics, Twitter
Analytics and the overall reach of the Webinars.

Background on Climate Security

It is well documented that climate change will accentuate stresses in many of the world’s
vulnerable systems such as agriculture, energy systems, water resources, human health, the
economy and undermine the general living conditions in which we currently exist (Scheffran
and Battaglini, 2010). It is thought that security risks and violent conflict may well be a stress
factor arising due to the overbearing pressure on the systems we currently depend on to
sustain human life (IPCC, 2007). According to a study conducted by the CNA Corporation,
climate change has the ability to lead to increased border tensions around the world,
influence large-scale migrations, induce conflict over water and food shortages and the

                                                                                                 6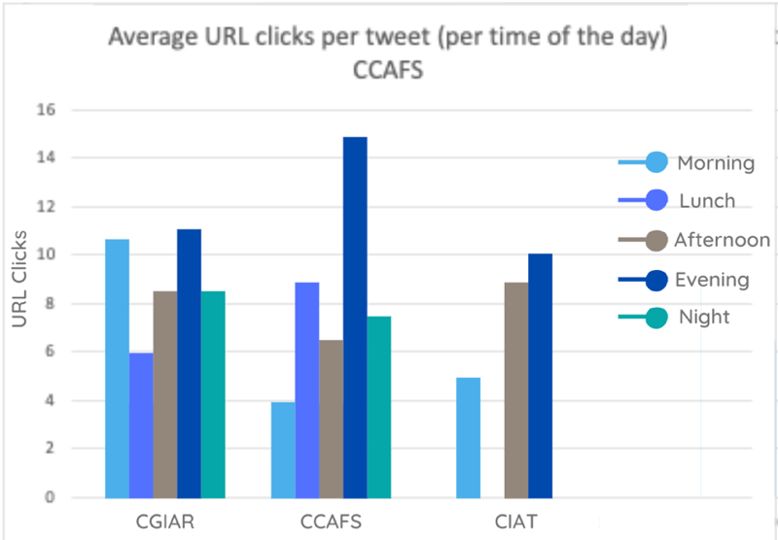
acceleration and mass spread of disease, all of which have the capability to catalyse instability
and conflict in even the most stable regions of the world (CNA Corporation 2007).

The links between climate change and security have found their way into international
contemporary politics, with climate change being defined as an impending security threat
(McDonald, 2013). The security threats posed by climate change have been identified and
explored by many of the world’s leading organizations such as the United Nations Security
Council (UNSC), the UN General Assembly (UNGA, 2009), the UN Environment Programme
(UNEP, 2007) the UN Development Program (UNDP, 2007) and the UN Secretary General
(Moon, 2007). Along with these extensive reports, there has been a substantial increase of
peer-reviewed literature on the complications climate changes poses to global security.

CGIAR Climate Security aims to address the impending security threats of climate change by
showcasing the intricate feedback loops across political and socio-economic systems and the
ways in which conflict dynamics can be influenced by climate-related factors in multiple ways.
CGIAR Climate Security aims to highlight the interconnected drivers and pathways between
climate and security by combining research on natural resource management, agricultural
productivity, livelihoods and food security, climate science, youth and gender, value chains
and markets to underpin the complex nexus of climate and security. CGIAR’s work aims to
integrate discourse of security into climate science through research, the development of
open source data platforms, the elevation of partnerships to stimulate the exchange of vital
resources and information, and the design of programs and interventions for peace building
(Climate Security, 2020).

The importance of research communications

The ability to translate science and research into effective and actionable policy making, is
paramount if we are to face future challenges posed by a changing climate. The struggle
between researchers and scientists to communicate findings in ways that resonate with
decision makers and the public has been well documented (Cvitanovic and Hobday, 2018). To
make progress, both scientists and policy makers must pool their efforts and allow for ever
evolving scientific knowledge to transpire into palpable constructive outcomes. For this to be
possible, scientists must possess the ability to project tangible possible impacts that may arise
from their research. Despite efforts from both parties thus far, there is still a disparity
between scientific endeavours and policy making (Cvitanovic and Hobday, 2018).

Aside from communicating with policymakers it is essential that scientists and researchers
alike learn to effectively communicate with the media. In a democracy public support is crucial
for the success and implementation of sufficient and effective policies (Stoknes, 2014). To
secure this support, the public must have access to coherent and convenient information
(Junsheng et al., 2019). As the media is the most powerful communications tool at our
disposal it is reasonable to state that mass media has the ability to shape understanding and
drive awareness of issues surrounding climate change (Neelima and Reddy, 2014).

                                                                                               7
Methodology
Communications Strategy
Mission Statement
“The CGIAR Climate Security Research Area aims to conduct research on natural resource
management, agriculture and food systems to build resilience in climate-sensitive regions that
are prone to or emerging out of conflict. We aim to provide actionable scientific
recommendations to organizations in order to design more holistic peacebuilding operations.”
Background and Rationale
CGIAR is a global agricultural innovation network which includes 15 research centres, eight
programs on agri-food systems and four cross-cutting integrating programs across the globe.
CGIAR centres and programs contribute to global challenges around food systems and focuses
on climate change, natural resources and rural-urban linkages, directly addressing climate
change and conflict in the context of the humanitarian, development and peace nexus. CGIAR
brings together agricultural, climate, environmental and social sciences to identify and
address the most important interactions, synergies and trade-offs between climate change
and agriculture. The work of CGIAR makes agri-food systems environmentally and socially
sustainable by addressing the regeneration of degraded landscapes, land and water solutions,
migration, rural-urban linkages and gender, youth and inclusivity.
Conflicts are often driven by multidimensional interactions between environmental,
economic, social and institutional factors. Climate change is increasingly recognised to
exacerbate the risk of conflict development, via cascading and interacting effects across
socioeconomic and political systems. Climate-related factors impact conflict dynamics in
multiple ways, hence the concept of climate security i.e. climate change-induced security risks
for human and natural systems, needs to be considered in conflict management and strategic
policymaking processes. Until recently, issues around conflict and fragility have been
addressed from a symptomatic rather than holistic perspective. The need to integrate climate
change and food systems thinking into conflict management is only now being acknowledged
by academia, development and governmental agencies. Understanding and systematically
analysing the root causes and the role climate security plays for conflict and peace is key to
plan and implement interventions addressing and preventing conflict.
Research Agenda
The long-term goals of CGIAR Climate Security are:
1. To understand the contribution of CGIAR to the prospects to peace.
2. To develop a database and tools for information sharing between researchers and
partners alike, while aligning incentives for a common goal.
3. To highlight the impact pathways between climate change and conflict through
scientific research and data analysis.
84. To showcase the impact and contribution of CGIAR to the mitigation of these impact
pathways.
5. To understand and communicate the intricacies of natural resource management,
agriculture and food systems in relation to climate and conflict.
6. Use scientific understandings and relationships with organizations to help build
resilience in areas vulnerable to climate induced conflict.
Each material of communication should be consistent with our mission, goals and message.
Our communications should encompass the values of CGIAR while promoting information
sharing around Climate Security for the common good. Our communications will focus on four
main aspects: A Climate Security website, a series of Climate Security webinars, blogs posts
and social media.
Objectives for website: Launch Date: 30/04/2020
The CGIAR Climate Security website will operate as the epicentre of the Climate Security
research area and serve as the face of our brand. The website is critical to the communications
and branding of Climate security and will act as a springboard to share knowledge, generate
support and raise awareness of our cause. The site should welcome visitors with clear and
concise usability while presenting vital information and data for scholars and researchers
alike. It will present and aim to educate our audience on our mission statement, provide a
space for knowledge sharing and host events and blogs orchestrated by Climate Security and
its partners. The website will be designed with the following guidelines in mind:
Landing Page – The home page of the CGIAR Climate Security website will give users a
background on the objectives and goals of CGIAR Climate Security. It should educate users of
the need for intellectual discourse concerning climate, security and the intense and complex
pathways which connect them. The page should showcase issues which CGIAR hopes to
address and how we plan to address them – through research and education, knowledge
sharing, the development of information databases, strengthening of partnerships and
institutional reform towards processes for peace by aligning common objectives and
incentives.
Contributions to Peace – Here users will encounter the extensive portfolio analysis of
research papers which identify drivers of conflict both directly and indirectly through a
searchable database on CGIAR’s contribution to peace. An interactive visualization of driver
interactions will be showcased to give users an opportunity to explore the complex
interactions and feedback loops which drive climate induced conflict. Users will have the
freedom to search different drivers of conflict with results showing visitors the consequences
of said driver in regions of the world. The page will also serve as a platform to an extensive
information database of all reviewed literature which contributed to the findings and
implementation of the interactive Climate Security explorer.
News and Events – The news and events section of the website should be used to update
users on the progress and initiatives being undertaken by CGIAR and partners in the process
for peace. News will be published intermittently in the form of blogs which are discussed
9below in more detail. All events orchestrated by CGIAR Climate Security will be announced
via this page. Initially, users will find details of the six webinars from the Climate Security
Webinar Series.
Objectives for webinars: Launch Date: 04/06/2020
The Climate Security Webinar series will aim to provide an immersive knowledge sharing
experience for guests. We hope to broadcast the webinars to an expansive audience while
conveying the key messages of Climate Security though hosted panel discussions between
subject experts. They will incorporate topics which focus on issues related to and affected by
climate security with an emphasis on the impact pathways between climate change and
conflict. The webinars will help to solidify the importance of climate security and the role of
CGIAR within it, through the reinforcement of knowledge and data sharing through expert
discussions.
Webinar 1: The role of climate and food systems science in conflict prevention and
peacebuilding.
Webinar 2: The importance of data and disruptive technologies for climate security.
Webinar 3: Sustainable finance for peace.
Webinar 4: Climate security in the Sahel.
Webinar 5: Climate security in post-conflict Colombia.
Webinar 6: A partnership agenda for Climate Security.
All webinars will be hosted on Whova and streamed live on YouTube. Whova is an event
management application used to organize events with a modern interface. Whova can be
used to market the event while managing logistics for the event organizer. It specializes in
user engagement and attendee networking by encouraging users to interact via polls,
questionnaires and chat rooms (What Is Whova? | Whova FAQ, 2020).
The webinars will be hosted by Mark Goldberg. Mark is the creator and broadcaster of the
UN Global Dispatch podcast which has approximately 5,000 active weekly listeners. The
webinar will be produced and distributed as podcasts by Mark and the UN Global Dispatch.
Objectives for blogs: Launch Date: 15/08/2020
Individual blogs will focus on specific case studies which are relevant to the field of Climate
Security. Focused on regions and situations that may benefit from climate security initiatives
and projects established by CGIAR and partner organisations to reduce conflict vulnerability.
Although each blog post will focus on its own topic, the core message should be consistent
and focus on highlighting the impact pathways between climate and conflict while underlining
the impact and contribution of CGIAR and its partners to the mitigation of said pathways.
Partner Organizations: These blog posts should incorporate updates on specific initiatives
which focus on our work with partnering organizations and the parallel between our missions.
Highlighting projects which aspire to achieve security in vulnerable areas through the
adaptation of systems and processes. Projects and organizations with common end goals to
10the Climate Security research area are suitable here. This will help to strengthen partner
relations and build relationships.
Country Profiles – The second subset of blog posts will focus on independent country profiles.
Each country should be given background information focusing on specific vulnerabilities
relating to climate and conflict in that region. An in-depth investigation of the different impact
pathways specific to that country, and finally, the ways in which the work of CGIAR and
partners is addressing these impact pathways, including the benefits, programs and projects
in the area.
Social media channels:
As a new facet of CGIAR, Climate Security will not create its own social media channels. It will
instead make use of the social media channels already in operation by CGIAR and its research
programs. We have been granted access to the accounts of CGIAR, CCAFS and CIAT for
Twitter, LinkedIn and Facebook. These accounts have a combined total following of 413,300.
The decision not to create our own social media channels stems from research that shows
social media accounts take an extensive amount of time and resources to establish and build
a loyal following. It is paramount to avoid creating a social media ‘ghost town’ which can
actually have a negative impact on your brand or organization (Sweeney and Craig, 2011).
We will develop a series of social media toolkits for Twitter, LinkedIn and Facebook. These
toolkits will comprise a series of posts for each social media site, accompanying media
(video/image) for each post and a suggested date of posting. These will be sent to our
partners at CGIAR, CCAFS and CIAT for redistribution through their highly established social
media channels.
Twitter Communications
Twitter, a microblogging social media site, launched in 2006, has 330 million active monthly
users as of July 2020. Designed to allow users to follow one another and post short status
updates of a maximum of 220 characters. Twitter has an ever updating timeline with content
ranging from politics, breaking news, science, technology, business and more (Marwick and
Boyd, 2010). Twitter is increasingly being used within the scientific community to share
scientific journals, increase readership, knowledge and to “create a platform for dynamic
scientific discussion” (Wadhwa et al., 2017).
The success of a Tweet can be measured by the amount of impressions and engagements it
gets. Impressions refer to how many times the Tweet has been seen. This includes not only
the times it appears on a followers timeline but also as a result of a retweet, like or is shown
through the search function. Engagements are the total number of interactions a tweet
accumulates. This accounts for clicks anywhere on the tweet including retweets (a re-share
from a third party account), likes, replies, follows, link clicks, hashtag clicks, media interaction
or detail expansion (Wadhwa et al., 2017).
The analysis for this study is based on three datasets. Each dataset is a subset of tweets posted
by a Twitter account belonging to CGIAR, CCAFS and CIAT. The CGIAR Twitter account has
11110.6 thousand followers - 28 tweets were posted from this account. The CCAFS Twitter
account has 64.5 thousand followers, 21 tweets were posted by this account. Finally, the CIAT
Twitter account has 45.5 thousand followers with 15 tweets being published from this
account during the course of this study. As the ultimate aim of the campaign was to drive
users to the Climate Security Website, the analysis in this paper is focused on what drives URL
clicks.
Each tweet is made up of different characteristics such as the text of the tweet, hashtags,
accompanying media and user profile tags. These along with the time of day and day of the
week the tweet was posted can be analysed to determine what makes up a successful tweet.
The objective of the Climate Security Twitter campaign was to ultimately drive users to the
Climate Security website. For this study we analysed the type of media used, time of posting
and day of the week. Using these variables we determined which characteristics of a tweet
were likely to drive impressions, engagements and URL clicks.
To understand which type of media is the most effective at generating engagements and URL
clicks for the three twitter accounts we calculated the average number of engagements and
the average number of URL clicks per tweet for each media type across the three Twitter
accounts. There were two types of media used in the twitter campaign: images and videos.
We can compare the effectiveness of each media type by comparing average engagements
and average URL clicks for the set of tweets which were accompanied by video media and
those accompanied by an image.
In this study tweets were posted on every day of the week, with slightly more tweets being
posted at the beginning of the week than the end. To calculate which day of the week is the
most effective for posting tweets that garner engagement and URL clicks, we first found the
average of both variables for each day of the week across the three twitter accounts. Once
we had the average engagement and URL clicks for each day of the week for the separate
Twitter accounts we combined these averages to determine the best average day/days of the
week for posting in general for the three accounts.
For the purpose of this study, the time of day was broken down into Morning, Lunch,
Afternoon, Evening and Night. Tweets were posted throughout the day at different times
across all twitter accounts. The CGIAR, CCAFS and CIAT Twitter accounts are based out of
Europe, so the Central European Standard time zone was used to sort the tweets into the five
categories mentioned above. To calculate the most effective time of day to post tweets in
terms of engagement and URL clicks we grouped the tweets into clusters. Morning tweets
were tweets posted between 06:00am & 11:59am. Lunch time tweets were sent out at
12.00pm through 12:59pm. Afternoon tweets accounted for all tweets posted from 13:00pm
until 17:59pm. Tweets in the evening category were posted from 18:00pm to 21:59pm and
finally tweets in the night category were posted between 22:00pm and 05:59am. We then
calculated the average engagement and URL clicks for the tweets according to the time of
day. We did this across the three Twitter accounts independently followed by an overall
average across the three twitter accounts.
12Google Analytics
The second section of our data analysis was sourced from Google Analytics. Google Analytics
is a tracking application which can be used in conjunction with a website by inserting a piece
of HTML coding into each page of a website. This code records data which can provide
invaluable insight into how users are interacting with a website. The detailed statistics
generated by Google Analytics can compare how users transact with different aspects of the
site such as, page visits, interactions and clicks, thus giving invaluable understanding into
aspects of the site that are popular among users and aspects that may need to be improved
(Plaza, 2011).
The results below aim to show actions which may have a positive impact on acceleration in
traffic to the Climate Security webpage. Further than this we can investigate how deep users
navigate into the site, if their traffic source has an impact on their interaction with the site,
and if so, which traffic source is the most effective? We also get a glimpse of the geographical
data of users. This data can provide awareness about the possible need for modifications to
the site depending on popular user countries and language barriers. Comparing the behaviour
of users on different features of the site can provide enlightenment on how to improve the
design and content of the site in line with user’s needs (Plaza, 2011).
The Climate Security Webpage was launched on 29/04/2020, using the data from Google
Analytics we were first able to visualize the daily active users of the website from its launch
date until 24/06/2020. This gave us an opportunity to compare times the site was busy with
the timings of social media campaigns and events to understand how promotion, or lack
thereof effected daily users of the website.
The data gathered from Google Analytics can also give an insight into the effectiveness of
third party referral sites that are generating traffic to your website. In the case of this study a
referral site makes reference to any page visit which is not an organic search for the website
through a search engine. In other words if a user lands on the Climate Security website
through following a link from a third party site, this site is classified as a referral site. This
information is useful for understanding the means in which users are navigating to the site
and which types of promotion are most effective. In this instance the website was navigated
to though Twitter, Facebook, LinkedIn, search engine, email and a small percentage of various
sites which are classed as ‘other’.
It is also possible to analyse the ‘bounce rate’ of each visit. The bounce rate of a website refers
to the total number of single page sessions divided by the total number of page visits whereby
the user views only a single page on the website and does not explore further (Bounce rate -
Analytics Help, 2020). A high bounce rate can indicate low engagement with the site and a
‘poor experience following the click’ (Sculley, et al. 2009). Google Analytics gives us the
opportunity to see the bounce rate of users in relation to the means in which they navigated
to the site. This can indicate which navigation route is most likely to traffic users who are
engaged with the content of the site.
13Using the data gathered by Google Analytics we can see the language that a user’s computer
is searching in. This gives us an insight into popular first languages among our users. In
conjunction with the data on language, the geographical data from Google Analytics can be
used to determine where users are coming from around the world. By analysing the search
language data against the geographical data of users we can determine if the site would
benefit from high quality translation to improve the usability for users whose native tongue
is not English.
Results
The impact of impressions and engagement on URL clicks.
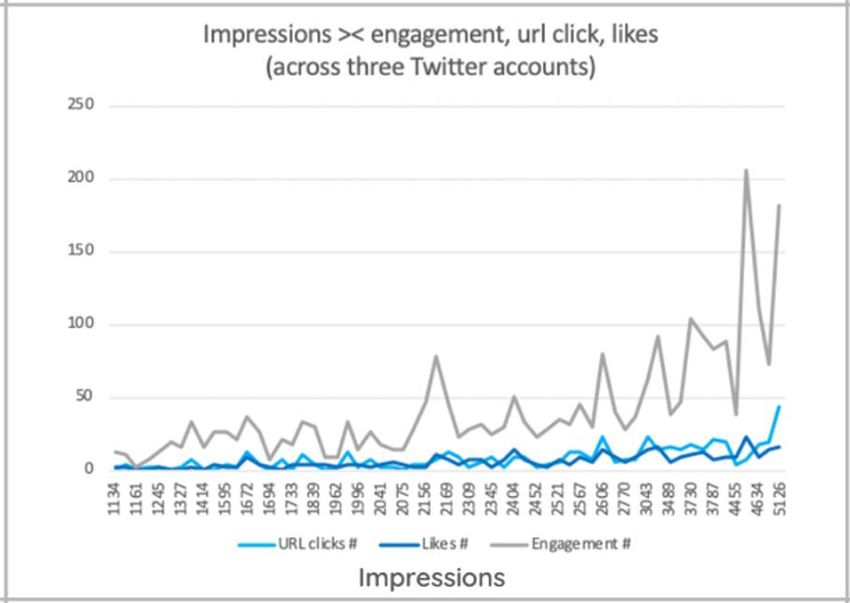
Fig.1, shows that there is a positive correlation between high tweet impressions and
engagement across the three Twitter accounts. Retweets and likes are two other factors
which positively drive URL clicks. The higher the number of retweets and likes, the higher the
average number of URL clicks per tweet. More precisely: (1) High impressions are positively
correlated with high engagement, and (2) High impressions are slightly correlated with likes
and URL clicks.
Fig 1. Impact of impressions on URL clicks, likes and replies.
High engagement is also associated with a higher number of URL clicks per tweet. As can be
seen on the graph Fig 2, there is a positive correlation between high engagement and high
URL clicks per tweet across the three Twitter accounts.
14Fig 2. No. of engagements to URL clicks.
The influence of media type on engagement and URL clicks.
The relationship between the type of media and the engagement/URL clicks was different
across the three Twitter accounts. More precisely as we see in fig 3. for both CCAFS and CIAT,
tweets with videos had a slightly higher average number of URL clicks and engagement. For
CGIAR tweets with images drove average engagement per tweet, but did not have a
significant impact on the average URL clicks.
15Fig 3. Comparison of media type on engagements and URL clicks.
How the day of the week affects URL clicks
For CGIAR the tweets that were posted at the end of the week had higher average URL clicks.
Tweets posted on Thursdays had on average 7 URL clicks, while tweets posted on Fridays,
Saturdays, and Sundays had on average 12, 19, and 44 URL clicks respectively. For CCAFS
tweets posted at the end of the week had on average more URL clicks (except for Tuesdays,
which may be linked to one specific tweet driving average URL clicks). Tweets posted on
Mondays had on average 2 URL clicks per tweet, while tweets posted on Fridays had on
average 9.5 URL clicks per tweet. Tweets posted by CIAT on Fridays had significantly higher
average URL clicks. Tweets posted on Mondays had an average of 0.5 URL clicks, while tweets
posted on Fridays had on average 17.5 URL clicks.
16Fig 4. URL clicks by day of the week.
How the time of posting impacts URL Clicks and engagement
The impact of the time of the day is less clear and is different for the three Twitter accounts.
The tweets sent from CGIAR posted in the morning and in the evening have higher URL clicks
per tweet on average. Tweets posted during lunch time were not efficient in terms of
engagement or URL clicks. Here, morning and evening tweets did the best in terms of URL
clicks. However, it is important to note that afternoon and night tweets were also efficient.
For CCAFS lunch, evening and night tweets were very efficient in terms of URL clicks and
engagement. On average afternoon and morning tweets did not perform well in terms of
overall engagement. Here again, it seems that the later the tweet was posted, the better it
did. Tweets posted in the morning have the lowest average URL clicks per post (only 4 URL
clicks per tweet). Lunchtime and evening are the two best times to post tweets that will drive
URL clicks.
Posts from the CIAT account performed better in the afternoon than morning tweets with an
average of 9 URL clicks and 5 URL clicks per post respectively. There was only one tweet sent
out in the evening which performed very well suggesting that tweets should be posted later
in the day (mid-afternoon - evening). The data for time from the CIAT account is a bit
disaggregated as there was not enough variation in the available data to display accurate
results.
17Fig. 5 Av. URL clicks per time of day across three twitter accounts.
Daily active users of the Climate Security website
Using the data from Google Analytics fig 6. shows us that the Climate Security Webpage had
a slow start due to limited promotion which began to pick up May 22 – the day the promotion
for Webinar 1 ‘The role of Climate and Food Systems Science in Conflict Prevention and Peace
Building’ was launched. This climb continues until 04/06/2020 where it reaches a peak of 1064
active daily users. This is the day Webinar 1 was launched on the website. From 05/05/2020
the site experiences a slight lull before promotion for webinar 2 ‘The importance of data and
disruptive technologies for climate security’ began.
We again see a steady rise up to 18/06/2020 where daily active users reach its peak at 1,551.
Following the same pattern on 19/06/2020 post webinar the active daily users begins to fall
– right up until 02/07/2020, the day of webinar 3 ‘Sustainable Finance for Peace’ where it
experiences a slight daily increase to 1,156. Post Webinar 3 we see a steady decline in daily
active users where at the time of writing was 597.
18Fig 6. Active daily users over a three month period.
Bounce rate of Climate Security website users
The site was visited by a total of 2,294 users between 29/04/2020 and 24/07/2020. Of those
visits 1,350 users navigated to the site through a bookmark or direct URL search. There were
944 remaining visits from various sources (email promotion, independent sites etc.).
Bookmarked URLs or a direct search through a search engine showed a lower bounce rate
than other sources.
The remaining 944 visits can be analysed against the number of prompts generated from each
communications channel used to promote the website to estimate the effectiveness of each
channel against bounce rate. We can see from fig 7. users who navigated to the site through
Twitter had the lowest bounce rate meaning traffic navigating from Twitter is less likely to
leave the site after just one page. Users navigating from ‘other’ means such as independent
sites had the highest bounce rate.
Table 1. Total Page Visits by Total Bounce Rate. Source of site visits and respective bounce
rate.
19Fig 7. Directed traffic to site vs. bounce rate for each perspective site.
Site visits generated per promotional social media post
As seen in the table below (table 2.), although Twitter generated the most overall site visits it
only generated approximately 6 visits per post averaging out the same as visits from email
promotion. We can see Facebook has the highest visits per post at 18. LinkedIn shows it is
also an effective tool for producing website traffic averaging out at 14 site visits per post.
Table 2. Average site visits per promotional posts for page visits with navigation data available
.
20Geo-data of website users
Shown below in fig 8. we see that English, at 84%, was the primary language used to search
the site followed by Spanish at 6% and French at 4%. Other search languages used were
Italian, Dutch and Deutsch all at 2%.
Fig 8. Search engine default language of website users.
The website had quite a large reach with visitors from 127 different countries. India leads with
12.48% of total users, followed by the U.S with 9.82%. The third, fourth and fifth countries
with highest visitor rates were The Netherlands (Deutsch), Italy (Italian) and Spain (Spanish)
respectively. This correlates with the popular search engine languages except for in India
where it may be assumed users searched primarily in English.
21Table 3. User count by country.
Discussion
Impressions, engagements and media type are important for driving URL clicks
The analysis of the three Twitter data sets show that it is important to focus on tweet
engagement and tweet impressions, as these two factors are positively correlated with URL
clicks. High impressions are associated with higher engagement and URL clicks. The high
correlation between engagement and URL clicks per tweet suggests that if a tweet has high
engagement, it will also have a greater number of URL clicks. Replies and media views are not
correlated with URL clicks. This means that a higher number of replies will not be associated
with higher average URL clicks per tweet. In terms of accompanying media CGIAR performed
better when accompanied with an image on engagement but not significantly on URL clicks,
in contrast to this, both CCAFS and CIAT performed better with a video accompaniment on
both counts. This suggests that videos are more effective at driving URL clicks but the
difference is not overwhelmingly significant meaning a combination of both images and
videos are suitable with a slight emphasis on video where possible.
Influence of the day and time of posting on tweet engagement
In this study the day of the week had a significant impact on how users reacted to the tweets.
Tweets that were posted at the end of the week (Friday-Saturday-Sunday) had higher
engagement/URL clicks and likes. A reason for this may be linked to the fact that people are
less focused on their work at the end of the week and have more time to interact with tweets.
Tuesday, Wednesday and Thursday being the most productive days of the work week in terms
of work productivity (Bryson and Forth, 2007) leaving people more focused on work and less
likely to interact with posts. Across the three twitter accounts, Monday is the day of the week
22with the lowest level of engagement per tweet. However, it is important to note that only a
small subset of tweets were posted at the end of the week. It would be necessary to test this
hypothesis by posting more tweets at the end of the week and review findings a month later.
Once we began analysing the impact of the time of the day on tweets it became clear there
was a significant limitation in the study. As CGIAR, CCAFS and CIAT are all international
organizations the time of day for their followers vary significantly by time zone, meaning
people may be viewing the tweets internationally at all times of the day. This may influence
the data gathered from the variable of time. Overall the time of the day seems to be less
important to determine whether a tweet will be efficient. For CCAFS and CIAT it seems
beneficial to post in the afternoon/evening. For CGIAR it is better to avoid lunch time, but any
other time of the day can be efficient. It would be interesting to test this hypothesis in future
studies with an equal number of tweets posted throughout the day to gain further insight into
how the time a tweet is posted can affect URL clicks and engagement.
From the above findings we can see that it is important to focus on high impressions and high
engagement, as both are associated with higher levels of URL clicks per tweet, they have a
correlation of 70% and 72% respectively. Retweets also have a high correlation with URL clicks
at 71%, likes, media engagements and detail expands also all show moderate correlation to
URL clicks while media views and replies show no positive correlation to URL clicks.
How activity and promotion affect website traffic
The data gathered from Google Analytics suggests a few practices that may help to increase
the traffic and usability of the Climate Security website. We see a positive correlation between
the amount of activity, interaction and active daily users to the site. This suggests that in order
to generate more traffic, Climate Security should aim to increase content such as posting
regular news updates and blogs along with hosting more events such as the Climate Security
Webinars. These should all be promoted using social media and other methods with the
overall goal of redirecting both interested parties and a new audience to the webpage.
We also see that Facebook and LinkedIn could be more useful in terms of generating website
traffic as they had the highest visits per post at 18 and 14 respectively. This research project
focused strongly on Twitter as a medium for promotion which may have posed a limitation to
the study. One reason for the large differentiation in visits per post between platforms could
be that Twitter posts were reaching the same users repeatedly, driving the click rate down
per post. This is something to consider for future studies where it would be beneficial to focus
on all three sites equally to see how the click rate alternates. Although the click rate is
significantly higher for Facebook/LinkedIn we see that the bounce rate for users redirected
through Twitter is slightly lower than the aforementioned, indicating that Twitter posts are
more targeted toward invested parties.
Geo-data of users indicates a need for high standard linguistic translations
Finally the geographical data shows us there may be a need for high quality translations as
the search engine language strongly correlates with the geographical location of users. Taking
the Netherlands for example as the third highest country for visitors it may benefit Climate
23Security to increase the usability for this demographic through linguistic
convenience. Linguistic preferences should be considered for sites that address different
populations as language can be an important factor for a webpage as it can become a barrier
for many and provide an unfriendly user experience. Studies have shown that the original
scripted language of a website can have an adverse effect on users with a different native
tongue, making them less likely to be satisfied with the overall usability (Nantel and Glaser,
2008) which can lead to a high bounce rate and unreturning visitors both of which are
undesirable when trying to grow the following of a website (Kralisch and Koeppen, 2005).
Conclusions
The need for sound scientific communication methods is crucial for scientists and researchers
to effectively communicate results and findings in a concise and relatable way to policy
makes, decision makers and the public in order for their efforts to make an impact on
progressive action. The research community must understand the importance of effective
communications in order to translate findings into tangible, positive outcomes. The
importance of media cannot be downplayed in its effectiveness to bridge the knowledge gap
between the scientific world and public opinion.
This paper reviewed the capabilities of different social media channels and a website in their
contribution toward a successful communications strategy. The research conducted in this
paper set out to identify both the successes and failures of a scientific communications
strategy. By developing and executing a communications strategy for CGIAR Climate Security
we were able to analyse data from different sources such as Google Analytics, Twitter
Analytics, Facebook and LinkedIn posts, YouTube and the Whova app where the Climate
Security webinars were streamed. The CGIAR Climate Security initiative was also promoted
through the UN Global Dispatch Podcast where the three webinars were broadcast.
It can be argued that the communications strategy in this instance was a success and
effectively broadcast the CGIAR Climate Security initiative to an entirely new and expansive
audience. Within a two month period the Climate Security Website had a grand total of
62,894 visits from 2,294 different users. These visits were largely directed through our social
media campaigns across Twitter, Facebook and LinkedIn. The Climate Security webinars
played an important role in communicating the message of climate and its links to security
with a combined audience of 16,496 views across all streaming platforms for the webinars.
The data gathered throughout this study provides an important insight for future scientific
communications initiatives in terms of effective methods for the production and distribution
of communication materials.
24References
Bryson, A and Forth, J (2007) Productivity and days of the week. Discussion Paper. Royal
Society for the encouragement of Arts, Manufactures & Commerce. pp 2-11
Climate Security, C., 2020. Climate Security CGIAR. [online] Climatesecurity.cgiar.org.
Available at: [Accessed 4 August 2020].
CNA Corporation (2007) National security and the threat of climate change. The CNA
Corporation, Alexandria pp 35 -59
Cvitanovic, C. and Hobday, A., 2018. Building optimism at the environmental science-policy-
practice interface through the study of bright spots. Nature Communications, 9(1).
IPCC, 2007: Climate Change 2007: Impacts, Adaptation and Vulnerability. Contribution of
Working Group II to the Fourth Assessment Report of the Intergovernmental Panel on Climate
Change, M.L. Parry, O.F.Canziani, J.P. Palutikof, P.J. van der Linden and C.E. Hanson, Eds.,
Cambridge University Press, Cambridge
Junsheng, H., Akhtar, R., Masud, M., Rana, M. and Banna, H., 2019. The role of mass media in
communicating climate science: An empirical evidence. Journal of Cleaner Production, 238,
p.117934.
Kralisch, A and Koeppen, V, (2005) "The Impact of Language on Website Use and User
Satisfaction: Project Description". ECIS 2005 Proceedings. 96. pp. 1-9
Marwick, A. and Boyd, D., 2010. I tweet honestly, I tweet passionately: Twitter users, context
collapse, and the imagined audience. New Media & Society, 13(1), pp.114-133.
McDonald, M., 2013. Discourses of climate security. Political Geography, 33, pp.42-51.
Moon, B. (2007). A climate culprit in Darfur. Washington Post, 16th June.
Nantel, J. and Glaser, E., 2008. The impact of language and culture on perceived website
usability. Journal of Engineering and Technology Management, 25(1-2), pp.112-122.
Neelima, B.N, & Reddy, R. Uttama (2014). Mass Media and Climate Change. International
Journal of Research (IJR). Volume-1, Issue-2.
Plaza, B., 2011. Google Analytics for measuring website performance. Tourism Management,
32(3), pp.477-481.
Scheffran, J. and Battaglini, A., 2010. Climate and conflicts: the security risks of global
warming. Regional Environmental Change, 11(S1), pp.27-39.
Stoknes, P., 2014. Rethinking climate communications and the “psychological climate
paradox”. Energy Research & Social Science, 1, pp.161-170.
25Sculley, D., Malkin, R.G., Basu, S., & Bayardo, R.J. (2009). Predicting bounce rates in sponsored
search advertisements. KDD. pp 1326-1332
Support.google.com. 2020. Bounce Rate - Analytics Help. [online] Available at:
[Accessed 29 July 2020].
Sweeney, S. and Craig, R., 2011. Social Media For Business. Gulf Breeze, FL: Maximum Press,
pp.5-20.
UNDP. (2007). Fighting climate change: Human solidarity in a divided world. New York:
Palgrave.
UNEP. (2007). Sudan: Post-conflict environmental assessment. Nairobi: UNEP.
UNGA. (2009). Climate change and its possible security implications: Report of the
secretary-general. New York: UNGA.
Wadhwa, V., Latimer, E., Chatterjee, K., McCarty, J. and Fitzgerald, R., 2017. Maximizing the
Tweet Engagement Rate in Academia: Analysis of the AJNR Twitter Feed. American Journal of
Neuroradiology, 38(10), pp.1866-1868.
Whova. 2020. What Is Whova? | Whova FAQ. [online] Available at:
[Accessed 6 August 2020].
26CGIAR Climate Security aims to address the impending security threats of climate change by showcasing the intricate feedback loops across political and socio-economic systems and the ways in which conflict dynamics can be influenced by climate-related factors in multiple ways. CGIAR Climate Security aims to highlight the interconnected drivers and pathways between climate and security by combining research on natural resource management, agricultural productivity, livelihoods and food security, climate science, youth and gender, value chains and markets to underpin the complex nexus of climate and security. CGIAR’s Climate Security work aims to integrate discourse of security into climate science through research, the development of open source data platforms, the elevation of partnerships to stimulate the exchange of vital resources and information, and the design of programs and interventions for peace building. For more visit us at https://www.climatesecurity.cgiar.org/ This research was carried out in partnership with the following organisations: CCAFS is led by: CCAFS research is supported by:
You can also read