Different profiles for the assessment of student theses in teacher education - Diva-Portal.org
←
→
Page content transcription
If your browser does not render page correctly, please read the page content below
Higher Education
https://doi.org/10.1007/s10734-021-00692-w

Different profiles for the assessment of student theses
in teacher education

Karin Stolpe1      · Lars Björklund1         · Mats Lundström2      · Maria Åström3

Accepted: 1 February 2021
© The Author(s) 2021

Abstract
Previous research shows a discrepancy between different teachers’ assessment of student
theses. This might be an even larger problem in the context of teacher education, since
teacher trainers originate from different disciplines. This study aims to investigate how dif-
ferent assessors prioritise between criteria for assessment. Criteria were elucidated using
repertory grid interviews with teacher trainers. These criteria formed the basis for a web-
based Qsort that was distributed to teacher trainers at three different universities. The 66
teacher trainers in this study represented different disciplines, but were all engaged in the
supervision and examination of student theses from teacher education programmes. The
analysis revealed three different factors, which have been labelled: logic text structure as
product, research process as product and results as product. The differences may not be
explained by the background (e.g. discipline, university or gender) of the teacher trainers.
Together, these three factors explain why teachers assessing student theses may accentuate
different personal criteria. Hence, this might impact on their grading practice and also the
interrater reliability.

Keywords Assessment · Interrater reliability · Q methodology · Teacher education ·
Teachers’ grading practice

Introduction

Student theses are widely used in higher education internationally. However, inconsistency
in grading is common in complex higher education tasks, which in turn leaves students
with a potential sense of unfairness (Bloxham et al., 2016). This, in turn, could be fatal for
the students in their forthcoming studies and carriers (O’Hagan & Wigglesworth, 2015), as
discrepancies in assessment might result in repeated revisions and a delay of graduation.

* Karin Stolpe
  karin.stolpe@liu.se
1
    Department of Behavioural Sciences and Learning, Linköping University, Norrköping, Sweden
2
    Department of Natural Science, Mathematics and Society, Malmö University, Malmö, Sweden
3
    Department of Pedagogical, Curricular and Professional Studies, University of Gothenburg,
    Gothenburg, Sweden

                                                                                            13
                                                                                   Vol.:(0123456789)
Higher Education
During the process of writing a thesis, students may have access to a supervi-
sor. This means that they meet at least two different teachers: the supervisor and the
examiner. Previous research indicate that teachers differ in terms of how they assess
students’ theses (e.g. Bloxham et al., 2016; O’Hagan & Wigglesworth, 2015; Read
et al., 2005; Gingerich et al., 2017). This leaves students frustrated, when they have
followed the advice of their supervisor and later meet an examiner who assesses their
work differently.
Assessing student theses is a highly complex and demanding activity (Shay, 2004). In
the case of Swedish teacher education, the student thesis is the final degree work. The
projects align with a professional perspective and are typically empirical (Erixon Arre-
man & Erixon, 2017). In a sense, the student theses at the teacher education programmes
are a balance act between the professional and academic discourse (Erixon Arreman &
Erixon, 2017; Arneback et al., 2017). However, despite the presence of the teaching pro-
fession, the academic orientation (Råde, 2019) in the Swedish student thesis tradition is
strong. When the student thesis became mandatory in Swedish teacher education in 1993
(Ministry of Education and Research, 1993:100), the intention was to make the educa-
tion more research based (Bergqvist, 2000), in order to strengthen the teaching profes-
sion. One objective was that students should develop independent and critical reasoning
as well as a questioning attitude from writing a thesis (Bergqvist, 2000). Thus, the work to
be assessed is complex, as it comprises both the process behind the actual theses and the
production of a comprehensive text. The process resembles the research process in many
senses. It consists of data collection, for example conducting interviews and observations
or collecting textbook materials or curricula. The data are later analysed, and conclusions
are drawn. The student needs to choose an appropriate method in order be able to carry
out data collection, and a theoretical framework needs to be used to be able to perform the
analysis. However, performing the process well is not enough to produce a good thesis.
The student also must formulate a text that argues for the choices made, and that makes
a clear, aligned argument from research question to conclusion. The text should make the
process transparent. All these aspects, and probably more, can be considered when assess-
ing student theses. Student thesis courses within teacher training programmes in Sweden
often cover a period of 10 weeks (15 ECTP), and the thesis normally comprises approxi-
mately 30–40 pages.
One possible explanation for the differences observed between different asses-
sors is that examiners originate from different academic disciplines and subject cultures
(Becher, 1994). Within teacher education in particular, examiners from different subject
areas and disciplinary traditions assess student theses. Examiners may have a background
in pedagogy or behavioural studies, in pure disciplines such as maths, science or history,
or in combinations like science education or social science education. It is fairly common
for teachers who work in teacher education to have a teaching degree themselves, but this is
not a prerequisite. Although there is a great variety in teacher educators’ disciplinary back-
grounds, Lundström et al. (2016) show that the variances between different academic disci-
plines are minor. This result is also supported by earlier research that found high inter-rater
reliability between examiners from different disciplines (Kiley & Mullins, 2004; Bettany-
Saltikov et al., 2009). One explanation for why the studies show high inter-rater reliability
is the way the criteria for assessment were expressed. Bettany-Saltikov et al. (2009) suggest
that criteria that are generic in nature tend to lead to good inter-rater reliability. Hence, the
criteria were formulated to the intended learning outcomes, such as “complexity of analy-
sis” or “academic presentation of the work”. Thereby, the idea was to formulate criteria
that could be used to ensure fairness between institutions.
13Higher Education
In teacher education, lecturers from different disciplines are all part of the same
teacher community. It is therefore possible to suggest that an assessment culture
develops in such communities (Lave & Wenger, 1991). Bloxham and Boyd (2012)
have summarised two separate standards that exist among teachers in higher edu-
cation: academic standards and private standards. The authors argue that assessors
in the assessment process find themselves negotiating a potential tension between
the two. The academic standards stand for the formal and measurable and are
important for quality and external review. In contrast, the private standards repre-
sent teachers’ tacit knowledge, and their “autonomous act of marking” (Bloxham &
Boyd, 2012). Furthermore, research indicates that new lecturers learn the implicit
criteria and slowly harmonise their own personal criteria with the collective criteria
of the department (Jawitz, 2009). These results indicate that another factor that could
explain the differences between assessors is the experience of grading in a certain
department or context.
Yet, another possible explanation for differences in assessment is the level of
assessment experience. The level of experience may potentially play a role in terms
of reliability. Research shows that experienced assessors tend to take a holistic
approach rather than relying on formal criteria, in comparison with more novice
assessors (Bloxham et al., 2011; Orr, 2010). Sadler (2009) describes the two ways
of assessing, the holistic and the analytic approach, as being qualitative. Using the
analytic approach, the examiner uses a list of formal criteria and makes the grading
criterion by criterion. As a second step, the judgments are combined. In the holis-
tic approach, a more global view is used to assess the student work. In this case,
the assessor typically builds up a mental view gradually which leads to a judgment
of the overall quality. These two approaches could be one explanation why asses-
sors tend to differ in their decisions. However, these findings were not supported
by Jansson et al. (2019). According to their findings, novices tend to lean on the
formal criteria and use a more analytic approach in their assessment process. Expe-
rienced assessors lean on a holistic approach and use their personal as well as the
formal criteria.
Although generic criteria may be one way to improve inter-rater reliability, as men-
tioned above (Bettany-Saltikov et al., 2009), some studies suggest that the use of assess-
ment criteria per se may be a potential cause of variability (Bloxham et al., 2016). Blox-
ham et al. (2011) present criticism of the paradigm that assessment and grading should be
guided by criteria, based on findings in the literature. Criteria could be interpreted, used
and applied differently by teachers (Webster et al., 2000). However, some criteria, such as
“structure” and “scientific quality”, are more predictive for the final grade of theses (Haags-
man et al., 2021). But, there are also assessors who do not use criteria, either because they
do not agree with them or because they believe that their own judgments are sounder than
the formal criteria (Baume et al., 2004). Added to this, assessors use personal criteria that
are either explicit (Baume et al., 2004; Webster et al., 2000; Price, 2005) or implicit or tacit
(Hunter & Docherty, 2011).
Academic and disciplinary knowledge are often hidden or tacit (McGrath
et al., 2019; Polanyi, 1966). McGrath et al. (2019) argue that there is a problem that
teachers’ knowledge of academic literacy is tacit. McGrath et al. (2019) wanted to
increase the teachers’ awareness and their metacognition to make them reflect on
their knowledge and on how the academic literacy informs their teaching. Here, we
assume that grading of complex tasks, for example student theses, is, at least to some
extent, based on tacit knowledge. This assumption leads to methodological issues.
13Higher Education When knowledge is tacit, it is hidden for the person him-/herself, and not possible to explicate. However, there are techniques to elucidate tacit knowledge, of which this study utilises two. Previous research has tried to elucidate which personal criteria assessors use (e.g. Svennberg, 2017). However, this article takes a different approach and investigates how examiners rank different criteria for assessing student theses. In this sense, this study investigates the criteria examiners personally bring to the assessment process. These could be the examiners’ own private standards, or the formal academic standards formulated as assessment guidelines (see Blox- ham & Boyd, 2012), or a mix thereof. In this article, the criteria stem from per- sonal so-called constructs extracted from repertory grid interviews (Kelly, 1955) with lecturers (Björklund et al., 2016; Björklund, 2008). By using this approach, this article aims to add to insights into how assessors prioritise between differ- ent criteria for assessing student theses. Utilizing the Q methodology, where the constructs constitute the Q sample, we will be able to formulate different assess- ment profiles based on the relative ranking between different constructs. Moreo- ver, we can seek explanations for the different assessment profiles among teacher trainers. Method To meet the aim of this study, Q methodology has been applied. Q methodology has been proposed as a method to capture complex phenomena that would be hard to grasp with other methods (Woods, 2012). Since assessment is a complex, holis- tic and experience-based activity, which also has a tacit dimension, this method could help scrutinise teacher trainers’ condensed criteria for assessment. For a deeper discussion on the methods used in this study, see Björklund et al. (2016). Methodology Q methodology can be used to systematically study subjectivity, a person’s opinions, beliefs, criteria, attitudes, etc. (Brown, 1993; Woods, 2012; Löfström et al., 2015). To form the Q sample, sixteen teacher educators from three different universities in Sweden were interviewed (see also Lundström et al., 2019). The interviews were conducted with the Repertory Grid Technique (RGT) (see Kelly, 1955; Zuber-Sker- ritt, 1987). The aim of using this technique is to elicit underlying, or tacit, criteria for assessment (Björklund, 2008). Hence, we used this technique to facilitate for the informants to verbalise their personal criteria. In preparation for the RGT interviews, the respondents had read between five and eight student theses. During the inter- views, the respondents compared the theses in groups of three and were asked to say which one of the three deviated—positively or negatively—from the other two. During this first stage, the respondents did not have to provide grounds for their choices. In a second stage, the respondents were asked to describe noted differences, after which the respective respondent and the interviewer agreed on a label for these criteria. The criteria—or constructs (Kelly, 1955)—are referred to in this article as “statements”. The goal of the RGT interviewing was to gather as many different statements as possible. 13
Higher Education
The RGT interviews rendered a list of 92 different statements, which were later
reduced to 45 statements (see Löfström et al., 2015). Here, our aims were to limit over-
lapping statements and to merge statements that were very similar. For example, “good
method” and “insight in method” were combined into the statement “appropriate choice
of method”. In the same manner, “good literature” was merged with “relevant research
literature”, and “discussion about research ethics” was merged with “research ethics”. The
reduction was discussed by all four authors of this paper until consensus was reached. A
complete list of statements was provided in Swedish and has been translated for this arti-
cle (see Appendix Table 6).
The RGT interviews rendered a list of 92 different statements, which were
later reduced to 45 statements (see Löfström et al., 2015). Here, our aim was to
limit overlapping statements, and to merge statements that were very similar. For
example, “good method” and “insight in method” were combined into the state-
ment “appropriate choice of method”. In the same manner, “good literature” was
merged with “relevant research literature”, and “discussion about research eth-
ics” was merged with “research ethics”. The reduction was discussed by all four
authors of this paper until consensus was reached. A complete list of statements
was provided in Swedish and have been translated for this article (see Appendix
Table 6).
Data were collected using Q methodology (Watts & Stenner, 2005). As a first step,
respondents are presented with a selection of statements about a topic. These state-
ments form the Q sample. Respondents are asked to rank the statements from their
individual point of view, according to a preference or judgement about them, using
quasi-normal distribution. The respondents then give their subjective opinions on the
statements, thereby revealing their subjective viewpoints. These individual rankings
(or viewpoints) are then subject to factor analysis. This factor analysis results in so-
called “segments of subjectivity” (Brown, 1993), which in this article are referred to
as “profiles”. The method aims to discern existing patterns of thought (Zabala, 2014).
One important step in Q methodology involves describing the character of these pro-
files. The number of informants is subordinate to the quality of the data. Brown (1993)
argues that quality comes before quantity. To be able to define which features charac-
terise the profiles, the most important thing is not having a large number of informants
(Brown, 1993), but rather having a data sample that represents the communications of
the topic.
Stephenson (1935) presented Q methodology as an inversion of conventional fac-
tor analysis in the sense that Q correlates people instead of tests. The correlation
between personal profiles then indicates similar viewpoints, or segments of subjec-
tivity (Brown, 1993). By correlating people, Q factor analysis provides information
about similarities and differences in people’s viewpoints. If each individual has his
or her own specific likes and dislikes, Stephenson (1935) argued, their profiles will
not correlate. However, if significant clusters of correlations exist, they can be fac-
torised, or described as common viewpoints, and individuals can be measured with
respect to them.
Stephenson (1935) made it clear that Q methodology refers to a population of n
different tests, each of which is measured or scaled by m individuals. This means that
the tests are given subjective scores by these individuals. Q sorting calls for a person
to rank a set of stimuli according to an explicit rule, usually from agree (+ 5) to disa-
gree (− 5). The sorting is subjective in that the participant sorts the cards based on his
or her own point of view. There is no right or wrong.
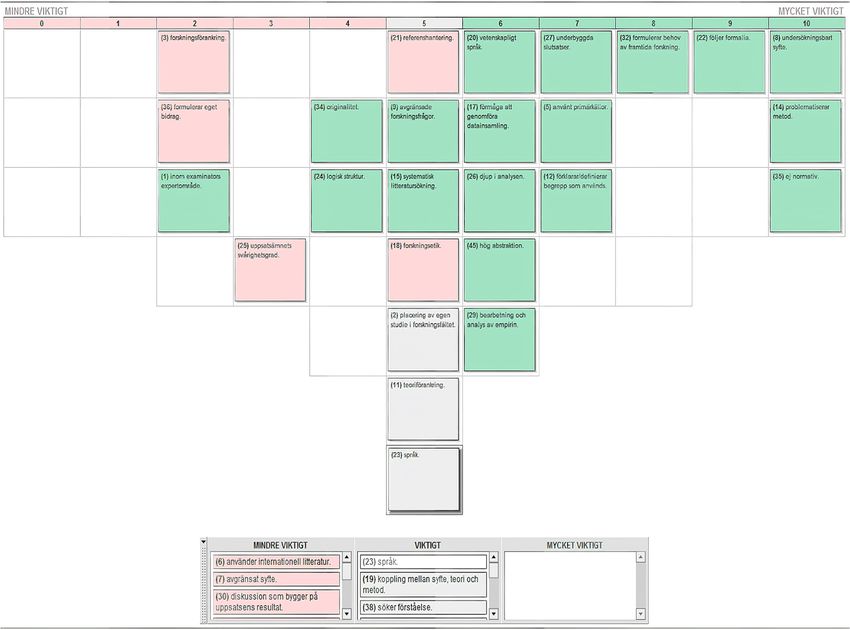
13Higher Education Data collection In the next step, a web-based Qsort was constructed and was distributed using the FlashQ software package created by Christian Hackert and Gernot Braehler (www.hackert.biz/ flashq). The Qsorts were stored in the cloud. The online tool FlashQ consisted of four dif- ferent steps, which are briefly described below: 1. In the introduction, the participants were asked the following question: “What do you think is most important when describing a good student thesis?” To answer the question, the participants were presented to the different statements in random order. The partici- pants were asked to read every statement and, using the drag-and-drop function with the mouse, place the statement in one of three boxes: less important to the left (1—pink), very important to the right (3—green) and the rest in the box in the middle (2—grey). 2. When all the criteria had been placed in one of the three boxes, the next step began. The par- ticipants were asked to place the criteria from the three boxes on a scale from 0 to 10. There were restrictions on how many criteria could be assigned to each number on the scale (Fig. 1). 3. When all the criteria had been placed on the scale, the participants could make changes to the ranking. 4. In the last step, the participants were asked to provide some background information. In the study presented in this article, the data collected via the online tool FlashQ have been analysed. The background questions in the fourth step provided information about Fig. 1 The second step of the Qsort, which shows the restriction on each number on the axis. All statements are listed in Appendix Table 6 13
Higher Education

how long the participants have been active as a supervisor or examiner of student theses,
and approximately how many theses the informant has supervised or examined per year.

Participants

The online FlashQ was distributed as a link to a website in an invitation email explain-
ing the purpose of the study. The vast majority of the participants worked at three
different universities in Sweden. All three universities offer teacher training. The uni-
versities differ in terms of which formal criteria they officially use for assessment
of student theses. An analysis of the fall-off shows that no variable such as gender,
university or disciplinary background was overrepresented or underrepresented. The
response rate was 36.9%. Of the 66 participants, 36 were women and 30 were men.
   All teachers who answered the survey were supervisors and/or examiners of stu-
dent theses for teacher education. The sample was selected to ensure a distribution
in terms of subject, experience and university. Sixty-one of the participants held PhD
degrees, making them eligible to examine student theses. Five of the informants did
not have PhD degrees and were only working as supervisors.
   The study follows the ethical guidelines from the Swedish Research Council. The online
FlashQ was anonymous, and no personal data were collected.

Data analysis

The data have been analysed using mixed methods (Ramlo & Newman, 2011;
Ramlo, 2016). Q methodology could be described as a way to seek for and describe
patterns (Stenner & Stainton Rogers, 2004). As a first step, data from the online
FlashQ were saved in an Excel file and analysed in a software package: Ken-Q Analy-
sis, A Web Application for Q Methodology (Banasick, 2019). Data were imported
into the software package and processed. Five factors were extracted using the cen-
troid method. Three significant factors were then rotated using the varimax method.
These three factors explained 58% of the variation in the data. We chose to focus on
the top and bottom six statements, calculated using the software package, since we
wanted to describe the differences between the different factors (see, e.g. Table 1). As
a second step, an interpretation was made to describe the three profiles as prototypi-
cal examiners by analysing distinguishing statements for each factor (see also Löf-
ström et al., 2015). Moreover, the descriptions were also based on the analysis of the
statements that differentiated the different factors. The descriptions were discussed by
all four authors to ensure reliability.

Findings

The three extracted factors will be discussed in turn in an ‘idealised’ manner, describ-
ing a typical viewpoint of a subscriber to the factor. The interpretations are based on
the given factor array and distinguishing statements for each factor as detailed in the
KenQ output.

                                                                              13
Higher Education
Table 1 Factor A: top six most No. Statement Grid position
like/unlike statements
8 Researchable purpose +5
24 Logical structure +5
33 Alignment +5
19 Connection between purpose, theory, and method +4
27 Substantiated conclusions +4
29 Processing and analysis of empirical data +4
34 Originality −4
32 Formulating need for future research −4
25 Difficulty of attempted content −4
39 Gender perspective −5
1 Within examiner’s area of expertise −5
45 High abstraction −5
Factor A
Factor A explains 22% of the variance. Fourteen participants had pure loadings on
this factor. Table 1 highlights the six statements rated at each extreme, positive and
negative (12 in total). These items will be referred to within the factor description.
Table 1 shows that factor A represents the belief that the alignment, structure and
outline of the thesis are important. There should be a researchable purpose (8), the
text structure should be logical (24), and there should be a connection between pur-
pose, theory and method (19, 33).
Statements that were ranked high in factor A are characterised by considering wider
perspectives on a thesis. Logical structure, connections between different parts (19),
and alignment are all criteria that feature a holistic view of the thesis. The outline of the
thesis is important for the participants placed within this factor. However, researchable
purpose and processing and analysis of empirical data are statements which a majority
of all informants rank high. These statements are not unique to factor A in that sense.
Statements which are lower ranked should not necessarily be seen as unimpor-
tant, since the scale is relative. However, they are not as important as those that were
ranked high. It is hard to see any connections between the criteria which are ranked
low within factor A. The lower ranked criteria could be inferred to deal less with the
actual thesis as a product. High abstraction (45), originality (34) and difficulty of
attempted content (25) are all statements that lie beyond the actual text. These state-
ments say something about the author’s ambition, rather than about the structure and
precise content of the thesis. The statement within examiner’s area of expertise (1)
does not say anything about the quality of the thesis, but rather about the student’s
choice of subject compared to the examiner’s research interests. Those statements
ranked low by the informants in factor A are often also ranked low by other inform-
ants. This means that there are statements that a majority of the participants find less
important in their assessment process.
Statements which distinguish factor A from other factors are listed in Table 2. All
statements presented in the table are statements which differ significantly at either
p < 0.01 level or p < 0.05 level. As mentioned above, structure is important for
informants in factor A. However, we also note that some criteria distinguish factor
13Higher Education Table 2 The statements that distinguish factor A from the other factors are significant at p
Higher Education

Factor B

Factor B explains 20% of the variance. Seven participants had pure loadings on this factor.
Table 3 highlights the six statements rated at each extreme (12 in total).
   Factor B participants agree that a meta-perspective on the research process
is important. This is revealed through the importance of problematizing (31).
Through problematizing, the student makes strengths and weaknesses explicit
in the thesis. Being able to do so calls for knowledge and awareness about the
research process. Without this awareness, the student will not be able to problem-
atise the results and the methods used. Also, answering research questions (28)
is seen as critical in this factor, indicating that the research process is important.
   Moreover, connection to research (3) indicates skills that characterise a well-
developed research approach from the student. This statement, in line with the
above-mentioned statements, includes an awareness of which choices are made.
Also, the high ranking of the criteria research ethics (18) demonstrates that
this factor regards areas where the student clarifies his or her considerations.
   As seen in Table 3, statements of a more overarching character, such as interesting
research question (10), originality (34) and exciting (41), are considered less important
within this factor.
   An overall interpretation of this factor is that it is characterised by stressing the
research process rather than the actual thesis as a product. However, the process should
be revealed in the thesis through problematizing and through connections to earlier
research.
   The statement researchable purpose (8) stands out for factor B, compared
with factors A and C. Both factor A and factor C rank this statement very high,
in contrast to factor B. In factor B, a researchable purpose is placed almost in
the middle, which indicates that many statements are valued higher in factor B.

Table 4  Factor C: top six most   No. Statement                                                Factor
like/unlike statements                                                                         array
                                                                                               position

                                  27   Substantiated conclusions                               +5
                                  30   Discussion based on the results of the student thesis   +5
                                  19   Connection between purpose, theory, and method          +5
                                  29   Processing and analysis of empirical data               +4
                                  28   Answering research questions                            +4
                                  31   Problematizing of results                               +4
                                  32   Formulating need for future research                    −4
                                  45   High abstraction                                        −4
                                  39   Gender perspective                                      −4
                                  34   Originality                                             −5
                                  42   Strong narrative voice                                  −5
                                  41   Exciting                                                −5

13
Higher Education
Factor C
Factor C explains 16% of the variance. Fifteen participants had pure loadings on this factor.
Table 4 shows the six statements rated at each extreme (12 in total).
Factor C is represented by the belief that the content and research product
are of importance. This is indicated by the high rating of the statements sub-
stantiated conclusion (27) and answering the research question (28). Also, the
statement processing, and analysis of empirical data (29) indicates the impor-
tance of not just presenting raw data, but also analysing the data to some extent.
Furthermore, the connection between purpose, theory, and method (19) is of
importance to this group. One interpretation of this statement is that the product
consists of an alignment between these three parts. If the purpose, theory and
method do not match, it is not possible to draw any substantiated conclusions
or answer the research questions. The suggestion that this profile focuses on the
product is also indicated by the fact that the discussion should be based on the
results of the thesis (30).
Compared with factor A, factor C does not highlight the structure of the
thesis explicitly (Table 2). For example, logical structure (24) and text struc-
ture (44) are both ranked relatively high in factor A compared with factor C.
In line with this, the use of language (23) is ranked higher in both factor A
and factor B compared with factor C. One statement that also separates fac-
tor C and factor B is research ethics, which is ranked much higher in factor
B (18).
Three main profiles
As stated above, the findings of this study show that three different assessment profiles
together explain 58% of the total variation in the data. A qualitative analysis of these differ-
ent profiles implies three types of assessors.
The first profile, based on factor A, is characterised by highlighting statements
relating to the outline of the thesis, where structure and language are important
aspects. In this case, students should be able to write a coherent text with a logic that
can be followed. This profile is characterised by statements that can be associated
with emphasizing the text as a coherent and logical text. Factor A is named Logic text
structure as product.
The second profile, based on factor B, takes a meta-perspective on the thesis, and
stresses the importance of taking a conscious approach to the research process. For
this group, it is important to problematise the different choices made during the pro-
cess, such as research ethics and the results. Factor B is labelled Research process as
product.
Factor C is the basis for the third profile which shows a clear favour for state-
ments relating to the results of the research process. In this profile, it is important
to obtain a result that can answer the research questions and that is aligned with
the theory and method used. The text itself is not the most important thing for this
group, but rather the results presented in the text. Factor C is called Results as
product.
So far, the differences between the three factors have been emphasised. However,
there are also statements that unite the three factors (Table 5). Since some of them are
13Higher Education
Table 5 Statements that are No. Statement Factor 1 Factor 2 Factor 3
ranked high by all three factors
28 Answering research questions +3 +3 +4
4 Use of relevant research literature + 3 +3 +3
19 Connection between purpose, +4 +5 +4
theory, and method
not ranked high by any of the groups, such as use of relevant research literature (4),
they do not appear in the tables above. The statement connection between purpose,
theory, and method (19) is equally ranked within the three factors. This means that
even if there are differences in terms of which statements are emphasised, there are
also statements that unite them.
Discussion
This study aims to expand our understanding of how different assessors priori-
tise between constructs for assessment. This research investigates the criteria
that examiners bring to the assessment process, and this could be a combination
of personal and institutional criteria. The constructs that comprise the Q-sam-
ple, originated from interviews in which assessors were asked to distinguish dif-
ferent theses from each other (Repertory grid technique, see Kelly, 1955). Using
this approach, we were able to elucidate constructs that were personal to the
assessors. We argue that this may take us one step closer to the actual process of
how the decision process is performed. Research shows the difficulties of using
specific criteria for assessment (Bloxham et al., 2011, 2016). In this study, we
take another point of departure and seek to elucidate qualitatively divergent
assessment profiles amongst teacher trainers who assess student theses from
teacher education programmes in Sweden.
The results show three qualitatively different assessment profiles, which
together explain 58% of the total variation in the data. The first profile, which
we have named Logic text structure as product, highlights the importance of a
coherent and well-structured text. We refer to the second profile, which takes
a meta-perspective on the overall work with a thesis, as Research process as
product. Different choices made during the process, such as a problematization
of the results or a discussion on research ethics, are important to this profile.
The third profile has been labelled Results as product due to the high impor-
tance of a result that is in line with the research questions and the theory and
method. One should keep in mind that there is no hierarchical order between
these different profiles. In the following, we will discuss each of these pro-
files separately before providing some concluding remarks and implications for
assessment.
To be able to create a thesis which shows logic of the text structure, the stu-
dent needs to have a clear purpose. The logic text structure is required to be able
to present the analysis of empirical data. We would argue that an examiner who
falls into this category does not look at details, but rather at the bigger picture.
This could be compared with earlier research stating that experienced assessors
tend to take a holistic approach rather than relying on formal criteria (Bloxham
13Higher Education
et al., 2011; Orr, 2010). Drawing on this conclusion, it would be possible to sug-
gest that examiners with the profile Logic text structure as product have more
experience of reading and assessing student theses in teacher education. How-
ever, this is not revealed in our data and is something that should be further
investigated.
The criteria ranked lowest in this factor—originality, high abstraction, and dif-
ficulty—might not be considered as criteria to decide whether a thesis should pass.
Instead, these statements can be used to decide whether a thesis should receive a
higher grade than simply a pass. This means that lower ranked factors should not be
seen as unimportant. Instead, these factors should be inferred as less important than
the others.
Within the factor Research process as product, the process of the thesis is seen
as important. Meanwhile, it is important for this factor that the author of the text is
transparent about the process. This implies that the thesis shows that the student is
aware of which constraints and benefits a certain method entails. This approach also
shows the complexity of assessing student theses. A thesis demonstrates the ability
to both perform research work and write a coherent report that argues for the choices
made. In the case of Research process as product, the research process dominates
over the product, and hence requires a meta-perspective in the text.
The last factor, Results as product, takes a perspective that distances the written
product from the research process. This is indicated by the stronger emphasis on state-
ments relating to the results of the research process. In this factor, it seems important
that the product of a student thesis is a result from a research process and the text
appears to be subordinated.
Even though the results show three distinct assessment profiles, it should be kept in
mind that these explain about half (58%) of the research data. This indicates that there
are combinations of these three profiles among the informants of this study. Moreo-
ver, the results show that there are some criteria that are equally ranked between the
different profiles (Table 5). Said criteria are important, in that they are relevant to
research per se. To give answers to the research questions, use relevant research liter-
ature, and expose a connection between purpose, theory and method are all important
to characterise research. Examiners with background in research could be expected to
share a common ground related to this experience. Hence, this should influence their
personal criteria for assessing student theses that share many properties with research.
This study adds novel knowledge on the criteria teacher trainers bring to the assess-
ment process. Earlier research have shown that examiners use an holistic approach,
rather than formal criteria in their marking (Bloxham et al., 2011). However, in this
study, we are able to distinguish different profiles and hence show that the holistic
approach could have different foci. Jansson et al. (2019) show that novice teachers are
not more often stuck in detail when marking, than do expert teachers. Even so, novice
teachers tend to formulate their judgements more closely to formulations in the for-
mal criteria. Moreover, Bloxham and Boyd (2012) have formulated two sets of stand-
ards: academic and private standards. In our study, we do not separate between these
two. Rather, we take the approach to look how examiners prioritise between different
criteria. Our findings thus imply that all profiles are a mix of both personal and insti-
tutional criteria. Hence, the differences in examiners’ assessment could be explained
by the fact that their priorities differ.
Moreover, this study provides methodological insights in how different methods
can be combined to elucidate knowledge that is tacit or at least hard to put in words.
13Higher Education
The combination of Repertory Grid Technique and Q methodology reveal new knowl-
edge on higher education teachers’ assessment priorities.
Concluding remarks and implications
We suggest that knowledge about the three profiles that we present in this study could
help inform the discussion on how more reliable formal criteria can be formulated. As
previous research have suggested, more generic criteria seem to give a higher inter-rater
reliability (Bettany-Saltikov et al., 2009; Haagsman et al., 2021). However, this may
not be enough. We suggest that examiners and supervisors should discuss how they pri-
oritise between different criteria. The three different profiles could be used as a starting
point for such discussion. Furthermore, the outcome of such discussions could also be
made explicit for the students so that they are aware of what they are aiming for.
The participants in this study work at three different universities with different for-
mal criteria for assessing student theses. They also have different disciplinary back-
grounds, and their experiences of assessment vary. Despite this, three different pro-
files emerged from the data, which were not correlated to university, gender, or level
of experience. This result indicates that factors other than the formal criteria seem to
inform the examiners regarding how to sort the criteria based on importance. Moreo-
ver, another study based on the same data set, Lundström et al. (2019) show that there
is no correlation between background variables such as university, disciplinary back-
ground or gender and the preference for different criteria.
This study proposes an explanation to why students may feel squeezed between differ-
ent preferences of the supervisor and the examiner. In the examination process, a student
may meet an examiner that emphasises the logic of the text structure. On the surface,
both the supervisor and the examiner might follow the same formal criteria, but as they
give emphasis to different criteria, and add personal criteria, the situation for the stu-
dent is as for the best confusing. It could lead to many rounds of revisions. In the worst
case this could even prevent the student from graduating. As earlier research suggests,
students’ sense of a fair assessment is associated with methods that are learner-centred
(Flores et al., 2015). That is, methods such as portfolios and projects that develop stu-
dent autonomy and sense of responsibility. However, since assessment of student theses
are limited by norms and guidelines, both formal and personal, the assessment process
could be characterised as traditional. From a student point of view, it is hard to grasp the
demands and expectations. This may leave the student with a feeling that the assessment
does not reward effort, but rather measures ‘luck’. According to Sambell et al. (1997),
these permissions will potentially leave the student with a feeling of unfairness.
One limitation of this study is that it does not lean on examiners’ actual assessment
process. Using different methods and methodologies, we have sought to elucidate
which criteria examiners find the most important. More research is needed to know
if the assessment process is informed by these criteria and if it is possible to find the
profiles in this process.
The results from this study indicate that a more thorough discussion about what should
be the focus when assessing student theses. This study suggests a lack of coherence about
whether it should be the process, the product, or the logic of the text (or something else)
that should be the main focus of the assessment. We would argue that this contradiction
could lead to the same student thesis ending up with different marks, depending on what
the examiner finds most important. This is an area which needs further investigation.
13Higher Education
Appendix
Table 6 A list of the 45 No. Statement
statements that constituted the
Q sample 1 Within examiner’s area of expertise
2 Positioning the study in the research field
3 Connections to research
4 Use of relevant research literature
5 Use of primary references
6 Use of international literature
7 Defined aim
8 Researchable purpose
9 Defined research questions
10 Interesting research question
11 Connection to theory
12 Explaining/defining concepts that are used
13 Appropriate choice of method
14 Problematizing method
15 Systematic search for literature
16 Transparent description of method
17 Ability to perform data collection
18 Research ethics
19 Connection between purpose, theory, and method
20 Scientific language
21 Referencing
22 Following formalities
23 Use of language
24 Logical structure
25 Difficulty of attempted content
26 Analysis with depth
27 Substantiated conclusions
28 Answering research questions
29 Processing and analysis of empirical data
30 Discussion based on the results of the student thesis
31 Problematizing of results
32 Formulating need for future research
33 Alignment
34 Originality
35 Not normative
36 Phrasing own research contribution
37 Discussing generalisability
38 Quest for understanding
39 Gender perspective
40 Relevant for profession
41 Exciting
42 Strong narrative voice
43 Oral defence of thesis
44 Text structure
45 High abstraction
13Higher Education
Funding Open access funding provided by Linköping University. This project has been funded by the
Swedish Research Council.
Declarations
Conflicts of interest The authors declare that they have no conflict of interest.
Open Access This article is licensed under a Creative Commons Attribution 4.0 International License,
which permits use, sharing, adaptation, distribution and reproduction in any medium or format, as long
as you give appropriate credit to the original author(s) and the source, provide a link to the Creative Com-
mons licence, and indicate if changes were made. The images or other third party material in this article
are included in the article’s Creative Commons licence, unless indicated otherwise in a credit line to the
material. If material is not included in the article’s Creative Commons licence and your intended use is not
permitted by statutory regulation or exceeds the permitted use, you will need to obtain permission directly
from the copyright holder. To view a copy of this licence, visit http://creativecommons.org/licenses/by/4.0/.
References
Arneback, E., Englund, T., & Solbrekke, T. D. (2017). Achieving a professional identity through writing.
Education Inquiry, 8(4), 284–298.
Banasick, S. (2019). Ken-Q analysis, a web application for Q methodology, version 1.0.6. Retrieved March
15, 2020, from https://shawnbanasick.github.io/ken-q-analysis.
Baume, D., Yorke, M., & Coffey, M. (2004). What is happening when we assess, and how can we use our
understanding of this to improve assessment? Assessment & Evaluation in Higher Education, 29(4),
451–477.
Becher, T. (1994). The significance of disciplinary differences. Studies in Higher Education, 19(2),
151–162.
Bergqvist, K. (2000). Examensarbetet. Ett bidrag till vetenskaplighet i lärarutbildningen? [Student thesis.
A contribution to the research base in teacher education?]. Pedagogisk forskning i Sverige, 5(1), 1-18.
Bettany-Saltikov, J., Kilinc, S., & Stow, K. (2009). Bones, boys, bombs and booze: An exploratory study of
the reliability of marking dissertations across disciplines. Assessment & Evaluation in Higher Educa-
tion, 34(6), 621–639.
Björklund, L. (2008). The Repertory Grid Technique: Making tacit knowledge explicit: Assessing creative
work and problem solving skills. In H. Middleton (Ed.), Researching technology education: Methods
and techniques (pp. 46–69). Brill Sense.
Björklund, L., Stolpe, K., & Lundström, M. (2016). Making tacit knowledge explicit. Three methods to
assess attitudes and believes. In J. Lavonen, K. Juuti, A. Lampiselkä, A. Uitto, & K. Hahl (Eds.), Sci-
ence Education Research: Engaging Learners for a Sustainable Future: Proceedings of ESERA 2015,
Helsinki, Finland, 2016 (Vol. 11, pp. 1733-1741): University of Helsinki.
Bloxham, S., & Boyd, P. (2012). Accountability in grading student work: Securing academic
standards in a twenty-first century quality assurance context. British Educational Research
Journal, 38(4), 615–634.
Bloxham, S., Boyd, P., & Orr, S. (2011). Mark my words: The role of assessment criteria in UK higher
education grading practices. Studies in Higher Education, 36(6), 655–670.
Bloxham, S., den-Outer, B., Hudson, J., & Price, M. (2016). Let’s stop the pretence of consistent mark-
ing: Exploring the multiple limitations of assessment criteria. Assessment & Evaluation in Higher
Education, 41(3), 466–481. https://doi.org/10.1080/02602938.2015.1024607.
Brown, S. R. (1993). A primer on Q methodology. Operant Subjectivity, 16(3/4), 91–138.
Erixon Arreman, I., & Erixon, P. O. (2017). Professional and academic discourse–Swedish student
teachers’ final degree project in Early Childhood Education and Care. Linguistics and Education,
37, 52–62.
Flores, M. A., Veiga Simão, A. M., Barros, A., & Pereira, D. (2015). Perceptions of effectiveness, fair-
ness and feedback of assessment methods: A study in higher education. Studies in Higher Education,
40(9), 1523–1534. https://doi.org/10.1080/03075079.2014.881348.
Gingerich, A., Ramlo, S. E., van der Vleuten, C. P., Eva, K. W., & Regehr, G. (2017). Inter-rater variability
as mutual disagreement: Identifying raters’ divergent points of view. Advances in Health Sciences
Education, 22(4), 819–838.
13Higher Education
Haagsman, M., Snoek, B., Peeters, A., Scager, K., Prins, F., & van Zanten, M. (2021). Examiners’ use
of rubric criteria for grading bachelor theses. Assessment & Evaluation in Higher Education,
1–15. https://doi.org/10.1080/02602938.2020.1864287.
Hunter, K., & Docherty, P. (2011). Reducing variation in the assessment of student writing. Assessment
& Evaluation in Higher Education, 36(1), 109–124.
Jansson, M., Carle, J., Gunnarsson, A., & Ekbrand, H. (2019). How experience affects assessment–a lon-
gitudinal study of assessment of university students’ essays. Studies in Higher Education, 44(4),
719–732.
Jawitz, J. (2009). Learning in the academic workplace: The harmonization of the collective and the indi-
vidual habitus. Studies in Higher Education, 34(6), 601–614.
Kelly, G. A. (1955). The Psychology of Personal Constructs. Routledge.
Kiley, M., & Mullins, G. (2004). Examining the examiners: How inexperienced examiners approach the
assessment of research theses. International Journal of Educational Research, 41, 121–135.
Lave, J., & Wenger, E. (1991). Situated learning: Legitimate peripheral participation. Cambridge Uni-
versity Press.
Lundström, M., Björklund, L., Stolpe, K., & Åström, M. (2016). Assessing student theses: Differences
and similarities between examiners from different academic disciplines. Practitioner Research in
Higher Education, 10(1), 217–226.
Lundström, M., Stolpe, K., Björklund, L., & Åström, M. (2019). Konsumtionsuppsatser som ny bedömn-
ingspraktik för lärarutbildare [Systematic reviews as new assessment practice for teacher educa-
tors]. Pedagogisk forskning i Sverige, 24(1), 25–45.
Löfström, E., Trotman, T., Furnari, M., & Shephard, K. (2015). Who teaches academic integ-
rity and how do they teach it? Higher Education, 69(3), 435–448. https://doi.org/10.1007/
s10734-014-9784-3.
McGrath, L., Negretti, R., & Nicholls, K. (2019). Hidden expectations: Scaffolding subject specialists’
genre knowledge of the assignments they set. Higher Education, 78(5), 835–853. https://doi.org/10.
1007/s10734-019-00373-9.
Ministry of Education and Research (1993:100). Högskoleförordningen. Retrieved Mars 10, 2020, from
https://www.riksdagen.se/sv/Dokument-Lagar/Lagar/Svenskforfattningssamling/Hogskoleforordning-
1993100_sfs-1993-100/.
O’Hagan, S. R., & Wigglesworth, G. (2015). Who’s marking my essay? The assessment of non-native-
speaker and native-speaker undergraduate essays in an Australian higher education context. Studies
in Higher Education, 40(9), 1729–1747.
Orr, S. (2010). ‘We kind of try to merge our own experience with the objectivity of the criteria’: The
role of connoisseurship and tacit practice in undergraduate fine art assessment. Art, Design & Com-
munication in Higher Education, 9(1), 5–19.
Polanyi, M. (1966). The Tacit Dimension. Doubleday & Company Inc.
Price, M. (2005). Assessment standards: The role of communities of practice and the scholarship of
assessment. Assessment & Evaluation in Higher Education, 30(3), 215–230.
Ramlo, S. (2016). Mixed method lessons learned from 80 years of Q methodology. Journal of Mixed
Methods Research, 10(1), 28–45.
Ramlo, S., & Newman, I. (2011). Q methodology and its position in the mixed methods continuum.
Operant Subjectivity, 34(3), 172–191.
Read, B., Francis, B., & Robson, J. (2005). Gender, ‘bias’, assessment and feedback: Analyzing the writ-
ten assessment of undergraduate history essays. Assessment & Evaluation in Higher Education,
30(3), 241–260.
Råde, A. (2019). Professional formation and the final thesis in European teacher education: A fusion of aca-
demic and professional orientation. Education Inquiry, 10(3), 226–242.
Sadler, D. R. (2009). Indeterminacy in the use of preset criteria for assessment and grading. Assessment &
Evaluation in Higher Education, 34(2), 159–179.
Sambell, K., McDowell, L., & Brown, S. (1997). “But is it fair?”: An exploratory study of student per-
ceptions of the consequential validity of assessment. Studies in Educational Evaluation, 23(4),
349–371.
Shay, S. B. (2004). The assessment of complex performance: A socially situated interpretative act. Harvard
Educational Review, 74(3), 307–329.
Stenner, P., & Stainton Rogers, R. (2004). Q methodology and qualiquantology: The example of discrimi-
nating between emotions. In Z. Todd, B. Nerlich, S. McKeown, & D. D. Clarke (Eds.), Mixing methods
in psychology: The integration of qualitative and quantitative methods in theory and practice. Psychol-
ogy Press.
Stephenson, W. (1935). Correlating persons instead of tests. Character and Personality, 4, 17–24.
13Higher Education
Svennberg, L. (2017). Swedish PE teachers’ understandings of legitimate movement in a criterion-refer-
enced grading system. Physical Education and Sport Pedagogy, 22(3), 257–269.
Watts, S., & Stenner, P. (2005). Doing Q methodology: Theory, method and interpretation. Qualitative
Research in Psychology, 2(1), 67–91.
Webster, F., Pepper, D., & Jenkins, A. (2000). Assessing the undergraduate dissertation. Assessment &
Evaluation in Higher Education, 25(1), 71–80.
Woods, C. (2012). Exploring emotion in the higher education workplace: Capturing contrasting perspectives
using Q methodology. Higher Education, 64(6), 891–909. https://doi.org/10.1007/s10734-012-9535-2.
Zabala, A. (2014). qmethod: A package to explore human perspectives using Q methodology. The R Jour-
nal, 6(2), 163–173.
Zuber-Skerritt, O. (1987). A repertory grid study of staff and students’ personal constructs of educational
research. Higher Education, 16(5), 603–623.
Publisher’s note Springer Nature remains neutral with regard to jurisdictional claims in published maps and
institutional affiliations.
13You can also read