Different sites of actions make different responses to thiazolidinediones between mouse and rat models of fatty liver - Nature
←
→
Page content transcription
If your browser does not render page correctly, please read the page content below
www.nature.com/scientificreports
OPEN Different sites of actions
make different responses
to thiazolidinediones
between mouse and rat models
of fatty liver
Chihiro Ebihara1,2, Megumi Aizawa‑Abe1,3, Mingming Zhao1, Valentino Gumbilai1 &
Ken Ebihara1,2,3*
Therapeutic approach for NAFLD is limited and there are no approved drugs. Pioglitazone (PGZ),
a thiazolidinedione (TZD) that acts via peroxisome proliferator activated receptor gamma (PPARγ)
is the only agent that has shown consistent benefit and efficacy in clinical trials. However, the
mechanism of its therapeutic effect on NAFLD remains unclear. The poor understanding may be due
to problems with mouse, a species most used for animal experiments. TZDs exacerbate fatty liver in
mouse models while they improve it in rat models like in human patients. Therefore, we compared the
effects of TZDs including PGZ and rosiglitazone (RGZ) in ob/ob mice and Lepmkyo/Lepmkyo rats, models
of leptin-deficient obesity, and A-ZIP/F-1 mice and seipin knockout (SKO) rats, models of generalized
lipodystrophy. Pparg mRNA expression was markedly upregulated in fatty livers of mouse models
while it was unchanged in rat models. TZDs exacerbated fatty liver in ob/ob and A-ZIP/F-1 mice,
improved it in Lepmkyo/Lepmkyo rats and showed no effect in SKO rats. Gene expression analyses of Pparg
and its target gene, Fsp27 revealed that PPARγ in the adipose tissue is the exclusive therapeutic target
of TZDs in rats but PPARγ in the liver in addition to the adipose tissue is also a major site of actions
for TZDs in mice. Although the response to TZDs in mice is the complete opposite of that in human
patients, no report has pointed out the problem with TZD studies using mouse models so far. The
present study might provide useful suggestions in research on TZDs.
Metabolic syndrome, a complex risk factor for cardiovascular disease, predicts the development of non-alcoholic
fatty liver disease (NAFLD)1,2. NAFLD is now recognized as the hepatic component of the metabolic syndrome3.
In addition, metabolic syndrome with its individual components is also a major risk factor for the development
of nonalcoholic steatohepatitis (NASH), the most severe form of N AFLD4. NASH can progress to cirrhosis,
hepatocellular carcinoma, and liver failure. Despite the increasing number of patients, therapeutic approaches
for NAFLD and NASH are limited and there are no approved drug t reatments5. There is an urgent need for
further research in this field.
Many clinical trials have been and are being conducted for the drug treatment of NAFLD and NASH6.
Among these drugs, pioglitazone (PGZ) is the only agent that has demonstrated consistent benefit and efficacy
in clinical t rials7–11. PGZ is a thiazolidinedione (TZD) that acts by binding to peroxisome proliferator activated
receptor gamma (PPARγ)12. PPARγ is expressed mainly in adipocytes and plays a key role in lipid metabolism
and glucose r egulation13. Thus, PGZ is used as an antidiabetic agent to improve adipocyte dysfunction and
insulin resistance14. However, the mechanism of its therapeutic effect on NAFLD still remains unclear. Since
insulin resistance is closely related to the fat accumulation in the liver, one of the mechanisms is thought to be
the insulin sensitization15,16, but metformin did not show any effect on NAFLD so far, despite its effectiveness in
1
Department of Medicine and Clinical Science, Kyoto University Graduate School of Medicine, Kyoto,
Japan. 2Division of Endocrinology and Metabolism, Department of Internal Medicine, Jichi Medical University
School of Medicine, 3311‑1 Yakushiji, Shimotsuke‑shi, Tochigi 329‑0498, Japan. 3Institute for Advancement of
Clinical and Translational Science, Kyoto University Hospital, Kyoto, Japan. *email: kebihara@jichi.ac.jp
Scientific Reports | (2022) 12:449 | https://doi.org/10.1038/s41598-021-04036-7 1
Vol.:(0123456789)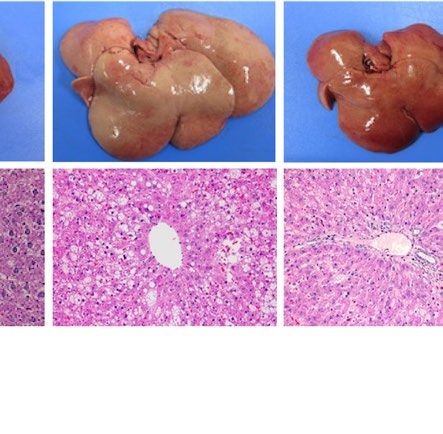
www.nature.com/scientificreports/
improving insulin resistance 17,18. Thus, the insulin sensitization by itself does not explain the therapeutic effect
of PGZ on NAFLD.
The poor understanding of the mechanism by which PGZ improves NAFLD is mainly due to the species
most commonly used in animal experiments for medical research today. In contrast to human patients, TZDs
including PGZ exacerbate fatty liver in many mouse m odels19–21. A series of studies with mouse models revealed
tissue-specific effects of PPARγ, the canonical target of TZDs, on NAFLD. PPARγ overexpression in the liver
induces hepatic s teatosis22, whereas liver-specific PPARγ disruption prevents fat accumulation in the liver of
mouse models of N AFLD23–25. On the other hand, muscle-specific or adipocyte-specific disruption promotes
26,27
hepatic steatosis . Thus, all these tissues, including the liver, the adipose tissue, and the skeletal muscle, may
be responsible for the different responses to TZDs between mouse and human.
Conversely, it has been reported that TZDs improve fatty liver in rat models as well as in human patients28–30.
However, due to the small number of genetically engineered rats, the tissue-specific effects of PPARγ on NAFLD
have not really been investigated in rat models. Under these circumstances, we have generated disease-model
rats including Lepmkyo/Lepmkyo and seipin knockout (SKO) r ats31–33. Lepmkyo/Lepmkyo rats have a nonsense mutation
in leptin gene and exhibit hyperphagia and obese phenotypes including severe fatty liver31. Seipin is a protein
encoded by BSCL2 gene, whose mutation causes the most severe variety of congenital generalized lipodystrophy
(CGL) in human s ubjects34. CGL is a disease characterized by a near total lack of adipose tissue from b irth35.
CGL patients develop severe insulin resistance, hypertriglyceridemia and fatty liver36. SKO rats have a nonsense
mutation in BSCL2 gene and exhibit phenotypes of CGL including severe insulin resistance, hypertriglyceri-
demia and fatty liver32. As mouse counterparts of Lepmkyo/Lepmkyo and SKO rats, ob/ob and A-ZIP/F-1 mice are
available. ob/ob mice also have a nonsense mutation in leptin gene and exhibit obese phenotypes including
severe fatty liver37. A-ZIP/F-1 mice express adipose-specifically a dominant-negative protein that prevents the
DNA binding of B-ZIP transcription factors including C/EBP and Jun families and exhibit phenotypes of CGL
including severe fatty liver38. In both ob/ob and A-ZIP/F-1 mice, TZDs were shown to aggravate fatty liver20,21.
The presence of mouse and rat models of obesity or lipodystrophy prompted us to explore the mechanism of the
different response to TZDs by species and tissue-specific effects of PPARγ on NAFLD.
In this study, ob/ob or A-ZIP/F-1 mice, and Lepmkyo/Lepmkyo or SKO rats were treated with PGZ or rosiglitazone
(RGZ). RGZ is another TZD available in a clinical setting, although its use is limited due to the risk of cardiovas-
cular events11. After 4 weeks of each treatment, we examined fat accumulation in the liver, white adipose tissue
and skeletal muscle. These tissues have been reported to have a role in PPARγ action22–27. We also examined Pparg
mRNA expression and PPARγ target gene, Fsp27 and Cd36 mRNA expressions as indices of PPARγ activity in
these tissues. The present study revealed not only the cause of the different response to TZDs between mouse
and rat, but also the mechanism by which TZDs attenuate fatty liver in rat. These findings might be helpful for a
better understanding of the action mechanism of TZDs in human and the optimal treatment of TZDs for NAFLD.
Results
Pparg mRNA expressions in fatty livers from mouse and rat models of leptin deficient obesity
and generalized lipodystrophy. To explore the mechanism by which TZDs exert different effects on
fatty liver between mouse and rat, we examined Pparg mRNA expressions in fatty liver models of mouse and rat.
Namely, we used ob/ob mice and Lepmkyo/Lepmkyo rats, which are leptin deficient obese models, and A-ZIP/F-1
mice and seipin KO (SKO) rats, which are models of generalized lipodystrophy. All these four models showed
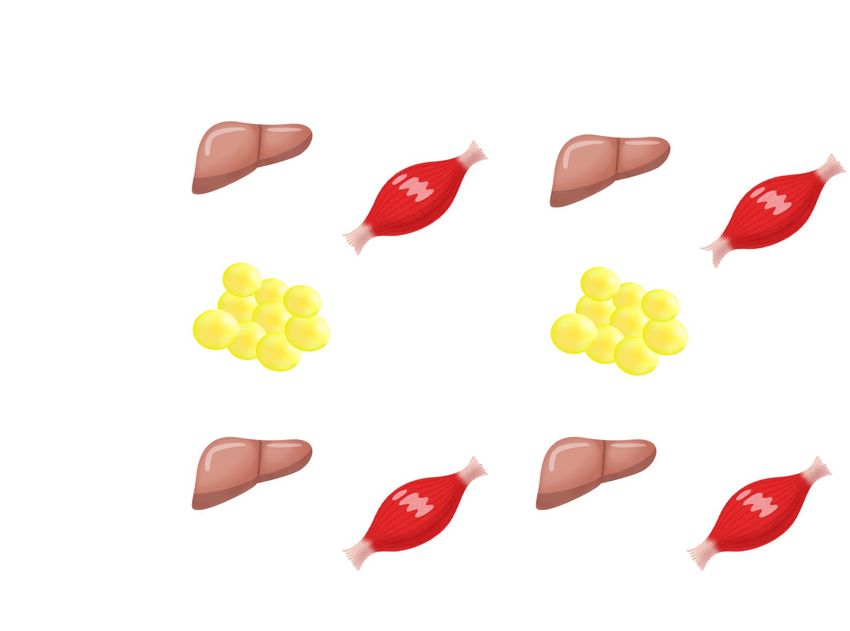
severe fatty liver in a similar manner when compared with each WT control (Fig. 1). Macroscopically, livers were
remarkably enlarged and were lighter in color (Fig. 1A ,B). Histological examination showed large number of
lipid droplets of various sizes (Fig. 1A,B). Consistent with these results, liver weight and liver TG content were
both remarkably increased in all these four models regardless of species (Fig. 1C–F). However, while hepatic
Pparg mRNA expression was upregulated in both ob/ob and A-ZIP/F-1 mice when compared with each WT
control (Fig. 1G), it was kept at low levels in Lepmkyo/Lepmkyo and SKO rats as with the level of their WT control
(Fig. 1H). These results clearly demonstrate that Pparg mRNA expression is differently regulated in fatty livers
between mice and rats.
To confirm these differences in the regulation of PPARγ expression at protein level, we examined PPARγ
protein levels in the liver separately in cytoplasmic and nuclear fractions using western blot analysis. PPARγ
protein levels were remarkably increased in both cytoplasmic and nuclear fractions in ob/ob and A-ZIP/F-1 mice
when compared to each WT control (Supplemental Fig. 1A–C). Interestingly, the ratio of nuclear to cytoplasmic
levels of PPARγ protein was also markedly increased in ob/ob and A-ZIP/F-1 mice (Supplemental Fig. 1D). In
contrast, PPARγ protein expression was detected in neither cytoplasmic nor nuclear fractions in not only WT
rats but also Lepmkyo/Lepmkyo and SKO rats (Supplemental Fig. 1E–G). These results confirmed that PPARγ protein
expression was also differently regulated in fatty livers between mice and rats.
To investigate the mechanism underlying this difference of PPARγ expression, we compared basal Pparg
mRNA expression in WT mice and rats using mean Ct values of real-time PCR. Although they were reference
data as different PCR primer sets were used in mice and rats, while mean Ct values in WAT showed no significant
difference between mice and rats, mean Ct value in the liver in rats was over 15 cycles more than that in mice
(Supplemental Fig. 2A,B). These results indicate that Pparg mRNA expression in the the liver is already remark-
ably different between mice and rats at the basal level.
Effects of TZD treatment on fatty liver in mouse and rat models of leptin deficient obesity and
generalized lipodystrophy. We treated ob/ob and A-ZIP/F-1 mice and Lepmkyo/Lepmkyo and SKO rats with
RGZ or PGZ for 4 weeks. Both RGZ and PGZ showed no effect on food intake in any of the four animal models
when compared to the respective vehicle-treated controls (Supplemental Fig. 3A,B). At this time, RGZ and PGZ
Scientific Reports | (2022) 12:449 | https://doi.org/10.1038/s41598-021-04036-7 2
Vol:.(1234567890)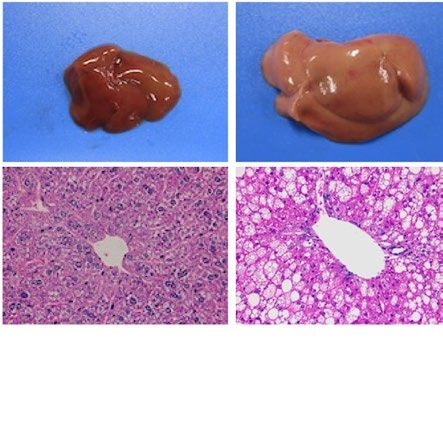
www.nature.com/scientificreports/
A B C 7
6
**
Liver weight (g)
5 **
4
3
2
WT(C57) ob/ob WT(FVB) A-ZIP/F-1 WT Lep mkyo
/Lep mkyo
SKO 1
0
D E F WT ob/ob WT A-ZIP/F-1
** 200 200 **
30 (C57) (FVB)
175
Liver TG content (mg/g)
** 175
Liver TG content (mg/g)
Liver weight (g)
25 **
150 ** ** 150
20 125 125
15 100 100
75 75
10
50 50
5
25 25
0
WT Lep SKO 0 0
mkyo/ WT ob/ob WT A-ZIP/F-1 WT Lepmkyo/ SKO
Lep (C57) (FVB) Lepmkyo
mkyo
G 40 ** H 40
35 ** 35
(fold increase vs WT)
(fold increase vs WT)
30 30
Liver Pparg/18S
Liver Pparg/18S
25 25
20 20
NS
15 15
10 10 NS
5 5
0 0
WT ob/ob WT A-ZIP/F-1 WT Lepmkyo/ SKO
(C57) (FVB) Lepmkyo
Figure 1. Liver phenotype and liver Pparg mRNA expression in mouse and rat models of leptin deficient
obesity and generalized lipodystrophy. (A,B) Macroscopic (top) and histological images (bottom) of the liver,
(C,D) liver weight, (E,F) liver triglyceride content and (G,H) liver Pparg mRNA expression in 16 weeks old
male C57B/6J WT, ob/ob, FVB/N WT and A-ZIP/F-1 mice (A,C,E,G) and F344 WT, Lepmkyo/Lepmkyo and SKO
rats (B,D,F,H). For histological examination, hematoxylin and eosin staining was used. Original magnification
of × 200 is shown. Pparg mRNA expression levels were normalized by 18S. Values are means ± SEM (n = 10 per
group). *P < 0.05, **P < 0.01, NS, not significant (one-way ANOVA followed by Tukey’s test).
similarly increased the size of the liver macroscopically in ob/ob and A-ZIP/F-1 mice (Fig. 2A). Histological
examination also showed that RGZ and PGZ increased the number and size of lipid droplets in the livers of ob/
ob and A-ZIP/F-1 mice (Fig. 2A). Consistent with these results, both RGZ and PGZ significantly increased liver
weight and liver TG content in ob/ob and A-ZIP/F-1 mice (Fig. 2B,C). In contrast to the mouse models, RGZ
and PGZ similarly decreased the size of the liver macroscopically and decreased the number and the size of lipid
droplets in the liver histologically in Lepmkyo/Lepmkyo rats (Fig. 2D). Liver weight and liver TG content were also
significantly decreased by RGZ and PGZ in Lepmkyo/Lepmkyo rats (Fig. 2E,F). On the other hand, neither RGZ nor
PGZ showed any effect on the size of the liver and lipid droplet accumulation in the liver in SKO rats (Fig. 2D).
Consistent with these results, liver weight and liver TG content were also unchanged by both RGZ and PGZ in
SKO rats (Fig. 2E,F). The different effects of TZDs on fatty liver in mice and rats could be explained by the dif-
ferent regulation of Pparg mRNA expression in the liver, but the different effects of TZDs in Lepmkyo/Lepmkyo and
SKO rats could be due to causes other than hepatic PPARγ.
Effects of TZD treatment on WAT weight, muscle TG content and body weight in mouse and
rat models of leptin deficient obesity and generalized lipodystrophy. We next measured epididy-
mal WAT weight after 4 weeks of RGZ or PGZ treatment to investigate the effect of TZDs on TG accumulation
in WAT which is the major expression site of PPARγ. Without TZD treatment, epididymal WAT weight was
markedly increased in ob/ob mice and Lepmkyo/Lepmkyo rats when compared with each WT control (Fig. 3A,B).
Both RGZ and PGZ further increased WAT weight in Lepmkyo/Lepmkyo rats but not in ob/ob mice (Fig. 3A,B).
In A-ZIP/F-1 mice and SKO rats, models of generalized lipodystrophy, the amount of remaining WAT was
marginal and inadequate for analysis and neither RGZ nor PGZ had any significant effect (Fig. 3A,B). We also
measured TG content in gastrocnemius muscle to investigate the effects of TZDs on TG accumulation in the
skeletal muscle. Without TZD treatment, muscle TG content was apparently increased in all four models when
compared to the respective vehicle-treated WT controls (Fig. 3C,D). Both RGZ and PGZ significantly decreased
muscle TG content in ob/ob and A-ZIP/F-1 mice, but not in Lepmkyo/Lepmkyo and SKO rats (Fig. 3C,D). While the
Scientific Reports | (2022) 12:449 | https://doi.org/10.1038/s41598-021-04036-7 3
Vol.:(0123456789)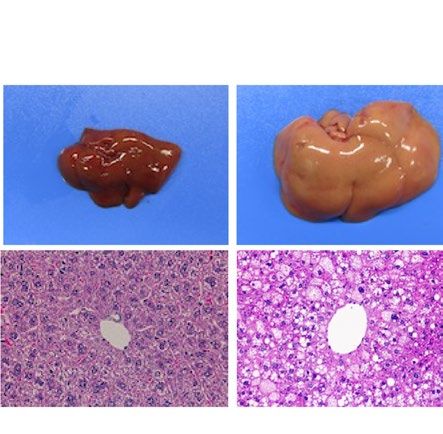
www.nature.com/scientificreports/

                       A                                                                B

                                                                                                     D
                       C

                       E                                                                         F

                                           Figure 2.  Effect of TZD treatment on fatty liver in mouse and rat models of leptin deficient obesity and
                                           generalized lipodystrophy. (A,B) Macroscopic (top) and histological images (bottom) of the liver, (C,D) liver
                                           weight and (E,F) liver triglyceride content in C57B/6J WT, ob/ob, FVB/N WT and A-ZIP/F-1 mice (A,C,E) and
                                           F344 WT, Lepmkyo/Lepmkyo and SKO rats (B,D,F) treated with vehicle, RGZ or PGZ. For histological examination,
                                           hematoxylin and eosin staining was used. Original magnification of × 200 is shown. For liver weight and liver
                                           triglyceride content, values are means ± SEM (n = 10 per group). *P < 0.05, **P < 0.01, NS, not significant (one-
                                           way ANOVA followed by Tukey’s test).

          Scientific Reports |   (2022) 12:449 |               https://doi.org/10.1038/s41598-021-04036-7                                                  4

Vol:.(1234567890)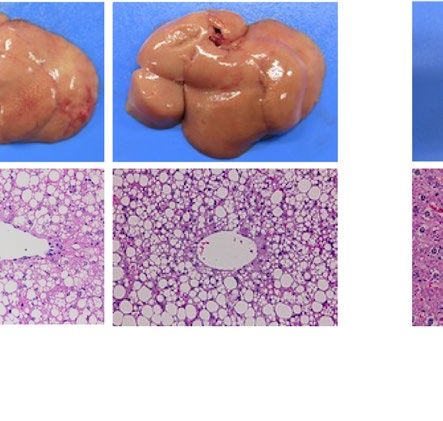
www.nature.com/scientificreports/

           A                                                                       B

           C                                                                        D

             E
                                                                                    F

                                 Figure 3.  Effect of TZD treatment on WAT and skeletal muscle in mouse and rat models of leptin deficient
                                 obesity and generalized lipodystrophy. (A,B) epididymal WAT weight and (C,D) gastrocnemius muscle
                                 triglyceride content in C57B/6J WT, ob/ob, FVB/N WT and A-ZIP/F-1 mice (A,C) and F344 WT, Lepmkyo/
                                 Lepmkyo and SKO rats (B,D) treated with vehicle, RGZ or PGZ. Values are means ± SEM (n = 10 per group).
                                 *P < 0.05, **P < 0.01, NS, not significant (one-way ANOVA followed by Tukey’s test). ND, not determined.

                                 effects of TZDs on liver weight, WAT weight, and muscle TG content were varied by animal models, body weight
                                 was largely unchanged in both RGZ and PGZ in all four models (Fig. 3E,F).

                                 Effects of TZD treatment on glucose metabolism in mouse and rat models of leptin deficient
                                 obesity and generalized lipodystrophy. To evaluate the effects of TZDs on glucose metabolism, we
                                 measured fasting plasma glucose and insulin concentrations after 4 weeks of RGZ or PGZ treatment. Without
                                 TZD treatment, fasting plasma glucose and insulin concentrations were apparently increased in all four models
                                 compared to each WT control (Fig. 4A–D). Therefore, HOMA-IR, an indicator of insulin resistance, was mark-
                                 edly increased in all these four models (Fig. 4E,F). However, RGZ and PGZ effectively decreased fasting plasma
                                 glucose and insulin concentrations and HOMA-IR in three of four models, except SKO rats (Fig. 4A–F). In SKO

Scientific Reports |   (2022) 12:449 |               https://doi.org/10.1038/s41598-021-04036-7                                              5

                                                                                                                                        Vol.:(0123456789)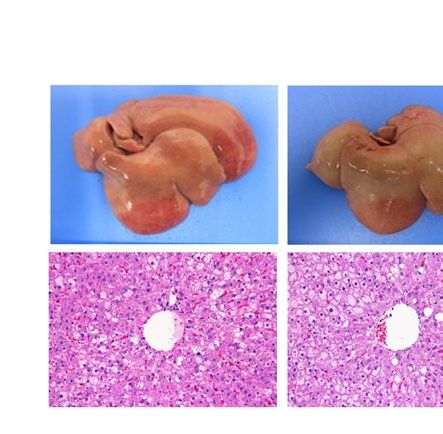
www.nature.com/scientificreports/

                    A                                                                      B

                    C                                                                        D

                      E                                                                        F

                                           Figure 4.  Effect of TZD treatment on glucose metabolism in mouse and rat models of leptin deficient obesity
                                           and generalized lipodystrophy. (A,B) Plasma glucose and (C,D) insulin concentrations in C57B/6J WT, ob/ob,
                                           FVB/N WT and A-ZIP/F-1 mice (A,C) and F344 WT, Lepmkyo/Lepmkyo and SKO rats (B,D) treated with vehicle,
                                           RGZ or PGZ. Values are means ± SEM (n = 10 per group). *P < 0.05, **P < 0.01, NS, not significant (one-way
                                           ANOVA followed by Tukey’s test).

                                           rats, fasting plasma glucose and insulin concentrations and HOMA-IR were almost unchanged by both RGZ
                                           and PGZ.

                                           Effects of TZD treatment on lipid metabolism in mouse and rat models of leptin deficient obe‑
                                           sity and generalized lipodystrophy. The effects of TZDs on lipid metabolism were also examined in our
                                           mouse and rat models. Without TZD treatment, fasting plasma TG, NEFA, and total cholesterol concentrations
                                           were apparently increased in all four models compared to WT controls (Fig. 5A–F). With TZDs treatment, fast-
                                           ing plasma TG concentration was massively decreased in ob/ob mice and moderately decreased in A-ZIP/F-1
                                           mice (Fig. 5A,B). In contrast, TZDs had no effect on fasting plasma TG concentrations in rat models, Lepmkyo/
                                           Lepmkyo and SKO rats (Fig. 5A,B). In obese models, ob/ob mice and Lepmkyo/Lepmkyo rats, TZDs resulted a slight

          Scientific Reports |   (2022) 12:449 |               https://doi.org/10.1038/s41598-021-04036-7                                                 6

Vol:.(1234567890)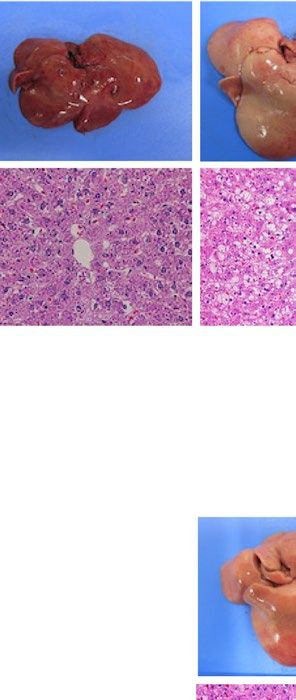
www.nature.com/scientificreports/

         A                                                                         B

          C                                                                            D

           E                                                                         F

                                 Figure 5.  Effect of TZD treatment on lipid metabolism in mouse and rat models of leptin deficient obesity and
                                 generalized lipodystrophy. (A,B) Plasma triglyceride, (C,D) NEFA and (E,F) total cholesterol concentrations
                                 in C57B/6J WT, ob/ob, FVB/N WT and A-ZIP/F-1 mice (A,C,E) and F344 WT, Lepmkyo/Lepmkyo and SKO rats
                                 (B,D,F) treated with vehicle, RGZ or PGZ. Values are means ± SEM (n = 10 per group). *P < 0.05, **P < 0.01, NS,
                                 not significant (one-way ANOVA followed by Tukey’s test).

                                 but significant decrease in fasting plasma NEFA concentrations (Fig. 5C,D). On the other hand, TZDs had no
                                 effect on fasting plasma NEFA concentrations in models of generalized lipodystrophy, A-ZIP/F-1 mice and SKO
                                 rats (Fig. 5C,D). Plasma total cholesterol concentrations were substantially decreased in mouse models by TZDs
                                 while TZDs had no effect on plasma total cholesterol concentrations in rat models (Fig. 5E,F).

                                 Effects of TZD treatment on Pparg and its target genes mRNA expressions in the liver, WAT
                                 and skeletal muscle. To investigate the mechanism underlying the different effect of TZDs among animal
                                 models, we examined mRNA expressions of Pparg and its target genes, Fsp27 and Cd36 in epididymal WAT, liver
                                 and gastrocnemius muscle of our four animal models after 4 weeks of RGZ or PGZ treatment.
                                     Consistent with the baseline results (Fig. 1G,H), hepatic Pparg mRNA expression was very low in vehicle-
                                 treated WT controls irrespective of mice or rats, but markedly increased in vehicle-treated mouse models, ob/

Scientific Reports |   (2022) 12:449 |               https://doi.org/10.1038/s41598-021-04036-7                                                    7

                                                                                                                                          Vol.:(0123456789)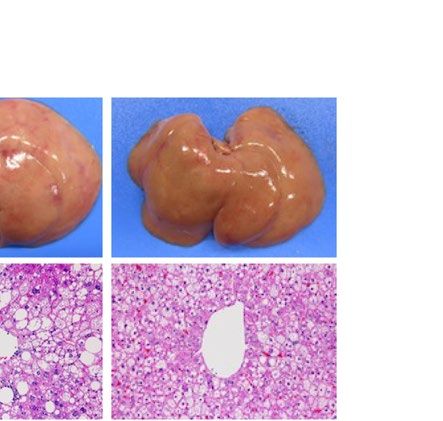
www.nature.com/scientificreports/
ob and A-ZIP/F-1 mice while it was kept at low levels in vehicle-treated rat models, Lepmkyo/Lepmkyo and SKO
rats (Fig. 6A,B). Hepatic Fsp27 and Cd36 mRNA expressions were also very low in vehicle-treated WT controls
irrespective of mice or rats, but were increased in vehicle-treated mouse models while it was kept at low levels in
vehicle-treated rat models (Fig. 6C,D, Supplemental Fig. 4A,B). In mouse models, although both RGZ and PGZ
showed subtle effects on hepatic Pparg mRNA expression itself, its target Fsp27 and Cd36 mRNA expressions
were significantly further increased by both RGZ and PGZ (Fig. 6A,C, Supplemental Fig. 4A). On the other
hand, neither RGZ nor PGZ increased the hepatic Pparg mRNA expression as well as the hepatic Fsp27 and Cd36
mRNA expressions in rat models (Fig. 6B,D, Supplemental Fig. 4B).
In WAT, substantial expression of Pparg mRNA was detected in vehicle-treated WT controls irrespective of
mouse or rat, and was unchanged in both vehicle-treated mouse and rat obese models (Fig. 6A,B). Consistent
with these results, substantial expressions of Fsp27 and Cd36 mRNA were also detected in WAT in both vehicle-
treated WT mouse and rat controls, and was almost unchanged in both vehicle-treated mouse and rat obese
models (Fig. 6C,D, Supplemental Fig. 4A,B). Both RGZ and PGZ showed no significant effect on WAT Pparg
mRNA expression in ob/ob mice, but were significantly increased in Lepmkyo/Lepmkyo rats (Fig. 6A,B). RGZ and
PGZ showed different effects on WAT Pparg mRNA expression in ob/ob mice and Lepmkyo/Lepmkyo rats, but both
effectively increased PPARγ target genes, Fsp27 and Cd36 mRNA expressions in WAT in both mouse and rat
obese models, indicating that TZDs enhanced WAT PPARγ activity similarly in mice and rats (Fig. 6C,D, Sup-
plemental Fig. 4A,B). Since the amount of remaining WAT was marginal and inadequate for analysis, we did
not examine WAT mRNA expressions in A-ZIP/F-1 mice and SKO rats, models of generalized lipodystrophy
(Fig. 6A–D, Supplemental Fig. 4A,B).
In the skeletal muscle, Pparg mRNA expression was basically at low levels in both mice and rats (Fig. 6A,B).
Although muscle Pparg mRNA expression was increased marginally in ob/ob mice and Lepmkyo/Lepmkyo rats, TZDs
showed no significant effect on it (Fig. 6A,B). In accordance with Pparg mRNA expressions, muscle Fsp27 and
Cd36 mRNA expression was also basically at low levels in both mice and rats although TZDs increased it slightly
only in ob/ob mice (Fig. 6C,D, Supplemental Fig. 4A,B).
Discussion
There have been no reports directly comparing hepatic Pparg mRNA expression between mouse and rat so far.
The present study clearly demonstrated the different regulation of hepatic Pparg mRNA expression between
mouse and rat. PPARγ mRNA expression was markedly upregulated in fatty liver of mouse models compared
to WT controls, while it was unchanged in rat models (Fig. 1G,H). We also confirmed that PPARγ expression
is differently regulated at protein level (Supplemental Fig. 1). In this study, we used leptin-deficient obese and
generalized lipodystrophy mice and rats, respectively, as fatty liver models. We confirmed the degree of fat
accumulation in the liver was almost the same in all these four models irrespective of species (Fig. 1E,F). Thus,
the difference in hepatic Pparg mRNA expression between mouse and rat is not due to the differences in fat
accumulation in the liver. Although the molecular mechanism underlying the different regulation of hepatic
Pparg mRNA expression between the two species remains unclear, this difference could explain the different
hepatic responses of PPARγ agonists, TZDs between mouse and rat.
As previously reported20,21, TZDs exacerbated fatty liver in ob/ob and A-ZIP/F-1 mice with upregulated
hepatic Pparg expression (Fig. 2A,C,E). In contrast, TZDs improved fatty liver in leptin-deficient Lepmkyo/Lepmkyo
rats without upregulation of hepatic Pparg expression (Fig. 2B,D,F), as previously reported in leptin receptor-
deficient Zucker fatty r ats29. Surprisingly, TZDs showed completely no effect on fatty liver in SKO rats which
also had no upregulation of hepatic Pparg expression (Fig. 2B,D,F). Since SKO rats have a near total lack of white
adipose tissue32, this result indicate that adipose tissue is necessary for the therapeutic effect of TZDs on fatty
liver in rats. Furthermore, the results also indicate that PPARγ in other tissues, such as liver and skeletal muscle,
are not physiologically significant for the therapeutic effect of TZDs in rats. Therefore, it can be said that TZDs
improved fatty liver in Lepmkyo/Lepmkyo rats mainly through adipose tissue. In both ob/ob and A-ZIP/F-1 mice,
TZDs markedly decreased muscle TG content while significantly increased liver TG content (Fig. 2E and 3C).
Since PPARγ is a transcriptional factor that induces the expression of lipogenic genes, these results indicate that
PPARγ in skeletal muscle is not the major site of actions for TZDs even in mice. Taken together, PPARγ in the
adipose tissue is the exclusive therapeutic target of TZDs in rats, while PPARγ in the liver in addition to that in
the adipose tissue is also a major site of actions for TZDs in mice.
To verify the significance of PPARγ as a therapeutic target of TZDs in each tissue, we examined the expres-
sions of Pparg and its target genes, Fsp27 and Cd36, in the liver, skeletal muscle and adipose tissue. In mice, high
expression of Pparg was detected, and TZDs significantly increased the expressions of Fsp27 and Cd36 in both
liver and adipose tissue (Fig. 6A,C, Supplemental Fig. 4A). In ob/ob mice but not in A-ZIP/F-1 mice, although
the expression of Pparg was slightly but significantly upregulated and TZDs increased the expressions of Fsp27
and Cd36 in skeletal muscle, the increases of these expressions were very small when compared with those in
the liver and adipose tissue (Fig. 6A,C, Supplemental Fig. 4A). On the other hand, the expression of Pparg was
negligible and TZDs had no effect on the expressions of Fsp27 and Cd36 in both liver and skeletal muscle in rat
models (Fig. 6B,D, Supplemental Fig. 4B). The amount of Pparg expression and the transcriptional activity of
PPARγ measured by Fsp27 and Cd36 expressions indicate that PPARγ in adipose tissue is the exclusive therapeu-
tic target of TZDs in rats and that PPARγ in the liver in addition to adipose tissue is also the major site of actions
for TZDs in mice. Moreover, the significance of PPARγ in skeletal muscle is minimal, if any, in both mice and rats.
As mentioned above, the therapeutic target tissues of TZDs are adipose tissue and liver in ob/ob mice, liver
only in A-ZIP/F-1 mice, adipose tissue only in Lepmkyo/Lepmkyo rats, and no tissue in SKO rats (Fig. 7). In the
present study, the insulin sensitizing effect of TZDs was observed in A-ZIP/F-1 fatless mice other than ob/ob
mice and Lepmkyo/Lepmkyo rats (Fig. 4E,F). In the previous report, RGZ showed no insulin sensitizing effect in
Scientific Reports | (2022) 12:449 | https://doi.org/10.1038/s41598-021-04036-7 8
Vol:.(1234567890)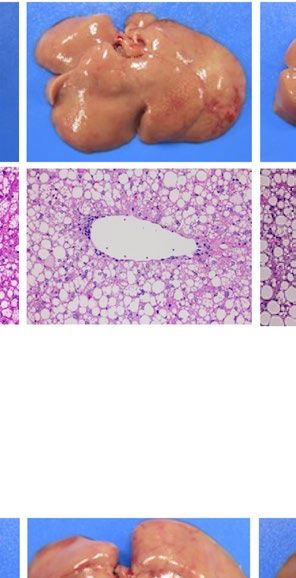
www.nature.com/scientificreports/

                            A

                            B

                            C

                            D

                                 Figure 6.  Effect of TZD treatment on Pparg and Fsp27 mRNA expressions in the liver, WAT and skeletal
                                 muscle in mouse and rat models of leptin deficient obesity and generalized lipodystrophy. (A,B) Pparg mRNA
                                 expressions in the liver, WAT and skeletal muscle in C57B/6J WT, ob/ob, FVB/N WT and A-ZIP/F-1 mice
                                 (A) and F344 WT, Lepmkyo/Lepmkyo and SKO rats (B) treated with vehicle, RGZ or PGZ. (C,D) Fsp27 mRNA
                                 expressions in the liver, WAT and skeletal muscle in C57B/6 J WT, ob/ob, FVB/N WT and A-ZIP/F-1 mice (C)
                                 and F344 WT, Lepmkyo/Lepmkyo and SKO rats (D) treated with vehicle, RGZ or PGZ. mRNA expression levels
                                 were normalized by 18S. Values are means ± SEM (n = 10 per group). ND, not determined. *P < 0.05, **P < 0.01,
                                 NS, not significant (one-way ANOVA followed by Tukey’s test).

Scientific Reports |   (2022) 12:449 |               https://doi.org/10.1038/s41598-021-04036-7                                                  9

                                                                                                                                         Vol.:(0123456789)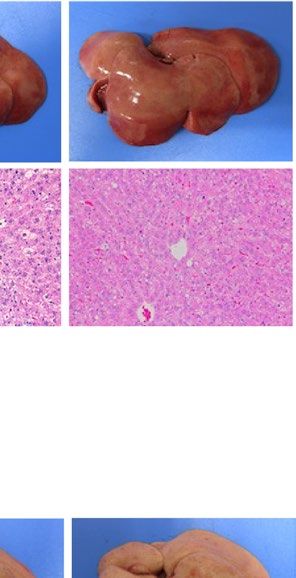
www.nature.com/scientificreports/
Figure 7. Expression sites of physiologically functional PPARg in mouse and rat models of fatty liver. The
therapeutic target tissues of TZDs are adipose tissue and liver in ob/ob mice, liver only in A-ZIP/F-1 mice,
adipose tissue only in Lepmkyo/Lepmkyo rats, and no tissue in SKO rats.
A-ZIP/F-1 mice21. However, the subsequent study demonstrated that RGZ treatment decrease tissue TG content
and improves insulin sensitivity in skeletal muscle while it aggravates fatty liver and insulin resistance in liver in
A-ZIP/F-1 mice39. This means that the degree of insulin sensitizing effect of TZDs in A-ZIP mice is determined
by the balance between the negative effect in the liver and the positive effect in the skeletal muscle. This balance
might be changed by the dose or treatment duration of TZDs. On the other hand, TZDs had no insulin sensitiz-
ing effect in SKO rats, which have no target tissue for TZDs.
As to the lipid metabolism, TZDs also showed no effect in SKO rats, which have no target tissue for TZDs.
In Lepmkyo/Lepmkyo rats which have only adipose tissue as a target for TZDs, plasma NEFA concentration was
slightly decreased by TZDs. In A-ZIP/F-1 mice, which have only the liver as a target for TZDs, plasma TG and
total cholesterol concentrations were significantly decreased by TZDs. In ob/ob mice, which have both adipose
tissue and liver as a target for TZDs, plasma TG, NEFA and total cholesterol concentrations were all significantly
decreased by TZDs. These results indicate that TZDs decrease plasma TG and total cholesterol concentrations
through PPARγ in the liver and mildly decrease plasma NEFA concentrations through PPARγ in adipose tissue.
Conversely, TZDs decrease neither plasma TG nor total cholesterol concentrations without functional PARγ in
the liver and do not decrease plasma NEFA concentrations without adipose tissues.
It has been shown that TZDs improve fatty liver in human patients as well as in rat m odels7–11. On the other
hand, it has been reported that Pparg expression in the liver was upregulated in obese patients with N AFLD40.
Pparg expressions in the liver were comparable to those in the adipose tissue in mouse models but not in rat
models of fatty liver (Fig. 6A,B). However, there was no data on the comparison of Pparg expression between
liver and adipose tissue of human patients. Thus, the pathophysiological significance of PPARγ in the liver of
human patients is still unclear. It has also been reported that in obese NAFLD patients, Pparg expression in the
liver showed a positive association with mRNA expression of sterol regulatory element-binding protein (SREBP)-
1c, one of most important genes for lipogenesis in the liver40. If PPARγ plays an essential role in the induction
of SREBP-1c in the liver, TZD treatment would exacerbate NAFLD in humans. However, the fact is completely
opposite to what expected7–11. Furthermore, there is no clear evidence on the efficacy of TZDs in patients with
generalized lipodystrophy so far. Although we also have some experiences in using PGZ in patients with general-
ized lipodystrophy, its effectiveness was very l imited41,42. These facts indicate that PPARγ in adipose tissue is the
exclusive therapeutic target of TZDs in human patients as well as in rats, and that the significance of PPARγ in
the liver and skeletal muscle is marginal, if any, even in human subjects.
In conclusion, the present study clearly demonstrated the different regulation of hepatic Pparg mRNA expres-
sion between mouse and rat, TZDs on fatty liver between mouse and rat. Although the response to TZDs in
mice is the exact opposite of that in human patients, there have been no reports pointing out problems with
Scientific Reports | (2022) 12:449 | https://doi.org/10.1038/s41598-021-04036-7 10
Vol:.(1234567890)www.nature.com/scientificreports/
TZD researches using mouse models so far. We should be careful to interpret data on effects of TZDs obtained
from mouse models. On the other hand, rat models, which show therapeutic effects of TZDs similar to those in
human patients, can provide numerous useful suggestions on the TZD research.
Methods
Animals. ob/ob mice on C57BL/6J background were purchased from Japan SLC, Inc. (Hamamatsu, Japan).
A-ZIP/F-1 mice on FVB/N background were provided from Diabetes Branch, National Institute of Diabetes and
Digestive and Kidney Diseases38. Lepmkyo/ Lepmkyo rats and SKO rats on F344/NSlc background were generated
previously31,32. Mice and rats were maintained on a 14 h light/10 h dark cycle (lights on 7:00 AM, lights off 9:00
PM) and fed ad libitum standard pellet diet (MF; Oriental Yeast Co., Ltd., Tokyo, Japan).
The study was conducted with approval of Institutional Animal Experiment Committee at Kyoto University.
All animal experiments adhered to the ARRIVE Guidelines, were carried out with the Institutional Regulation
for Animal Experiments at Kyoto University.
TZD treatments. We treated 12-week-old male ob/ob mice, A-ZIP/F-1 mice, Lepmkyo/Lepmkyo rats, SKO rats
and their WT littermates were treated with RGZ (Wako Pure Chemical Industries, Ltd., Osaka, Japan) or PGZ
donated by Takeda Pharmaceutical Co., Ltd. (Osaka Japan) from the age of 12 weeks for 4 weeks. RGZ was dis-
solved in water and administered at doses of 25 mg/kg for mice and 2.5 mg/kg for rats by oral gavage (0.2 ml for
mice and 0.7 ml for rats) once daily. PGZ was dissolved in 0.01% carboxymethyl cellulose (CMC) and admin-
istered at doses of 30 mg/kg for mice and 3 mg/kg for rats by oral gavage (0.2 ml for mice and 0.7 ml for rats)
once daily. For vehicle-control animals, the same amount of water or 0.01% CMC was administered. At the end
of 4-week treatment, livers, epididymal fats, gastrocnemius muscles and blood were sampled after 4-h fasting.
Liver histology. Livers were sampled at the end of the experiment, fixed in 10% neutrally buffered formalin
and subsequently embedded in paraffin. Histological sections of 5 µm thickness were stained with hematoxylin
and eosin, and examined by light microscopy.
Measurement of triglyceride content in the liver and gastrocnemius muscle. Livers and gas-
trocnemius muscles were sampled at the end of the experiment and were immediately frozen in liquid nitrogen.
Lipids were extracted with isopropyl alcohol/heptane (1:1 vol./vol.). After evaporating the solvent, lipids were
resuspended in 99.5% (vol./vol.) ethanol and triglyceride content was measured by an enzymatic kit (Wako Pure
Chemical Industries, Ltd.).
Biochemical assays. Blood was obtained from the inferior vena cava for mice and from tail vein for rats.
Plasma glucose, triglyceride, non-esterified fatty acid (NEFA) and total cholesterol concentrations were meas-
ured by enzymatic kits (Wako Pure Chemical Industries, Ltd.). Plasma insulin concentrations were measured by
an insulin-ELISA kit (Morinaga Institute of Biological Science, Inc., Yokohama Japan).
Real‑time quantitative RT‑PCR. After sampling, livers, gastrocnemius muscles, and white adipose tis-
sues were immediately frozen in liquid nitrogen and stored at – 80 °C until use for RNA isolation. RNA was
prepared using Trizol (Thermo Fisher Scientific, Waltham, MA) reagent following the supplier’s protocol. The
Quality and the concentrations of the extracted RNA were checked using the Nano-Drop 2000 (Thermo Fisher
Scientific). Single-stranded cDNA was synthesized from 1 µg of total RNA using SuperScript III First-Strand
Synthesis System for RT-PCR, according to the manufacturer’s instructions (Thermo Fisher Scientific). Quanti-
tative RT-PCR was performed with TaqMan (Applied Biosystems, Carlsbad, CA) for housekeeping rat or mouse
mitochondrial subunit 18S rRNA and rat or mouse Pparg and Cd36, and with SYBR Green (Applied Biosys-
tems) for rat or mouse Fsp27 by Applied Biosystems StepOnePlus™ RT-PCR System. The sequences of primers
and probe used in the present study are as follows: rat 18 s forward; 5′-GCAATTATTCCCCATGAACGA-3′,
rat 18 s reverse; 5′-CAAAGGGCAGGGACTTAATCAAC-3′, probe; 5′-AATTCCCAGTAAGTGCGGGTCATA
AGCTTG-3′, mouse 18 s forward; 5′-CGCGCAAATTACCCACTCCCGA-3′, mouse 18 s reverse; 5′-CGGCTA
CCACATCCAAGGA-3′, probe; 5′-CCAATTACAGGGCCTCGAAA-3′, rat Pparγ forward; 5′-CCTGCGGAA
GCCCTTTGGTGACT-3′, rat Pparγ reverse; 5′-TGACCAGGGAGTTCCTCAAAA-3′, probe; 5′-AGCAAACTC
AAACTTAGGCTCCAT-3′, mouse PPARγ forward; 5′-CTTCCATCACGGAGAGGTCCACAGAGC-3′, mouse
Pparγ reverse; 5′-AGAGCATGGTGCCTTCGC-3′, probe; 5′-ATGTCAAAGGAATGCGAGTGG-3′, rat Fsp27
forward; 5′-GTCTCTCAGCCTTCTCTACCC-3′, rat Fsp27 reverse; 5′- CTTGCGCTGTTCTGATGGGG-3′,
mouse Fsp27 forward; 5′- CAGGCATGTGGCAGTGAGCACGG-3′, mouse Fsp27 reverse; 5′- GTTGGCTTC
TGGGAAAGGGC-3′. For rat or mouse Cd36, the following Assay-on-demand primer/probe sets were used: rat
Cd36; Rn02115446_s1, mouse Cd36; Mm00432403_m1 (Applied Biosystems).
Western blot analysis. Livers were homogenized and lysed in a solution containing 20 mM Tris (pH
7.5) 150 mM NaCl, 1 mM EDTA, 1 mM EGTA, 1% Triton X-100, 2.5 mM sodium pyrophosphate and 1 mM
sodium orthovanadate. Subcellular fractions were obtained using Subcellular Protein Fractionation Kit for Tis-
sues (Thermo Fisher Scientific). Samples were separated by SDS-PAGE using 4–12% BisTris gel (Bio-Rad) and
transferred to PVDF membrane (Bio-Rad). Membranes were immunoblotted with each antibody. Amersham
ECL prime (GE Healthcare Life Sciences, Pittsburgh, PA) and ImageQuant LAS 4000mini (GE Healthcare Life
Sciences) were used for the detection and the quantification. Antibodies used in the present study are as follows:
PPARγ (81B8); Cell Signaling Technology, Boston, MA), β-actin (3700; Cell Signaling Technology).
Scientific Reports | (2022) 12:449 | https://doi.org/10.1038/s41598-021-04036-7 11
Vol.:(0123456789)www.nature.com/scientificreports/
Statistical analysis. The data were analysed using SPSS software version 20.00 (SPSS Inc. Chicago, IL,
USA). Data are expressed as means ± SEM. Statistical significance was assessed by one-way ANOVA followed by
Tukey’s test. P < 0.05 was considered statistically significant.
Received: 11 August 2021; Accepted: 30 November 2021
References
1. Third report of the National Cholesterol Education Program (NCEP) expert panel on detection, evaluation, and treatment of high
blood cholesterol in adults (Adult Treatment Panel III). Final Report. Circulation 106, 3143–3421 (2002).
2. Hamaguchi, M. et al. The metabolic syndrome as a predictor of nonalcoholic fatty liver disease. Ann. Intern. Med. 143, 722–728
(2005).
3. Rector, R. S., Thyfault, J. P., Wei, Y. & Ibdah, J. A. Non-alcoholic fatty liver disease and the metabolic syndrome: an update. World
J. Gastroenterol. 14, 185–192 (2008).
4. Tsochatzis, E. et al. Metabolic syndrome is associated with severe fibrosis in chronic viral hepatitis and non-alcoholic steatohepatitis.
Aliment. Pharmacol. Ther. 27, 80–89 (2008).
5. Younossi, Z. M. et al. Current and future therapeutic regimens for nonalcoholic fatty liver disease and nonalcoholic steatohepatitis.
Hepatology 68, 361–371 (2018).
6. Cicero, A. F. G., Colletti, A. & Bellentani, S. Nutraceutical approach to nonalcoholic fatty liver disease (NAFLD): The available
clinical evidence. Nutrients 10, 1153 (2018).
7. Belfort, R. et al. A placebo-controlled trial of pioglitazone in subjects with nonalcoholic steatohepatitis. N. Engl. J. Med. 355,
2297–2307 (2006).
8. Aithal, G. P. et al. Randomized, placebo-controlled trial of pioglitazone in nondiabetic subjects with nonalcoholic steatohepatitis.
Gastroenterology 135, 1176–1184 (2008).
9. Sanyal, A. J. et al. Pioglitazone, vitamin E, or placebo for nonalcoholic steatohepatitis. N. Engl. J. Med. 362, 1675–1685 (2010).
10. Cusi, K. et al. Long-term pioglitazone treatment for patients with nonalcoholic steatohepatitis and prediabetes or type 2 diabetes
mellitus a randomized trial. Ann. Intern. Med. 165, 305–315 (2016).
11. Mahjoubin-Tehran, M. et al. Non-alcoholic fatty liver disease and steatohepatitis: State of the art on effective therapeutics based
on the gold standard method for diagnosis. Mol. Metab. 13, 101049 (2020).
12. Forman, B. M. et al. 15-Deoxy-delta 12, 14-prostaglandin J2 is a ligand for the adipocyte determination factor PPAR gamma. Cell
83, 803–812 (1995).
13. Schoonjans, K., Martin, G., Staels, B. & Auwerx, J. Peroxisome proliferator-activated receptors, orphans with ligands and functions.
Curr. Opin. Lipidol. 8, 159–166 (1997).
14. Hofmann, C. A. & Colca, J. R. New oral thiazolidinedione antidiabetic agents act as insulin sensitizers. Diabetes Care 15, 1075–1078
(1992).
15. Choudhury, J. & Sanyal, A. J. Insulin resistance and pathogenesis of nonalcoholic fatty liver disease. Clin. Liver Dis. 8, 579–594
(2004).
16. Utzchneider, K. M. & Kahn, S. E. The role of insulin resistance in nonalcoholic fatty liver disease. J. Clin. Endocrinol. Metab. 91,
4753–4761 (2006).
17. Musso, G., Gambino, R., Cassader, M. & Pagano, G. A meta-analysis of randomized trials for the treatment of nonalcoholic fatty
liver disease. Hepatology 52, 79–104 (2010).
18. Li, Y., Liu, L., Wang, B., Wang, J. & Chen, D. Metformin in non-alcoholic fatty liver disease: A systematic review and meta-analysis.
Biomed. Rep. 1, 57–64 (2013).
19. Kulkarni S, Huang J, Tycksen E, Cliften PF, Rudnick DA. Diet modifies pioglitazone’s influence on hepatic PPAR γ-regulated
mitochondrial gene expression. PPAR Res. 2020, 3817573. https://doi.org/10.1155/2020/3817573 (2020).
20. Memon, R. A. et al. Up-regulation of peroxisome proliferator-activated receptors (PPAR-alpha) and PPAR-gamma messenger
ribonucleic acid expression in the liver in murine obesity: Troglitazone induces expression of PPAR-gamma-responsive adipose
tissue-specific genes in the liver of obese diabetic mice. Endocrinology 141, 4021–4031 (2000).
21. Chao, L. et al. Adipose tissue is required for the antidiabetic, but not for the hypolipidemic, effect of thiazolidinediones. J. Clin.
Invest. 106, 1221–1228 (2000).
22. Yu, S. et al. Adipocyte-specific gene expression and adipogenic steatosis in the mouse liver due to peroxisome proliferator-activated
receptor gamma1 (PPARgamma1) overexpression. J. Biol. Chem. 278, 498–505 (2003).
23. Moran-Salvador, E. et al. Role for PPARγ in obesity-induced hepatic steatosis as determined by hepatocyte- and macrophage-
specific conditional knockouts. FASEB J. 25, 2538–2550 (2011).
24. Matsusue, K. et al. Liver-specific disruption of PPARgamma in leptin-deficient mice improves fatty liver but aggravates diabetic
phenotypes. J. Clin. Invest. 111, 737–747 (2003).
25. Gavrilova, O. et al. Liver peroxisome proliferator-activated receptor gamma contributes to hepatic steatosis, triglyceride clearance,
and regulation of body fat mass. J. Biol. Chem. 278, 34268–34276 (2003).
26. Hevener, A. L. et al. Muscle-specific Pparg deletion causes insulin resistance. Nat. Med. 9(12), 1491–1497 (2003).
27. He, W. et al. Adipose-specific peroxisome proliferator-activated receptor gamma knockout causes insulin resistance in fat and liver
but not in muscle. Proc. Natl. Acad. Sci. U. S. A. 100, 15712–15717 (2011).
28. Jia, D. M., Tabaru, A., Akiyama, T., Abe, S. & Otsuki, M. Troglitazone prevents fatty changes of the liver in obese diabetic rats. J.
Gastroenterol. Hepatol. 15, 1183–1191 (2000).
29. Hockings, P. D. et al. Rapid reversal of hepatic steatosis, and reduction of muscle triglyceride, by rosiglitazone: MRI/S studies in
Zucker fatty rats. Diabetes Obes. Metab. 5, 234–243 (2003).
30. Yang, H. et al. Metabolomic and lipidomic analysis of the effect of pioglitazone on hepatic steatosis in a rat model of obese Type
2 diabetes. Br. J. Pharmacol. 175, 3610–3625 (2018).
31. Aizawa-Abe, M. et al. Generation of leptin-deficient Lepmkyo/Lepmkyo rats and identification of leptin-responsive genes in the
liver. Physiol. Genom. 45, 786–793 (2013).
32. Ebihara, C. et al. Seipin is necessary for normal brain development and spermatogenesis in addition to adipogenesis. Hum. Mol.
Genet. 24, 4238–4249 (2015).
33. Gumbilai, V. et al. Fat mass reduction with adipocyte hypertrophy and insulin resistance in heterozygous PPARγ mutant rats.
Diabetes 65, 2954–2965 (2016).
34. Magré, J. et al. Identification of the gene altered in Berardinelli-Seip congenital lipodystrophy on chromosome 11q13. Nat. Genet.
28, 365–370 (2001).
35. Capeau, J. et al. Human lipodystrophies: Genetic and acquired diseases of adipose tissue. Endocr. Dev. 19, 1–20 (2010).
Scientific Reports | (2022) 12:449 | https://doi.org/10.1038/s41598-021-04036-7 12
Vol:.(1234567890)www.nature.com/scientificreports/
36. Garg, A. Lipodystrophies: Genetic and acquired body fat disorders. J. Clin. Endocrinol. Metab. 96, 3313–3325 (2011).
37. Zhang, Y. et al. Positional cloning of the mouse obese gene and its human homologue. Nature 372, 425–432 (1994).
38. Moitra, J. et al. Life without white fat: A transgenic mouse. Genes Dev. 12, 3168–3181 (1998).
39. Kim, J. K. et al. Differential effects of rosiglitazone on skeletal muscle and liver insulin resistance in A-ZIP/F-1 fatless mice. Diabetes
52, 1311–1318 (2003).
40. Pettinelli, P. & Videla, L. A. Up-regulation of PPAR-gamma mRNA expression in the liver of obese patients: An additional reinforc-
ing lipogenic mechanism to SREBP-1c induction. J. Clin. Endocrinol. Metab. 96, 1424–1430 (2011).
41. Ebihara, K., Masuzaki, H. & Nakao, K. Long-term leptin-replacement therapy for lipoatrophic diabetes. N. Engl. J. Med. 351,
615–616 (2004).
42. Ebihara, K. et al. Efficacy and safety of leptin-replacement therapy and possible mechanisms of leptin actions in patients with
generalized lipodystrophy. J. Clin. Endocrinol. Metab. 92, 532–541 (2007).
Author contributions
C.E., M.A.A, and K.E. designed research; C.E., V.G., and M.Z. performed research; C.E., M.A.A., M.Z., V.G., and
K.E. analyzed data; C.E., and K.E. wrote the paper; All authors reviewed and approved the manuscript.
Funding
This work was supported by research grant from the Japanese Ministry of Education, Culture, Sports, Science
and Technology.
Competing interests
The authors declare no competing interests.
Additional information
Supplementary Information The online version contains supplementary material available at https://doi.org/
10.1038/s41598-021-04036-7.
Correspondence and requests for materials should be addressed to K.E.
Reprints and permissions information is available at www.nature.com/reprints.
Publisher’s note Springer Nature remains neutral with regard to jurisdictional claims in published maps and
institutional affiliations.
Open Access This article is licensed under a Creative Commons Attribution 4.0 International
License, which permits use, sharing, adaptation, distribution and reproduction in any medium or
format, as long as you give appropriate credit to the original author(s) and the source, provide a link to the
Creative Commons licence, and indicate if changes were made. The images or other third party material in this
article are included in the article’s Creative Commons licence, unless indicated otherwise in a credit line to the
material. If material is not included in the article’s Creative Commons licence and your intended use is not
permitted by statutory regulation or exceeds the permitted use, you will need to obtain permission directly from
the copyright holder. To view a copy of this licence, visit http://creativecommons.org/licenses/by/4.0/.
© The Author(s) 2022
Scientific Reports | (2022) 12:449 | https://doi.org/10.1038/s41598-021-04036-7 13
Vol.:(0123456789)You can also read