Diffraction-limited integral-field spectroscopy for extreme adaptive optics systems with the Multi-Core fiber-fed Integral-Field Unit
←
→
Page content transcription
If your browser does not render page correctly, please read the page content below
Diffraction-limited integral-field spectroscopy for extreme adaptive
                                              optics systems with the Multi-Core fiber-fed Integral-Field Unit

                                              Sebastiaan Y. Hafferta,b,* , Robert J. Harrisc,l , Alessio Zanuttad , Fraser A. Pikee , Andrea
                                              Biancod , Eduardo Redaellid , Aurélien Benoı̂te , David G. MacLachlane , Calum A. Rosse ,
                                              Itandehui Gris-Sánchezf,m , Mareike D. Trappeng,h , Yilin Xug,h , Matthias Blaicherg,h , Pascal
                                              Maierg,h , Giulio Rivad , Baptiste Sinquini , Caroline Kulcsári , Nazim Ali Bharmalj , Eric
                                              Gendronk , Lazar Staykovj , Tim J. Morrisj , Santiago Barbozal , Norbert Muenchl , Lisa
                                              Bardouj , Léonard Prengèrei , Henri-François Raynaudi , Phillip Hottingerc , Theodoros
arXiv:2009.03529v1 [astro-ph.IM] 8 Sep 2020

                                              Anagnosc,n , James Osbornj , Christian Koosg,h , Robert R. Thomsone , Tim A. Birksf , Ignas A.
                                              G. Snellena , Christoph U. Kellera
                                              a
                                                 Leiden Observatory, Leiden University, PO Box 9513, Niels Bohrweg 2, 2300 RA Leiden, The Netherlands
                                              b
                                                Steward Observatory, Unversity of Arizona, 933 North Cherry Avenue, Tucson, Arizona
                                              c
                                                Zentrum für Astronomie der Universität Heidelberg, Landessternwarte Königstuhl, Königstuhl 12, 69117 Heidelberg
                                              d
                                                INAF - Osservatorio Astronomico di Brera, via E. Bianchi 46, 23807 Merate (LC), Italy
                                              e
                                                SUPA, Institute of Photonics and Quantum Sciences, Heriot-Watt University, Edinburgh EH14 4AS, UK
                                              f
                                                Department of Physics, University of Bath, Claverton Down, Bath BA2 7AY, UK
                                              g
                                                Institute of Microstructure Technology (IMT), Karlsruhe Institute of Technology (KIT),
                                              Hermann-von-Helmholtz-Platz 1, 76344 Eggenstein-Leopoldshafen, Germany
                                              h
                                                Institute of Photonics and Quantum Electronics (IPQ), Karlsruhe Institute of Technology (KIT), Engesserstr. 5,
                                              76131 Karlsruhe, Germany
                                              i
                                                Université Paris-Saclay, Institut d’Optique Graduate School, CNRS, Laboratoire Charles Fabry, Palaiseau, France
                                              j
                                                Department of Physics, Durham University, South Road, Durham, DH1 3LE, UK
                                              k
                                                LESIA, Observatoire de Paris, Université PSL, CNRS, Sorbonne Université, Université de Paris, 5 place Jules
                                              Janssen, 92195 Meudon, France
                                              l
                                                Max-Planck-Institute for Astronomy, Königstuhl 17, 69117 Heidelberg, Germany
                                              m
                                                 ITEAM Research Institute, Universitat Politècnica de València, Valencia, 46022, Spain
                                              n
                                                MQ Photonics Research Centre, Department of Physics and Astronomy, Macquarie University, NSW 2109,
                                              Australia

                                              Abstract. Direct imaging instruments have the spatial resolution to resolve exoplanets from their host star. This
                                              enables direct characterization of the exoplanets atmosphere, but most direct imaging instruments do not have spec-
                                              trographs with high enough resolving power for detailed atmospheric characterization. We investigate the use of a
                                              single-mode diffraction-limited integral-field unit that is compact and easy to integrate into current and future direct
                                              imaging instruments for exoplanet characterization. This achieved by making use of recent progress in photonic man-
                                              ufacturing to create a single-mode fiber-fed image reformatter. The fiber-link is created with 3D printed lenses on top
                                              of a single-mode multi-core fiber that feeds an ultrafast laser inscribed photonic chip that reformats the fiber into a
                                              pseudo-slit. We then couple it to a first-order spectrograph with a triple stacked volume phase holographic grating for
                                              a high efficiency over a large bandwidth. The prototype system has had a successful first-light observing run at the
                                              4.2 meter William Herschel Telescope. The measured on-sky resolving power is between 2500 and 3000, depending
                                              on the wavelength. With our observations we show that single-mode integral-field spectroscopy is a viable option for
                                              current and future exoplanet imaging instruments.

                                              Keywords: astrophotonics, integral-field spectroscopy, exoplanets, adaptive optics.

                                              *NASA Hubble Fellow S. Y. Haffert, shaffert@email.arizona.edu

                                                                                                         1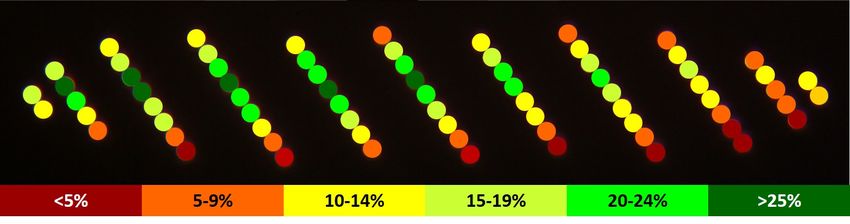
1 Introduction

Exoplanet characterization often makes use of spatially unresolved spectroscopy of transiting plan-

ets. During the transit, light from the host star passes through the planet’s atmosphere and leaves

imprints in the starlight, which can then be analyzed to characterize the planet. This has lead to

remarkable characterization of a wide variety of exoplanets.1–3 The same technique has been ap-

plied to measure the direct emission from the planet, either thermal emission or optical reflected

starlight, itself instead of the indirect signatures in the starlight.4–6 These are very challenging

observations, but they are within the current limits of technology for hot Jupiters. The main limit-

ing factor for the detection of fainter exoplanets in unresolved spectroscopy is the overwhelming

amount of starlight contaminating the planet signal, which has to be removed in post-processing

by complex time-series filtering algorithms.

   Direct imaging instruments, such as SPHERE,7 GPI8 or SCExAO,9 are built to spatially re-

solve planets on large enough orbit from their host stars and often employ extreme adaptive op-

tics (ExAO) systems and advanced coronagraphs. By employing ExAO the influence of the star is

greatly reduced by spatially resolving the planet, allowing for easier characterization of the planet.

The coronagraph is then used in conjunction with an ExAO system to suppress the starlight, to

enhance the contrast between the star and planet even further. After employing all these optical

techniques, there is still residual starlight that leaks through the system due to imperfect adaptive

optics (AO) correction and residual phase aberrations that creates speckles which can appear as

planets. Image processing techniques are necessary to remove these residual speckles to recover

the planet signal.

   While several giant planets have been directly imaged and spectroscopically characterized10–13

                                                  2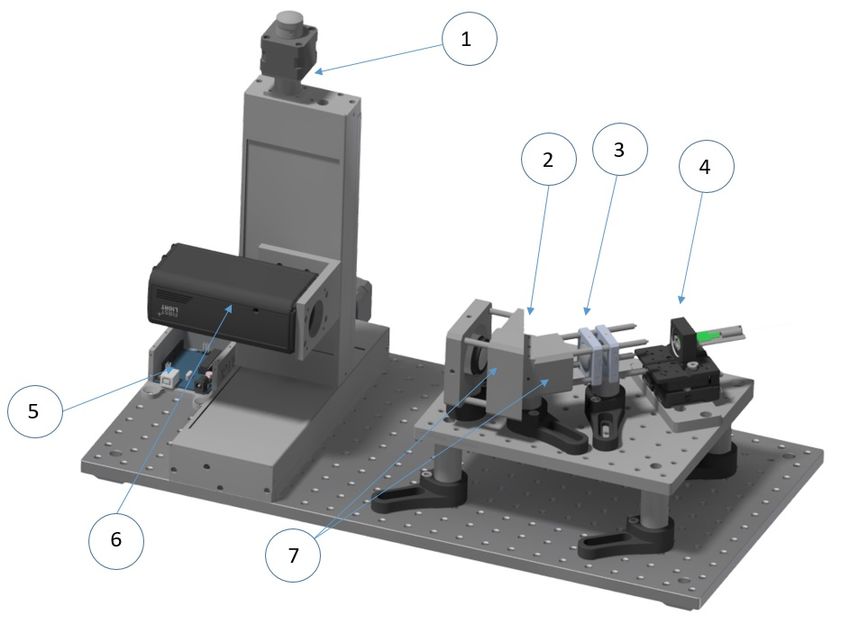
the number of directly imaged planets have been limited so far. The current generation of high-

contrast imagers are sensitive to the small population of young self-luminous exoplanets on wide

orbits.14, 15 More planets could be directly imaged if the sensitivity close to the star is improved.

Most of the current direct imaging instruments are limited at angular separations smaller than

10λ/D ( 0.4” at the VLT in H-band)16 by quasi-static-speckles, which are slowly evolving speckles.

Post-processing algorithms that depend on spatial diversity, such as Angular Differential Imaging

(ADI),17 are not able to remove the quasi-static speckles (QSS) due to the limited spatial diversity

at small angles.

   The combination of high-contrast imaging with high-resolution spectroscopy can resolve the

issues that both techniques face. The effective resolving power on which the quasi-static speck-

les change is mainly dominated by the scaling of the PSF with wavelength. This occurs on a

resolving power of RQS S = ∆θ/(λ/D), with ∆θ the angular separation, λ the central wavelength

of observation and D the telescope diameter.18 Observing speckles at 1 arcsecond with an 8-meter

telescope requires a resolving power RQS S ≈ 40. High-resolution spectroscopy can remove the

QSS efficiently if the spectral features of interest are narrower than the width corresponding to the

effective resolution of the QSS. This usually holds for atomic and molecular spectral lines, which

have an intrinsic resolving power between 100,000 and 200,000. Because these features are so

narrow, most spectrographs dilute them to the spectrographs intrinsic resolving power. This sets

the requirement that the spectrographs resolving power needs to much larger than the effective re-

solving power of the speckles R  RQS S , which happens roughly around R ≈ 1000 and anything

above this resolving power is what we consider high-resolution spectroscopy in this work. The

combination of high-contrast imaging and high-resolution spectroscopy has been proposed several

times already,19–23 and only recently projects started to add this capability to high-contrast imaging

                                                  3
instruments.24–26

   While the high-contrast imaging instruments are lacking high-spectral resolution capabilities,

there are several AO-fed medium to high-resolution spectrographs (MUSE, SINFONI, OSIRIS,

CRIRES). These instruments have been successfully used in the past years to characterize exo-

planet atmospheres. The infrared observations of β Pictoris b27, 28 and HR879929–32 were used to

detect the presence of several molecules, including water. Due to the high resolving power of

CRIRES27 were even able to detect a rotational broadening of β Pictoris b. In the visible part of

the spectrum MUSE was used to characterize the Hα emission of the proto-planet PDS70 b,12, 13, 33

and due to the high-sensitivity a second planet was found in the system.34 The success of these

observations show that it will be worthwhile to add higher resolution integral-field spectroscopy to

the current and next generation of high-contrast imagers.

   In this work we take advantage of several astrophotonics technologies developed in recent

years35–37 to create a large core count single-mode photonic reformatter. With additive manufac-

turing38 a microlens array (MLA) is 3D printed on top of the fiber face37 to efficiently feed the

individual cores. An integrated photonic chip is used to rearrange the two-dimensional geome-

try of the multi-core fiber output into a pseudo-slit that can be dispersed.39 Because the fiber is

single-moded, the spectrograph back end can be kept small. The proposed fiber link can be easily

used to add higher resolution spectroscopic capabilities to current generation ExAO systems as an

upgrade.40

   The spectrograph in this work uses a multi-core fiber (MCF) with 73 cores and has a bandwidth

ranging from 1–1.6 µm which was set by the properties of the available fiber (lower wavelength

limit) and the available detector (upper wavelength limit). This spectral range contains interesting

spectral features from molecules such as methane, carbon-monoxide and water and accretion-

                                                 4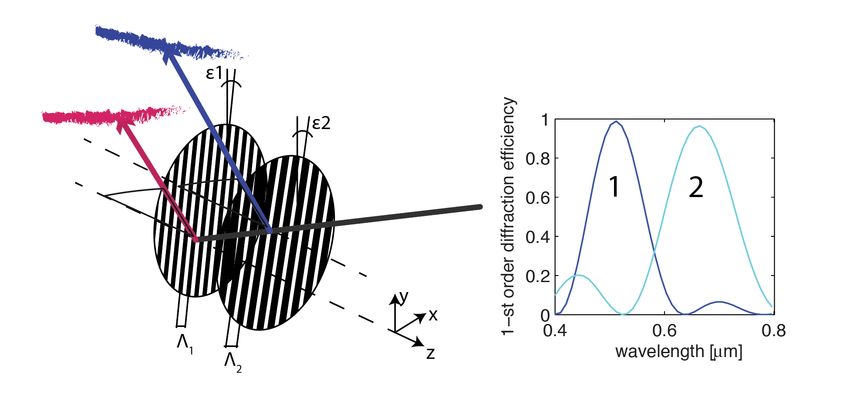
driven emission lines from hydrogen and helium. The dispersing element of the multi-core fiber-

fed integral field unit (MCIFU) is a custom triple stacked Volume Phase Holographic Grating

(VPHG) that disperses the light into three orders with higher efficiency compared to conventional

transmission gratings.41 A schematic of the spectrograph can be seen in Figure 1. The prototype

MCIFU was designed and built during the first half of 2019 and had its first light at the 4.2 meter

William Herschel Telescope (WHT) on La Palma behind the CANARY AO system42 in July 2019.

   In Section 2 we give a short overview of different image reformatting methods and discuss

their advantages and disadvantages for high-contrast imaging. In 3 we describe the design, man-

ufacturing and characterisation of the novel fiber link, which includes the 3D nano printed MLA,

the integrated photonic chip and the fiber protection packaging. Section 4 describes the design and

manufacturing of the custom VPHG, followed by the opto-mechanical design and characterisa-

tion of the spectrograph with the VPHG in Section 5. Section 6 shows the first light results that

were achieved with CANARY at the WHT. In Section 7 we discuss how to improve the current

instrument for future use, after which the paper is summarized and concluded in Section 8.

2 Comparison of image reformatter concepts for high-contrast imaging

An image reformatter is an optical component that rearranges an input focal plane into something

that can be dispersed by a spectograph without losing spatial information. There are several options

to achieve this; image slicers, micro-lenses or fiber-fed spectrographs.

2.1 Image slicers

An image slicer uses several reflective elements to reformat the field into a series of mini-slits. The

image slicer creates the most efficient packing onto the detector, allowing for the most information

                                                  5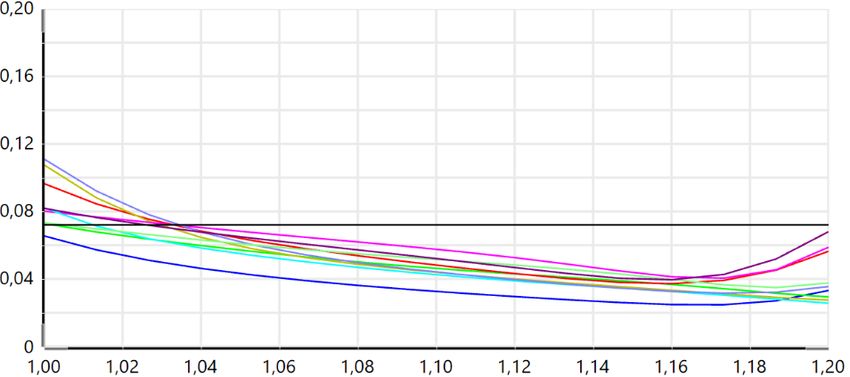
Camera

                     Photonic reformatter to
                    reformat to a pseudo-slit

                                                                           Multiplexed VPH
                  Multi-core fiber with 3D                                      grating
                   printed microlenses.

                      AO corrected beam
                      from the telescope
Fig 1 An overview of the multi-core integral field unit (MCIFU). The telescope beam is imaged onto a microlens
array that is written on top of a multi-core fiber. The output of the multi-core fiber is rearanged into a pseudo-slit by
the photonic reformatter to make it dispersable. And finally a triple multiplexed grating is used to disperse a broad
wavelength range into three orders at a resolving power higher than R = 5000. The spectrograph itself is used in a
first-order manner, where a lens is used to collimate the light onto a grating and a second lens is used to image the
spectrograph focal plane.

                                                           6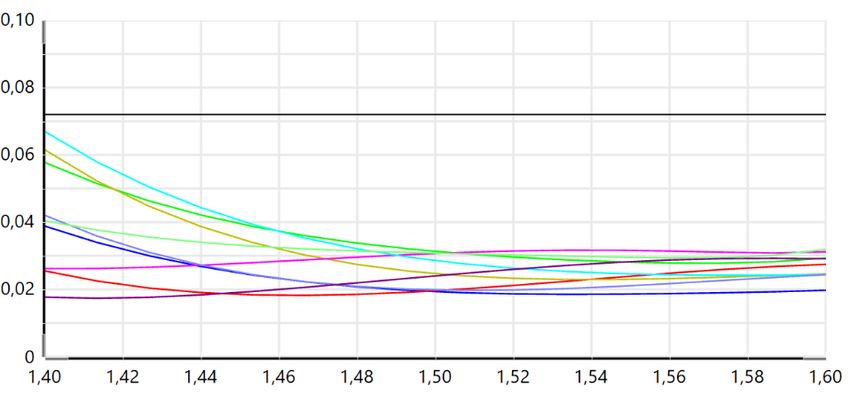
to be recorded out of all techniques. But image slicers suffer from spatial-spectral cross-talk be-

cause adjacent spatial pixels along each slit are not separated on the detector. Another down-side

is that the shape of the line spread function (LSF) changes depending on the the mini-slit illumi-

nation, which can occur for example due a slight tip or tilt of the input beam.43 If high resolution

spectroscopy (HRS) is needed to gain a large amount of contrast in post-processing to character-

ize planets, it is necessary to have a stable LSF because the HRS technique effectively searches

for LSF variations across the field. If the contrast ratio that has to be bridged with respect to the

local stellar halo is not very large (101 − 103 ), image slicers may be a good choice as previous

observations have shown.34, 44

2.2 Micro-lens arrays

MLA based Integral Field Units (IFUs) use a micro-lens array in the focal plane to sample the

field. The MLA based IFU is the current choice for spectroscopy on ExAO systems7, 45, 46 and is

even the standard observing mode for GPI.8 A MLA IFU is easy to implement and is efficient

when few spectral samples are required for large fields.18 Another added benefit is that there are

several ways to reduce cross-talk between spatial-pixels by adding pinhole masks behind the MLA

or aperture masks inside the spectrograph.18 The reduced cross-talk allows the MLA based IFUs

to reach very deep contrast ratios of 104 − 106 .7, 47 The drawback of the MLA IFUs is that it is

not possible to measure many spectral bins per spatial pixel (spaxel). Due to diffraction of the

micro-lenses the spot size is λFmla with λ the wavelength and Fmla the focal ratio of the micro-lens.

Each spot requires an area of λ2 Fmla
                                  2
                                      , while the total available area for each spaxel is the area of a

                                                  7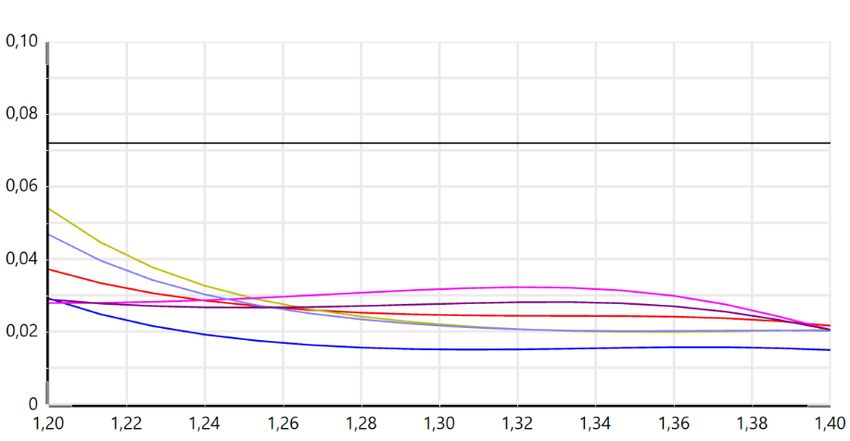
single micro-lens, D2mla . That means that the maximum number of spectral bins is,

                                                    D2mla
                                            Nλ =             .                                  (1)
                                                   λ2 Fmla
                                                       2

The relative bandwidth of the spectrograph is equal to the number of spaxels divided by the resolv-

ing power, R = λ/δλ, of the spectrograph,

                                      ∆λ Nλ    D2mla
                                        =   =          .                                        (2)
                                      λ   ηR ηRλ2 Fmla
                                                    2

Here ∆λ is the spectrograph bandwidth and η is the detector filling efficiency. The usual range of

η is between 1/2 and 2/3 to ensure either a separation of 1 or 2 resolving elements between the

spectra, respectively.

   The typical micro-lens diameter is on the order of 300 µm and for the near infra-red (NIR) a

central wavelength of 1.4µm is reasonable. If the micro-lenses have a focal ratio of 5 the total

bandwidth that can be observed at a resolving power of 10000 with a single exposure is 16%. The

bandwidth reduces to 8% if the detector separation is included. For high-resolution spectroscopy

(R = 100000) the bandwidth becomes a factor 10 even smaller. The single-shot bandwidth is a

crucial parameter for the HRS technique because the signal-to-noise ratio (SNR) of the template
                                                                                √
matching is proportional to the bandwidth and the integration time, SNR ∝        ∆λ∆t.19, 22 If the

single-shot bandwidth is not high enough conventional imaging techniques, such as ADI, may be

more efficient for exoplanet imaging.48 The MLA approach would be very suitable to target a small

bandwidth around emission lines, such as Hα, at high-resolution to search for proto-planets.

                                                   8
2.3 Fiber-based IFUs
A field can be reformatted by feeding each spaxel into a fiber. A fiber bundle has the most flexibility
of all reformatting techniques, the input and output can be rearranged completely independent from
each other. The fiber-based IFU was therefore also the first IFU concept to be used on-sky.49 Most
fiber-based IFUs until now have used multi-mode fiber (MMF). These fibers can capture all light
due to their large core, but have a low fill fraction due to their large cladding diameters. This
problem has been reduced by feeding the fibers with a micro-lens array to increase the field50 . The
past few years has shown that the mode filtering capabilities of single-mode fibers (SMFs) can be
used to create coronagraphs with smaller inner-working angles or higher throughput.51–54
Additionally SMFs can reject random speckles from the ExAO system to increase constrast,51
which has been used before in the interferometry community to make it easier to interfere different
beams.55, 56 Because single-mode fibers only propagate a single-mode, the LSF is also very stable
which will make it easier to calibrate the spectra. Single-mode spectroscopy is currently pursued in
the radial velocity field,57 because the LSF from multi-mode fibers is not stable enough.58 And as
a final benefit because SMFs only allow the propagation of a single-mode, any incoherent source
that consists of many modes will be attenuated.59 This property is very desirable especially in the
infra-red where the thermal background from the sky is high and limits the SNR of most obser-
vations. Therefore, a SMF bundle provides a significant amount of benefits over other manners
of image slicing making it a very attractive option for high-resolution broad-band integral-field
spectroscopy. It is difficult to quantify the gain of an SMF IFU over other methods without com-
plete end-to-end simulations, which include complete modelling of the instrument, calibration and
observing modes. A downside of SMFs is that the mode filtering capability is restricted to fo-
9cal plane samplings of 1 λ/D per spaxel or larger. If the spatial sample density is increased the
mode filtering becomes less effective, which removes the main benefit of the SMF. From this it
follows that an optimally designed single-mode (SM) IFU will most likely not Nyquist sample the
focal plane, which will remove the ability to use post-processing techniques like ADI. But with
the addition of high-resolution spectroscopy it is possible to apply post-processing techniques like
Molecule Mapping28 or High-Resolution Spectral Differential Imaging (HRSDI)34 to discover and
characterize exoplanets.
2.4 The MCIFU reformatter
To reach a high field filling fraction the SMFs have to be fed with micro-lenses.52, 60 SMFs have
very strict requirements on the alignment of the fibers for efficient injection,61 even more if they
need to be combined with coronagraphy.62 Currently the only SMFs-fed IFU is RHEA,63 which
uses a bundle of SMFs that are fed by a bulk micro-lens array. Accurate alignment of the SMF
bundle behind the MLA is very difficult with typical depths of focus of 10-20 µm and lateral
alignment tolerances ≤ 1µm.24 And even in case that the individual fibers would be aligned for
high injection efficiency, getting the output of the fibers aligned in the same plane of focus for the
spectrograph is still difficult.24 Both issues can be solved by using multi-core fibers, which contain
several independent SM cores inside a single fiber. This ensures that the fibers are in the same
input and output plane. But because of the small size of the MCFs it is difficult to feed them with a
bulk micro-lens array and reach the required alignment accuracy. We will use in-situ 3D printing
of the micro-lens array directly on top of the fiber face , which will allow for much more freedom.
However, due to fixed core spacing it is difficult to disperse the output over a broad bandwidth
if there are many cores.64 The pitch constraint is similar to the constraint of micro-lens based
10IFUss.18, 43
3 The single-mode multi-core fiber link
The fibre-link allows the point spread function (PSF) from the AO system to be coupled to the
spectrograph. A description of all the different elements of the MCIFU is presented in Figure 2.
Figures 2(a) and (b) show a schematic and photograph of the full MCIFU, with the five main com-
ponents; the MLA (c), the MCF (d), the MCF glued inside a custom V-groove (e), the reformatter
(f-g), and an ultrafast laser fabricated mask to block unguided light in the reformatter (h). Finally,
Figure 2(f,g) represents a schematic representation of the reformatter with the colour scheme to
distinguish each row of waveguides.
The fiber link was assembled by first manufacturing and connectorizing the MCF and chip,
then aligning and gluing to the reformatter and mask which were manufactured using ultrafast
laser inscription (ULI). This was then packaged using off-the-shelf and 3D printed components
and finally the microlenses were printed on the MCF which was secured in an FC-PC connector.
The following subsections are arranged in the order of manufacture.
3.1 Fiber
The MCF is comprised of 73 step-index Ge-doped cores manufactured using the common stack-
and-draw fibre fabrication technique (Figure 2(d)). The MCF has a outer cladding diameter of
560 µm. Each individual core has a numerical aperture (NA) of 0.14 and a diameter of approx-
imately 5.3 µm, which results in a mode field diameter (MFD) of approximately 8.2 µm at a
wavelength of 1.4 µm. The SM cutoff of each core is approximately 970 nm. The cores are spaced
by 41 µm, this means they are separated by approximately 5 times the MFD, ensuring negligible
11cross coupling between the cores.
3.2 Reformatter and mask
At the spectrograph end, the MCF is directly butt-coupled to a ULI fabricated three-dimensional
waveguide reformatter, which spatially reformats the MCF cores into a suitable arrangement, such
that the dispersed spectra from each waveguide do not overlap with each other on the detector. To
minimise undesirable effects due to scattered / unguided light not contained within the reformatter
cores, a mask was fabricated using femtosecond laser inscribed chemical etching (FLICE). This
mask consisted of a fused silica fixture with holes precisely positioned to align with the output
waveguides. Measurements taken after coating the silica with a layer of chromium, show that the
chromium mask is blocking the stray light by a factor of 10 to a 100 (see Figure 3).
To separate the spectra from each MCF core and avoid any overlap after dispersion, the quasi-
hexagonal MCF shape must be reformatted (Figure 2(g)). Existing reformatters have generally
chosen a linear pseudo-slit output pattern,36, 39, 65 however for the MCIFU we chose a staggered slit.
This has the advantage of increasing the spacing between adjacent cores, reducing cross coupling,
whilst also reducing the translation of the waveguides within the glass. The reformatted pattern
was created to give a spacing of 30 µm between the individual spectral traces of each core on the
spectrograph. To do so, ULI was used to inscribe a reformatter in a 20 × 10 × 1 mm borosilicate
glass substrate (Eagle XG).66 The inscription laser source is a MenloSystems BlueCut fibre laser
emitting at 1030 nm a 500-kHz train of 350 fs pulses which are focused within the substrate with
a 0.55 NA aspheric lens. Each waveguide was inscribed using a substrate translation speed of 8
mm/s and 19 scans of the laser focus with an inter-scan separation of 0.2 µm. This resulted in
highly symmetric SM waveguides with an NA of ≈0.11 and MFD of ≈7.3 µm at the 1/e2 beam
12Fig 2 The MCIFU fiber link, with important sections shown. (a) A schematic representation of the fiber link, (b)
photograph of the complete packaged fibre-link comprising all the elements from the microlens array, (c) the 3D
printed microlenses, (d) the bare fiber, (e) the bare fiber in a v-groove, (f) the input of the chip reformatter. (g) The
output of the reformatter (h) The output mask. The white arrow in (g/h) indicates the dispersion direction. Inset in (b):
scale picture of the full reformatter.
size of a Gaussian beam at 1310 nm. ULI has a limit in the refractive index contrast that can be
achieved, which resulted in a lower NA of the ULI waveguides as compared to the NA of the MCF.
This will lead to coupling losses at the interface of the reformatter and the MCF that represents a
significant part of the global insertion losses of the reformatter. The pulse energy providing the
highest throughput waveguides at the initial depth of 470 µm was 128 nJ and adjusted to 105 nJ
for depths lower than 130 µm to compensate for spherical aberrations on the beam.
The waveguides were characterised by two different laser sources: a 1310 nm laser and a
supercontinuum with an 1100 nm bandpass filter (with a full-width at half-maximum (FWHM) of
10 nm). The two different sources were coupled into an SMF-28 optical fibre and characterization
13100 Without mask
Straylight contrast
With mask
1
10
2
10
3
10
20 40 60 80 100 120 140
Row index
Fig 3 A slice along one of the rows of the reformatter showing the scattered light with and without the chromium mask.
Here, the input microlens array is overfilled, specifically to simulate background light in astronomical observations.
The blue shaded area, shows where the scattered light is still detectable between the waveguides, the red shaded area
shows the stray light with the mask. The row index is the pixel index along the extracted slice.
performed by butt-coupling the SMF-28 output to a single core of the MCF. The MCF was then
butt-coupled to each individual waveguide of the reformatter with the aid of an index matching
fluid. By this way, we ensure to work with the exact mode field diameter to characterize the
waveguides. SM behaviour of the waveguides in the J-band, between 1.1 and 1.3 µm was observed.
The throughput was characterized with the ultra-stable laser at 1310 nm. With this optimized set
of parameters, the throughput of the straight waveguides can reach 67 %, corresponding to a global
insertion losses of 1.7 dB. To create the reformatter, an investigation was performed to optimise
bend radius and minimise transmission losses. The bending losses are negligible for a bend radius
in the propagation direction of >15 mm, deviating by a distance of 1 mm (corresponding to the
extreme edge waveguides), and we have chosen a bend radius of 18 mm.
The final reformatter was permanently glued to the MCF using a UV curing adhesive. To pro-
vide a larger gluing surface to bond the fibre to the reformatter a fibre support chip was fabricated
with a custom hollow-cylindrical V-groove to house the MCF. This was created by the process
14of FLICE, in an (8 × 6 × 2 mm) fused silica substrate.67 The V-groove shape was defined by the
process of ULI with 200 nJ pulses from the Bluecut fibre laser at a repetition rate of 250 kHz and a
subsequent wet chemical etch in 8 mol.L−1 potassium hydroxide solution at 85 degrees to remove
the excess material.
Finally, a mask was developed to block stray and scattered light at the reformatter output while
allowing the light from the individual waveguides to propagate as desired. The scattered light in
the ULI glass substrate can present a significant challenge for astronomical instruments trying to
overcome the high contrast between the observed star and the planet.68 The mask (Figure 2(h)) was
created by the process of FLICE in a similar manner to the fibre support chip from a 2 × 12 × 2 mm
fused silica substrate. The high precision stages enabled a rectangular slot to be created to snugly
fit the reformatter within this mask, with 30 µm diameter through holes precisely passively aligned
to the waveguide positions (Figure 2(g)). A 120 nm layer of chromium metal was deposited on the
outer surface of the mask by electron-beam physical vapour deposition. This process creates an
opaque component that removes the scattered light present in the glass between the waveguides.
Figure 3 illustrates the removal of scattered light between the ULI waveguides without and with
the opaque mask, respectively in blue and red. The scattered light was measured by taking a slice
along one of the rows of the reformatter.
In Figure 4, we present the end-to-end throughputs from the MCF to the mask, at 1310 nm,
before the MLA was added. In Figure 4, one can see clearly that the fibre-link has lost a significant
part of the throughput on the top/bottom edges of the reformatter. These losses come from a slight
variation of the input waveguide positions of the reformatter (Figure 2(f)) in comparison of the
MCF, inducing mode-field diameter mismatching.
The whole output device was then encased with a combination of off-the-shelf components
15(a)
(b)
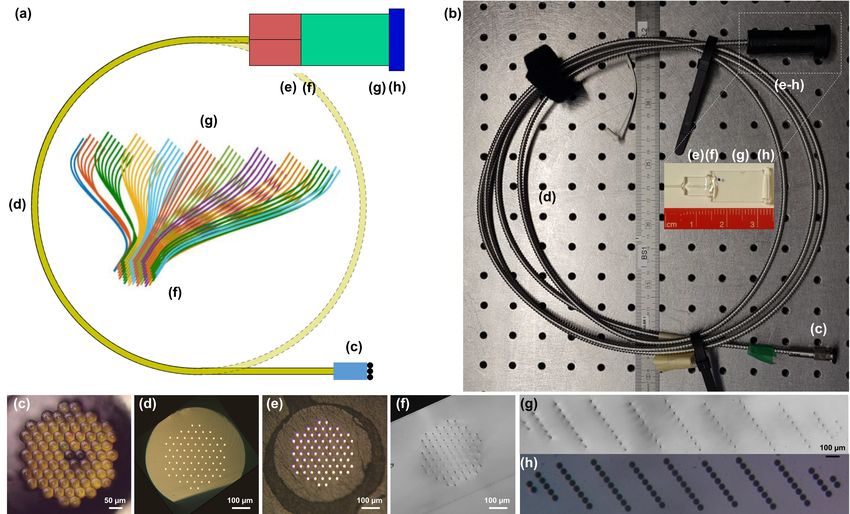
Fig 4 Illustration of the measured monochromatic (1310 nm) throughput results for the fiber link. (a) shows the
throughput for the 73 individual cores through the fiber, the reformattter and the chromium mask. (b) as for (a) but for
the full fiber link, including the microlenses. The colour bars represents the throughput ranges for each figure.
and 3D printed parts, and the MLA was secured within an FC-PC connector to create a robust
component for use at the telescope (Figure 2(b)).
3.3 Microlens array
The surface shape of the MLA was optimized for coupling efficiency using the physical optics
propagation module in Zemax. To simulate the Airy pattern of a telescope we used an unobstructed
aperture with a diameter of 1 m. The beam was focused by a paraxial lens with a focal length
that created a focal ratio of 22, allowing a 1.5 λ/D sampling per microlens of the focal plane at
1.3 µm. The microlens surface was then modelled as a single lens with a hexagonal aperture made
from IP-DIP.69 We tried several freeform shapes to increase the coupling efficiency but found
that there was very little improvement, less than a percent point, compared to purely spherical
surfaces. Therefore we chose a spherical surface for the final design. We found that a radius of
160.80 Fiber
0.75 Geometric
Throughput
0.70
0.65
0.60
0.55
1.0 1.1 1.2 1.3 1.4 1.5 1.6
Wavelength ( m)
Fig 5 The amount of on-axis light that couples into a single core of the MCF as function of wavelength within the
spectrograph bandwidth. The fiber throughput is the amount that couples into a single core, while the microlens
throughput is the amount of light that enters the microlens. With the microlens array we can couple between 80% and
95% of the light that falls on a single microlens.
curvature of 74.5 µm with a 205 µm height provided the highest wavelength averaged coupling
efficiency of 67.5% to a single core of our MCF. Figure 5 shows the on-axis coupling efficiency
as function of wavelength.The proposed microlens design has a theoretical wavelength dependent
throughput between 50% and 81%. The limiting factor in the throughput is the fraction of the
Airy Pattern that a single microlens captures. Due to scaling of the Airy Pattern with wavelength,
longer wavelengths will capture a smaller fraction of the PSF. The orange line in Figure 5 shows
the fraction of the transmitted flux for a micro-lens as a function of wavelength. It is clear that the
coupling to the SMF cores is between 80,% and 95,% efficient across the spectrum, which shows
that there will be little to gain from more complicated designs for on-axis objects.
The MLA was in-situ printed on the flat facet of the FC-PC connector in which the cleaved
MCF was manually glued and then polished. The lenses were printed in a single block and in a
single two-photon lithography step out of the commercial negative-tone photoresist IP-Dip.70 The
17structures were defined by an in-house built lithography machine, equipped with a 780 nm fem-
tosecond laser. An in-house developed machine software was used for high-precision alignment
and writing with high shape fidelity. Illumination of the fiber back end with a red LED together
with machine vision was used to detect all 73 cores of the MCF and align the individual lenslets
to the cores. Therefore, the full 3D-model is generated only after core detection in order to be
able to compensate any slight location and pitch variation of the individual cores of the MCF. The
individual models of the lenslets are then merged and at places of overlap, due to the slight spa-
tial variation in the MCF cores, the highest surface is chosen. Slight tilts of the fiber facet due to
mounting are detected as well and the structures corrected accordingly. The writing distances be-
tween subsequent lines and layers, i.e., both hatching and slicing distance, were set to 100 nm. No
anti-reflection (AR) coating was added to the micro-lenses. This adds some losses due to Fresnel
reflection, which are roughly 5%.
3.4 Performance of the fiber link
With the whole system assembled and packaged the individual cores were tested for throughput.
This was again performed at 1310 nm to be consistent with earlier tests. The light sources were fed
through a single mode fibre and then to a collimating lens (Thorlabs AC254-200-C). The collimated
beam was stopped down by an aperture stop to simulate the same focal ratio of 22 beam that
the foreoptics of the experiment with CANARY will supply to the microlenses. Finally a lens
(Thorlabs AC254-100-C) was used to focus the light onto the microlenses. To simulate the on-
sky conditions the input light was first optimised for position, focus, tip and tilt using a central
lens. This was optimized and checked at several points across the lens array and then used as
the reference. From this point only the horizontal (x) and vertical (y) position were changed,
18maintaining a global reference for all the microlenses. This means any deviation from perfect will
have reduced the throughput of the individual lenses, however it better matches the expected on
sky conditions. This simple setup creates a diffraction-limited beam and shows the wavefront error
free throughput.
The recorded throughputs are shown in Figure 4. This shows that the central cores performed
best, with significant reduction at the edges. Causes and solutions are discussed in Section 7.
4 The triple stacked Volume Phase Grating
The ultimate goal of the instrument is to have a spectral resolving power between 5,000 and 10,000,
which can be readily accessible with transmissive volume phase gratings (used in the 1st diffraction
order with the present design). Despite this, even if VPHGs can be made with very high diffraction
efficiency, the disadvantage of a classical, single first-order grating is that the light will be smeared
out in a single spectrum, thus wasting usable portions of the detector. Moreover, for securing the
large bandwidth at the target resolution, it is required to use a very wide sensor, which is very
expensive and not readily available. A possible solution is to multiplex the VPHG in layers as
reported in.41 In this way, each grating can diffract a different part of the wavelength range towards
the same direction so the average efficiency is improved by a wide margin, by having more than
one efficiency maximum. To separate the spectra on the detector plane, the gratings are rotated
with respect to each other, with a designed angle set in order to have clearly separated spectra and
output signals which are as horizontally dispersed as possible (see Figure 6).
19Fig 6 Scheme of the spectral-multiplexing concept. For simplicity a two-stacked VPHG is presented, each creating a
separate spectrum which are shown in different colours. The inset shows the simulated diffraction efficiencies of the
two layers for an example design.
4.1 Design
Considering the working wavelength range for this application of 1000 – 1600 nm, the geometrical
conditions have been chosen with the aim to obtain three 1st-order diffraction efficiency curves
with maxima at around 1100, 1300 and 1500 nm, ensuring a high efficiency at each wavelength.
The incidence angle defined in the spectrograph design is 21.5◦ . This angle is shared by the three
dispersing layers and the grating line density has been chosen to match the Bragg condition at the
central wavelength for each of the three gratings.
The efficiency and bandwidth of each single layer (and thus the refractive index modulation
strength, ∆n, of the grating and thickness of VPHGs respectively) has been calculated and opti-
mized by means of a Rigorous Coupled Wave Analysis (RCWA) based script. The ad-hoc code
takes into account the interaction between the diffractive layers and computes the final through-
put of the multiplexed element, see Figure 7. The losses due to reflection, as well as those due
201st order diffraction (%)
100
80
60
40
20
Y-band J-band H-band
0
1.0 1.1 1.2 1.3 1.4 1.5 1.6 1.7
Wavelength ( m)
Fig 7 Simulation of the combined diffraction efficiency of the multiplexed VPHG for an incidence angle of 21.5◦
for unpolarized light. The shaded area present the minimum and maximum diffraction efficiency prediction for the
manufacturing process. Material absorption and reflection losses have been estimated and taken into account.
to materials absorption and scattering have been considered in the simulations in order to have a
reliable prediction of the efficiency curves. In Table 1 are reported the final design parameters of
the stacked optical element.
Table 1 Main features selected for the three designed diffraction gratings.
Layer Grating
Layer Central wave- Index mod- rotational
thickness pitch
# length [nm] ulation ∆n angle [◦ ]
[µm] [lines/mm]
1 1100 0.022 28 668 -3
2 1300 0.020 34 565 0
3 1500 0.010 50 490 3
4.2 Manufacturing
The choice of the materials with different thickness has been based on the ∆n requirements along
with the width of each 1st order diffraction and the line density required for each grating. The
three gratings have been produced using the Bayfol R HX material. This photopolymeric film has
been chosen due to its ability to address precisely the required ∆n values, simply selecting the
21proper writing conditions (e.g. laser power density).71 Moreover, the solid layers can be used in
a configuration that requires only one glass substrate in between the layers, resulting in a thinner
diffractive element. Each VPHG layer composing the final device has been produced individually
by means of the holographic setup based on a 532 nm diode-pumped solid-state (DPSS) laser.
Every photopolymeric grating is supported by a BK7 round window (1 inch), the front and the
back ones possess AR coating on the outer face (optimized from 1 – 1.6 µm at 21.5◦ ).
After the characterization of each layer, they were coupled with index matching fluid (cedar
oil) and aligned according to the tilt angles specified in the design phase. To hold and block firmly
the three layers, an ad-hoc 3D-printed plastic (PLA) shell was used.
5 The spectrograph
5.1 Optical design
The spectrograph was designed with off-the-shelf lenses. The output of the reformatter was esti-
mated to have a focal ratio of 5, which was subsequently used as the input source for the spectro-
graph design. The spectrograph design is a standard first-order design, with a collimator lens that
creates the beam that will be dispersed by the grating, and a camera lens that focuses the spectra
onto a camera. For the camera lens we used an achromatic tube lens from Thorlabs, which has
diffraction-limited performance over a large field of view and spectral bandwidth while also deliv-
ering a flat image plane. These properties makes the tube lenses from Thorlabs ideal as camera
lenses for integral-field spectrographs. From the available tube lenses we found that the TTL200-
S8 fitted within the requirements of the MCIFU.
The focal ratio of the waveguides (#F=5) together with the effective slit length of 2 mm required
us to create a custom collimator. We used combinations of spherical singlets to create a ’semi-
220.10
Wavefront error (λ) Order 3
0.08
Diffraction-limited
0.06
0.04
0.03
0
1.42 1.46 1.50 1.54 1.58
0.10 Wavelength(μm)
Order 2
Wavefront error (λ)
0.08
Diffraction-limited
0.06
0.04
0.03
0
1.22 1.26 1.30 1.34 1.38
Wavelength(μm)
0.20
Order 1
Wavefront error (λ)
0.16
0.12
0.08 Diffraction-limited
0.04
0
1.12 1.16 1.20 1.24 1.28
Wavelength(μm)
Fig 8 The wavefront quality of the spectrograph as function of wavelength for the three different orders that are made
by the VPHG. The various colors represent a position along the pseudo-slit, and are the same pseudo-slit position for
each order. Here we can see that the spectrograph design is diffraction-limited over almost the full spectral bandwidth.
Only the blue part of the Y-band is slightly non diffraction-limited, which will lower the effective resolving power.
23Spectrograph image plane
Spectrograph input plane
Spectrograph pupil plane
Fig 9 The layout of the spectrograph with the different components of the spectrograph. The scale bar shows the small
footprint of the optical path of the spectrograph, which is roughly 40 cm by 20 cm.
custom’ collimator. The design procedure started with two off-the-shelf doublets. The internal
interface of each of the doublets was set to flat (a radius of curvature of infinite). All four outer
surfaces of these two doublets were optimized by minimized the angular root-mean square (rms).
Then the surfaces were iteratively replaced with the closest matching off-the-shelf singlet that was
available from either Thorlabs or Edmund Optics and then the angular rms was minimized by re-
optimizing the remaining surfaces. We repeated this procedure until we found a combination of
singlets that had diffraction-limited performance over the full wavelength range and pseudo-slit
length of the reformatter. While the optical quality of this semi-custom collimator was satisfying
not all optics were available with NIR optimized coatings. This resulted in a collimator with several
uncoated optics that reduced the throughput. Figure 8 shows the total theoretical wavefront quality
of the spectrograph design. Almost the full wavelength range is diffraction-limited, except for the
small range of 1.0 – 1.03 µm which is nearly diffraction-limited. The final layout of the MCIFU
spectrograph can be seen in Figure 9. The spectrograph could be kept small with a footprint of
approximately 200 × 400 mm due to the SM input.
24The collimator creates an 11 mm pupil diameter, with less than 0.5 mm of pupil wander as a
function of position along the pseudo-slit. The diffraction-limited resolving power of the spectro-
graph is R = Wρ, with W the projected size of the pupil onto the grating and ρ the line density of
the grating. The theoretical maximum resolving power would then be approximately 8000, 6700
and 5800 for Y-band, J-band and H-band respectively. For best performance the spectrograph has
been designed to work with an output plane of 2048x2048 pixels. A C-RED II with 640x480 pix-
els was available for the MCIFU tests. The complete spectral range was covered by translating the
camera. The full spectrograph output is covered by 12 camera positions.
5.2 Mechanical design
The mechanical design of the spectrograph ( see Figure 10) is simple thanks to its small size and
the optical beam features (slow beams). Moreover, the simplicity was also a requirement due to
budget and time constraints from the design to the commissioning. The working angle of the
VPHG in respect to the collimator and the angle with the camera are set using two 3D printed
pieces, allowing for a simple integration and alignment procedure. The additive manufacturing
approach was chosen also for the reformatter holder that allows for fitting the reformatted fiber
inside a standard mounting. The degrees of freedom of this component are the tip-tilt, the de-
center and the focus. The motorized stages that carry the camera are the same used in 3D printed
setups and allows for covering the full field-of-view by a set of discrete positions.
5.3 Performance
After integration of the spectrograph we characterized the throughput and resolving power of the
spectrograph. In order to have a good estimation of the spectral throughput of the instrument we
25Fig 10 Mechanical design of the spectrograph from the reformatter to the camera: 1) Motorized stages, 2) Dispersing
element, 3) Collimating Optical elements, 4) Reformatter holder, 5) Arduino control components, 6) C-RED 2 camera,
7) 3D printed elements.
26100
Throughput (%) 80
Diff. efficiency
Throughput
60
40
20
0
1.0 1.1 1.2 1.3 1.4 1.5 1.6 1.7
Wavelength ( m)
Fig 11 The measured diffraction efficiency and throughput of the spectrograph without the fiber link as measured by
the Tunable Laser Source. The solid lines show the diffraction efficiency of the stacked VPHG system. The dashed
lines include the throughput of the spectrograph optics.
used a Tunable Light Source (Oriel TLS-300X). The poor coupling between the faint TLS source
and the fiber prevented a good signal/noise for the throughput measurement. In order to send some
light through the instrument we had to measure subsystems independently and without the fiber.
Moreover, as the f /# of the source didn’t match the instrument, we decided to first measure the
Multiplexed VPHG, and then the in-line optical train without the VPHG.
The throughput of the spectrograph lenses was also measured with a 1064 nm diode laser,
knowing that the spectral response is mainly due to interface reflections it is consistent with the
previous estimations. The throughput of the lenses in the spectrograph is approximately 0.8 which
is consistent with the fact that we the first two lenses are not AR coated. The total throughput of the
system is then calculated adding the VPHGs contribution. In Figure 11 we report the spectrographs
total throughput and the measured efficiency curves of the Multiplexed VPHG.
With all individual components measured we can determine the total end-to-end throughput.
27WHT+CANARY AO coupling efficiency Total
Throughput (%) 60 Fiber link Spectrograph + detector
40
20
0
1.0 1.2 1.4 1.6 1.8
Wavelength ( m)
Fig 12 Throughput of the individual components together with the total throughput (black). The largest limiting factor
is the fiber link. The total throughput is 0.4 % on average.
The wavelength dependent throughput can be seen in Figure 12. The throughput of CANARY
with the WHT (T. Morris, private communication) is also included in the throughput budget. The
impact of the AO performance on the coupling efficiency is based on the expected Strehl ratio of
CANARY and simulations that determine the relation between the Strehl ratio and fiber coupling
efficiency.61 From this we determine that the expected end-to-end throughput is on the order of
0.4 %. The main limitations are the fiber link throughput and the AO performance.
The resolving power of the spectrograph was determined with a Krypton line lamp (Oriel 6031
Kr Spectral Calibration Lamp).To obtain a wavelength solution for all individual cores we injected
the light through the fiber bundle. Even though the line lamp was a large incoherent light source,
we were still able to couple enough light into each individual core for calibration purposes. The
wavelength solution was fitted with a first order polynomial. From the wavelength solution we de-
rived a linear dispersion of 0.070 Ånm−1 , 0.850 Ånm−1 and 0.095 Ånm−1 . The measured dispersion
of each of the gratings was within 1% of the designed dispersion, indicating that the triple stacked
285000
Resolving power 4000
Y-band
J-band
3000 H-band
2000
1000
0
1.0 1.2 1.4 1.6 1.8
Wavelength ( m)
Fig 13 The measured resolving power of the MCIFU for the three different spectral orders. The shaded area shows
the 1-σ resolving power estimates from several emission lines within each order. The points in each area show the
median resolving power of that order. The H-band resolving power has a large spread due line blending of many of
the measured lines. The estimated resolving power is a factor 2 to 3 lower than the theoretical limit.
grating was manufactured within specifications. From the line lamp measurements we could also
derive the effective resolving power of the spectrograph, which is defined as the center wavelength
of the Kr emission lines divided by their FWHM. The resolving power for the different spectral or-
ders can be seen in Figure 13. The effective resolving power is a factor 2 to 3 lower than expected.
This is most likely due to a misalignment of the collimation optics, as the PSFs of each emission
line are magnified more than expected, show an asymmetry and have a strong Airy ring. These
features are not expected from SM waveguides that output Gaussian-like profiles, and indicate that
we are vignetting the beam inside the spectrograph.
6 Testing with CANARY
The spectrograph was tested with the CANARY AO system at the WHT.42 CANARY is an AO
demonstration test bed for wide-field laserguide star tomography and open-loop AO control. The
2940 10000
30
8000
20
10 6000
y (pixels)
0
10 4000
20
2000
30
40 0
40 30 20 10 0 10 20 30 40
x (pixels)
Fig 14 The PSFs of the spectrograph as measured with the Kr spectral calibration lamp. The horizontal axis is the
dispersion axis. The diagonal array of PSFs is the output of a single emission line illuminating a single row of the
reformatter. The PSFs are extended and asymmetric towards the north-east and show a clear Airy ring.
30main purpose of such an AO system is to deliver good wavefront correction over a large field
of view. CANARY was used in single-conjugate adaptive optics (SCAO) mode for the MCIFU
experiment. In this mode the wavefront errors are measured by a 7 × 7 Shack-Hartmann wavefront
sensor, which are then fed- back to a 52 element deformable mirror (DM) and dedicated tip-tilt
mirror. In this configuration CANARY delivers a Strehl of 30 % in nominal atmospheric conditions
in H-band. The data was taken between the 18th and 21st July 2019, under the OPTICON open
access time. This time was shared with two other groups performing experiments, dividing the
nights into sections.
Once assembled, the MCIFU was tested using the internal CANARY sources. We used a
modified simulated annealing routine72 to remove path abberation (PA) between the wavefront
sensor and the fiber. The algorithm optimised the shape of the DM, maximising the fibre coupling.
This increased the fiber coupling by approximately 10 %.
Several exposures with increasing exposure time were taken to create a high-dynamic range
image for post-fiber contrast determination. The post-fiber contrast map can be seen in Figure 15.
The contrast in the first ring is on the order of 10−2 , which is similar to the contrast of the first Airy
ring. The map also shows that there is some asymmetry in the PSF. The asymmetry in the contrast
map hints on residual astigmatism or coma, which is on the order of 0.5 radians rms by comparing
simulated contrast maps with the data. This can be seen in Figure 15.
6.1 On-sky performance
Once on-sky we targeted bright stars, in order to estimate the performance. Our prime target was
Vega, because we could use it as a calibrator star. In Figure 16 the full spectrograph output is
shown by a stitched image of 12 camera positions.Due to the AO tip-tilt variation and because
31Measured Simulated astigmatism
0.0 0
3 2
1
2 0.5 0
y position ( / D)
1 2 2
1.0
2.5 0.0 2.5
0
Simulated coma
1.5 0
1 2
1
2 2.0 0
3 2 2
2.5
2 0 2 2.5 0.0 2.5
x position ( / D)
Fig 15 The monochromatic post-fiber contrast map on a logarithmic scale as measured with a 1550nm laser (left).
A comparison of the asymmetry in the illumination with simulations (right) hints on the presence of 0.5 radians rms
residual astigmatism and/or coma.
the exposures of the individual camera positions were taken sequentially and the there is some
variability in the flux between the positions. Not all cores of the MCF could be used during the
on-sky demonstration as there was not enough separation between the three orders to fit all the 73
cores, which resulted in overlapped spectra. The top and bottom of the reformatter was blocked
with a mask to remove the overlapping spectra.
Vega is an A0 star which means that it is almost featureless, the main spectral features that are
visible come from the Earth’s telluric absorption lines. Figure 17 shows the extracted spectrum
from 1310 nm to 1390 nm averaged over all fibers. We chose this part of the spectrum as it il-
lustrates the effect of the telluric features. The telluric features allowed us to do an independent
measurement of the on-sky resolving power and wavelength solution. We used the ESO Sky-
Calc73, 74 to generate a transmission spectrum using the standard Paranal atmospheric parameters.
Vega was modelled with a high-resolution PHOENIX stellar model75 with an effective stellar tem-
321600 nm 1400 nm
Telluric features
1400 nm 1200 nm
1200 nm 1000 nm
Fig 16 The full spectrograph output of Vega after stitching 12 detector positions together. The color of the image is
logarithmically stretched to highlight the spectra from the fainter fiber cores. Each fiber captures a different part of the
PSF at the input, therefore the brightness of the spectral trace corresponds with the brightness of the captured part of
the PSF. The main features that are visible are the telluric lines imprinted into the spectrum of Vega. Abrupt changes
in the continuum of the individual cores are visible because the full image was reconstructed from 12 observations that
were taken one after another, with varying conditions. The beginning and end of each spectrum has been marked with
the corresponding wavelength.
perature of T eff = 9600, metallicity of Z = −0.5, and surface gravity log g = 4.0. We used a
4th order polynomial for the instrument throughput and also used a 4th order polynomial for the
wavelength solution. The high-resolution spectrum was convolved by a Gaussian with a certain
width to mimic the effect of the spectrograph resolving power. The retrieved resolving power from
this procedure was R = 2970, which matches very well with the estimated resolving power from
the Kr line lamp. We did not match all features in the observed spectrum because the parameters
of both the telluric model and the stellar model were fixed. The good match between the measured
and modelled spectrum shows that we can extract high fidelity spectra that are not contaminated by
etalon and fringing effects. Previous SMFs spectrographs were plagued by strong etalon amplitude
variations, that could be up to 10 % across the spectra.24, 63
Because of the optical layout of CANARY and the MCIFU it was not possible to image the
3380000 Observed spectrum
Model spectrum
60000
Flux (a.u.)
40000
20000
0
1320 1330 1340 1350 1360 1370 1380 1390 1400
Wavelength (nm)
Fig 17 The spatially averaged spectrum of Vega from 1300 nm to 1400 nm. The structure of this part of the spectrum
of Vega is predominantly caused by the telluric absorption lines.
PSF and the spectrograph output. Therefore we were not able to get a direct estimate for the on-sky
fiber coupling efficiency.
A second target that was observed was Alpha Herculis, one of the brightest infra-red targets in
the sky with magnitudes of J = −2.3 and H = −3.2.76 The brightness of the target allowed us to
do high-speed integral-field spectroscopy at 10 Hz , at a single camera position. In Figure 18 we
show the reconstructed H-band PSF of one of the exposures.
During the OPTICON July 2019 run at the WHT, another experiment was performed to charac-
terise AO performance with a more sophisticated controller, the Linear Quadratic Gaussian (LQG)
regulator instead of the standard integrator. The LQG regulator relies on a model that describes
the temporal dynamics of the disturbance and whose relevance is a key for performance improve-
ment. It includes both the auto-regressive order 2 model on the first 495 Zernike modes built from
turbulence priors as described in,77 and a data-driven model for the 9 first modes estimated from
recent AO telemetry data. This LQG controller provides a more accurate modeling of the temporal
dynamics for the most energetic modes: not only vibrations on the tip and tilt but most of other
sources of disturbance on the 9 first modes is captured whether it comes from dome turbulence,
windshake or atmospheric turbulence. Implementing this LQG controller required very little tun-
341.0
0 0.8
RA( /D)
0.6
2
0.4
4 0.2
0.0
6 4 2 0 2 4
DEC( /D)
Fig 18 The on-sky reconstructed H-band image, using the MCIFU, of the bright star Alpha Herculis. The observations
were taken at 10Hz. The image shown here are is the mean of 1000 successive images from the data stream. Each
micro-lens samples roughly 1.3 λ/D. The asymmetry in the PSF comes from a slow drift in tip/tilt alignment during
the observations.
ing and proved to deliver increased performance and to be much more stable than the integrator.78
During the night from July 21st to 22nd 2019, we observed Alpha Herculis both with the integrator
and the LQG and measured the impact on the tip-tilt residuals. To estimate performance, we made
a white light image of the IFU PSF and calculated the centroid of the white-light PSF as function
of time. The centroid was measured by using the center-of-mass of each PSF. We estimated that
the LQG successfully decreased the standard deviation of the centroid by a factor of approximately
1.4.
7 Discussion
The on-sky tests of the MCIFU have shown that the novel components are able to work together
on-sky to deliver a SMF-fed NIR integral field spectrograph (IFS). It was not possible to optimize
the performance of all components due to the short time (6 months), between inception of the
35You can also read