Digital Commons at Oberlin - Oberlin
←
→
Page content transcription
If your browser does not render page correctly, please read the page content below
Oberlin
Digital Commons at Oberlin

Honors Papers                                                                                       Student Work

2021

The Relationship between School Shootings and Gun Acquisition
Rates
Sun-il (Sun) Moon
Oberlin College

Follow this and additional works at: https://digitalcommons.oberlin.edu/honors

   Part of the Economics Commons

Repository Citation
Moon, Sun-il (Sun), "The Relationship between School Shootings and Gun Acquisition Rates" (2021).
Honors Papers. 824.
https://digitalcommons.oberlin.edu/honors/824

This Thesis is brought to you for free and open access by the Student Work at Digital Commons at Oberlin. It has
been accepted for inclusion in Honors Papers by an authorized administrator of Digital Commons at Oberlin. For
more information, please contact megan.mitchell@oberlin.edu.
The Relationship between School Shootings and Gun
                   Acquisition Rates

                                            Sun Moon1
                           Department of Economics, Oberlin College

                                              Abstract
           In this paper, I seek to understand how communities respond to tragic events involv-
       ing violence, exploring the relationship between school shootings and gun acquisition
       rates. Using National Instant Criminal Background Check System (NICS) as a proxy
       for firearm acquisition rates, I estimate an event study framework, finding that gun
       acquisition rates increase by up to 32% one month after a school shooting compared
       to firearm acquisition rates one month before a school shooting. Furthermore, I sup-
       plement my analysis by using Google Search data on firearms. Additionally, I stratify
       my analysis by the four census regions and whether a school shooting occurred in
       a majority-minority county. My results contribute to existing literature, investigating
       the linkages between Google search data and social phenomena and the impact of mass
       shootings on the social sphere.

   Keywords: K-12 school shootings; gun acquisition rates; Google Trends data

   JEL Classification Numbers: I12, I18, K42

   1
     This paper satisfies the research component of the Oberlin College Honors Program in Economics. Sun
thanks Professors Evan Kresch, Martin Saavedra, Barbara Craig, and Chris Cotter for continued feedback
on this paper.

                                                   1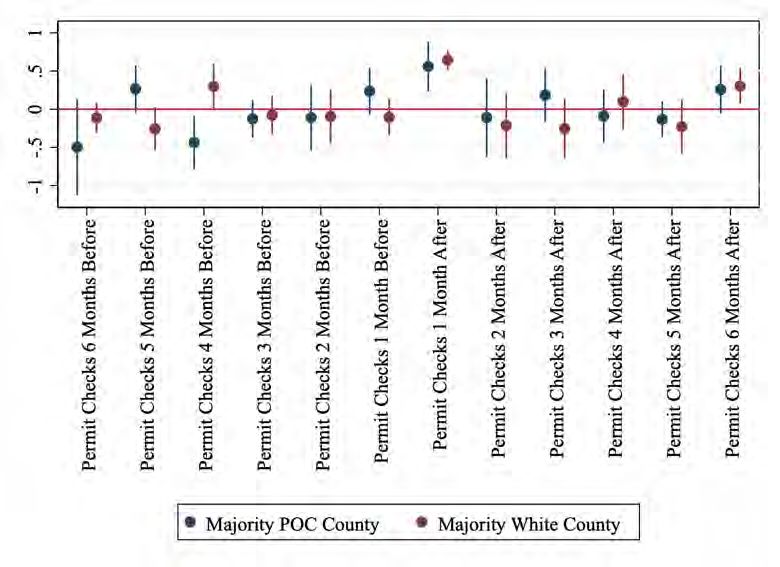
How do school shootings affect gun ownership rates? Since 2009, there have been over
170 school shootings, with over 356 victims (CNN, 2019). In the aftermath of these school
shootings, communities and governments have responded in different ways. Politicians have
passed stricter gun legislation, making it harder for citizens to acquire deadly firearms to
deter future mass shootings (Kwon and Baack, 2005). Altering the American public’s psy-
che, mass shootings and the extensive media coverage it receives has led to an onslaught of
unforeseen and foreseen effects, including active shooter drills in K-12 schools, the deterio-
ration of physical and mental health among students, and many causalities (Moore-Petinak
et al., 2020). The variety of social responses induced by school shootings provides insight
into how communities react to public tragedies involving violence.
    Considering the diverse array of community responses to school shootings, I analyze
the impact of K-12 school shootings on gun acquisition rates. Estimating an event-study
framework, I quantify the effects of school shootings on gun ownership six months after a
K-12 school shooting, using data from NICS Firearms Background Check Data as a proxy
for gun ownership rates. My results suggest that gun ownership rates remain constant up
to one month before a school shooting, increasing by up to 32% relative to the month of the
school shooting, after which the effect levels off. Further, I find weak evidence to suggest
that majority-white counties purchase more firearms compared to majority people of color
(POC) counties in the months following a school shooting.
    I add to existing literature, which has documented how communities respond to mass
shootings. Liu and Wiebe (2019), using U.S. data on firearm checks as a proxy for gun sales
and data on mass shootings between 1998 and 2016, found that in the aftermath of a mass
shooting, gun purchases increased by up to 21%, while, in some instances, it decreased gun
sales by 18%. Further, Wallace (2014) finds a delayed response to gun ownership increases
after a mass shooting, using panel data OLS. Additionally, Studdert et al. (2017), using
time series analysis, finds that gun acquisition rates increased after the mass shootings in
Newtown, CT, and San Bernardino, CA, in 2012 and 2015, respectively. Moreover, Porfiri
et al. (2019) finds that increased media coverage of mass shootings induces increased firearm
acquisitions.
    On a broader societal scale, some communities react to school shootings by enrolling their
children in private schools (Abouk and Adams, 2013). At the state level, in the aftermath of
a school shooting, politicians seek to pass stricter gun legislation bills (Luca, Malhotra and
Poliquin, 2020). The bills’ efficacy, if passed, depends on whether Republicans or Democrats
govern the state-legislature (Luca, Malhotra and Poliquin, 2020). At the individual level,
research has documented increased levels of mental and physical illness among students who
experience a school shooting the students who experience a school shooting (Addington,

                                              2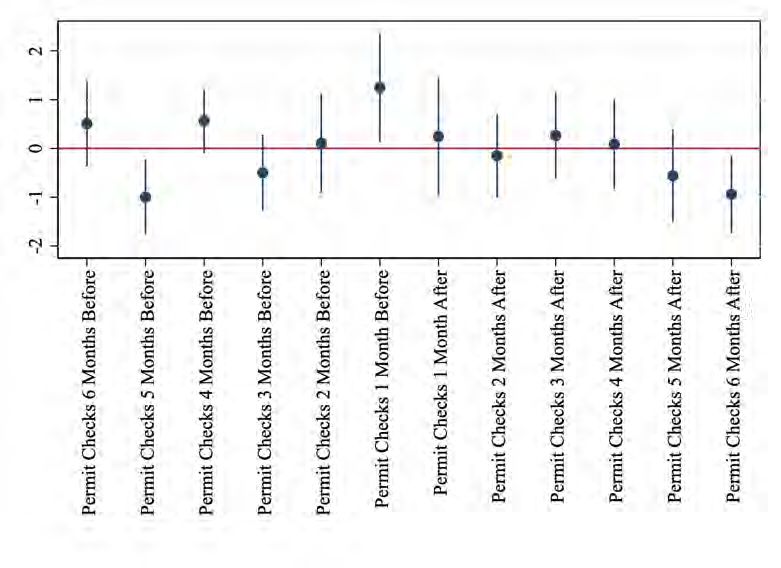
2003; Studdert et al., 2017; Suomalainen et al., 2011). Considering the diverse array of
responses to school shootings, I seek to understand how a politicized and public tragedy
affects gun acquisition rates, revealing a fundamental facet of American society.
    My study adds to existing literature while differing in the following ways. First, I expand
the definition of a mass shooting. Many studies define a mass shooting as an incident with
at least four or more casualties (Studdert et al., 2017; Wallace, 2014). In restricting the
definition of a mass shooting, such studies lose out on variation in shootings. Figure 1
illustrates that approximately 97% of school shootings had fewer than five casualties.
    Second, I supplement my results by performing a series of robustness checks and extending
my primary specification results, using Google search data on 416 common and uncommon
gun manufacturers and models and data from the National Instant Criminal Background
Check System (NICS). I also stratify my analyses by the 4 Census regions and whether the
shooting occurred in a predominantly white or minority neighborhood.
    Third, I conduct my analysis on K-12 schools only. Mass shootings occur in many of
America’s public arenas, from movie theaters to gay bars. By not including such mass
shootings in my analysis, I can explore how communities react to tragedies involving only
K-12 students. It can be assumed that the public’s response to a K-12 school shooting, a
population that has not become politicized, will differ from that of a mass shooting in a
gay bar, considering the history of homophobia in the United States. Thus, while research
has found that mass shootings induce an increase in firearm acquisition rates, stratifying my
analysis to a less politicized population will reveal the possible homogeneity or heterogeneity
of the public’s response to tragic events involving violence towards K-12 students.
    My paper is organized in the following order. I first provide a background of K-12 school
shootings in the United States and their effects on American society while also exploring the
process of acquiring a firearm in the United States. Second, I outline my data sources and
summary statistics relevant to my analysis. Third, I specify my Econometric model and its
associated assumptions. Fourth, I conduct a series of robustness checks and expand upon
my main results. Fifth, I document my results, comparing and contrasting them to work
already done in this field. And, lastly, I conclude with future directions this research could
take.

I    Background
    The United States has a unique relationship to firearms. Guaranteed as a fundamental
right in the U.S. Constitution’s Second Amendment, the right to bear firearms is a hallmark
of American culture and, among certain circles, viewed as a fundamental right bestowed

                                              3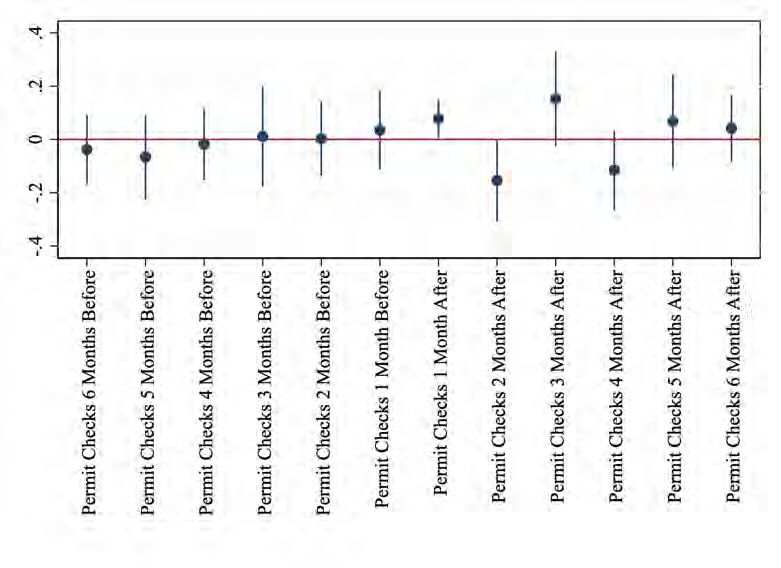
to the American people (Woolf, 2017). Intended initially to deter British influence during
America’s founding, the Second Amendment has become a symbol of individual liberty and
freedom, two fundamental tenets that guide American politics (Woolf, 2017). Strong support
for the Second Amendment has resulted in the creation of large, powerful gun-rights lobbying
groups, including most notably the National Rifle Association (NRA) (Waldman, n.d.).
Despite the mounting pressure for gun control reform in the wake of mass shootings,
such lobbying groups have successfully blocked the passage of stricter gun control legislation
while also limiting research into firearms (Kramer and Harlan, 2019; Raphelson, 2018). Most
notably, the NRA has successfully stifled study and data collection initiatives related to guns
through the Dickey Amendment of 1996 (Rostron, 2018). The amendment required that the
Centers for Disease Control and Prevention (CDC) cannot use its funds to research that could
be used to “advocate or promote gun control” (Rostron, 2018). The NRA has been successful
in its other initiatives to preserve the Second Amendment’s sanctity despite research that
has documented the positive relationship between liberal gun control legislation and mass
shootings (Kaste, 2021; Raphelson, 2018; Reeping et al., 2019).
While the NRA and other lobbying groups have sought to preserve the Second Amend-
ment, their policy agenda has dramatically redefined the K-12 American school system
(Raphelson, 2018). Instead of making acquiring firearms more onerous, the U.S. govern-
ment, backed by public interest groups, have turned K-12 schools into what some educators
describe as a “war zone” (Davis, 2019; Raphelson, 2018) K-12 students are regularly sub-
ject to active shooter drills, where schools will simulate fake shootings to prepare students
for such a tragedy. This approach is summarized by the acronym and company ALICE –
Alert, Lockdown, Inform, Counter, and Evacuate – who trains schools to implement active
shooter drills to prepare students for a school shooting (O’Regan, 2020). Many educators
have criticized this approach to deterring school shootings, arguing such exercises trauma-
tize students. Instead, they have advocated for stricter gun control legislation, increased
access to mental health resources for students, and the creation of more inclusive school
environments (O’Regan, 2020; Vossekuil et al., 2004).
While it is improbable that students will experience a school shooting, the threat of school
shootings looms large on the American populace, contributing to the public perception that
school shootings are a grave threat (Muschert, 2007). Exemplified by the term the Rashomon
effect, where eyewitness accounts of events often mislead the public’s understanding of events,
the media and fear-mongering culture caused in part by school shootings lead Americans to
react to school shootings (Muschert, 2007).
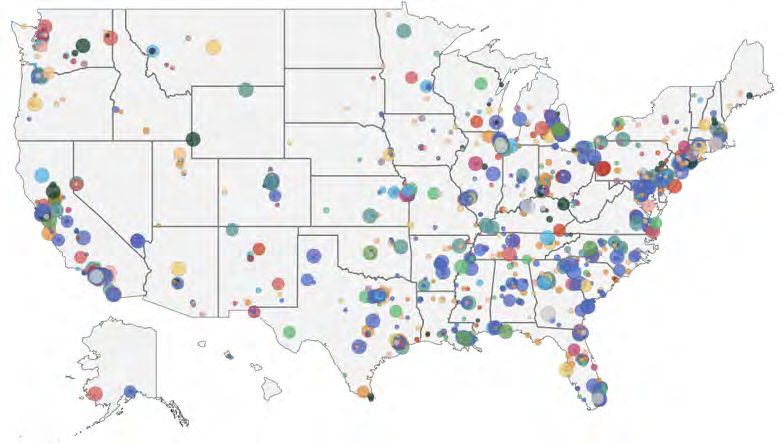
Figure 3 highlights the locations of all U.S. school shootings, with the magnitude of the
causalities represented by the size of the circle. However, with much of the nation transi-
4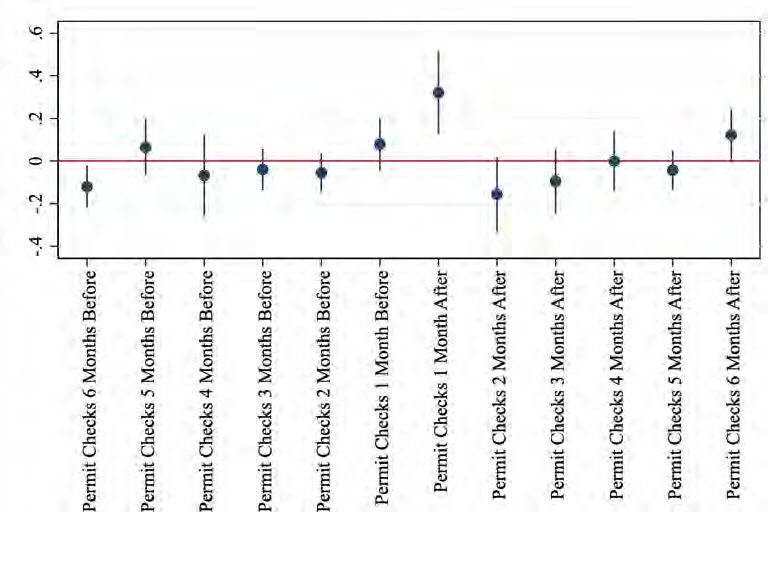
tioning to remote learning due to the COVID-19 pandemic, school shootings have become
less common, as evidenced by the drop in school shooting counts portrayed in Figure 2.
Politically controversial and nuanced, school shootings and their public natures are a man-
ifestation and space where one of America’s core ideals, individual liberty, is tested and
challenged.

A    Background: The Process of Acquiring Firearms
    To combat gun violence, the US government passed the Brady Act, creating a federal
database of criminal, mental, and drug history for individuals known as NICS. NICS gathers
data from the National Crime Information Center, the Interstate Identification Index, and
the NICS index (Center, 2020). The National Crime Information Center collects data on
missing person reports, criminal records, protection orders, and more (Center, 2020). The
Interstate Identification Index has information on individuals who have been arrested or
convicted of felonies or serious misdemeanors (Center, 2020). The NICS index gathers data
not covered in the two categories mentioned above, including mental health records and
citizenship status (Center, 2020). However, it is essential to note that individual states
have the discretion on whether they share, with the federal government, a citizens’ criminal
history, mental health, drug abuse, and domestic violence records, leading to an incomplete
database (Center, 2020).
    Individuals who wish to purchase a firearm must fill out a Firearms Transaction Record
(ATF Form 4473), which records the individual’s personal identifying information and
present a government-issued photo ID to the firearms dealer (Center, 2020). The dealer
will then contact the NICS Operation Center, providing them with the information listed
on the ATF Form 4473 (Center, 2020). It is important to note here that the Bureau of
Alcohol, Tobacco, Firearms, and Explosives (ATF) are prohibited from collecting data on
gun purchases due to pro-gun lobbying efforts (Center, 2020).
    After the application has been processed through NICS, the buyer will receive one of three
decisions: an instruction to proceed with the firearm sale, instruction to deny the firearm
permit, or instruction to delay to gather furthermore information on whether the individual
is eligible to purchase a firearm (Center, 2020). If NICS does not contact the dealer within
three business days, the sale can continue. Most gun permits are denied on the grounds of
a felony or misdemeanor crime conviction (Center, 2020).
    There is, however, a lot of variability in whether an individual is granted a firearm permit
(Center, 2020). Some states are much more stringent with their background checks; states
and local authorities may conduct their background checks, alongside the NICS background

                                               5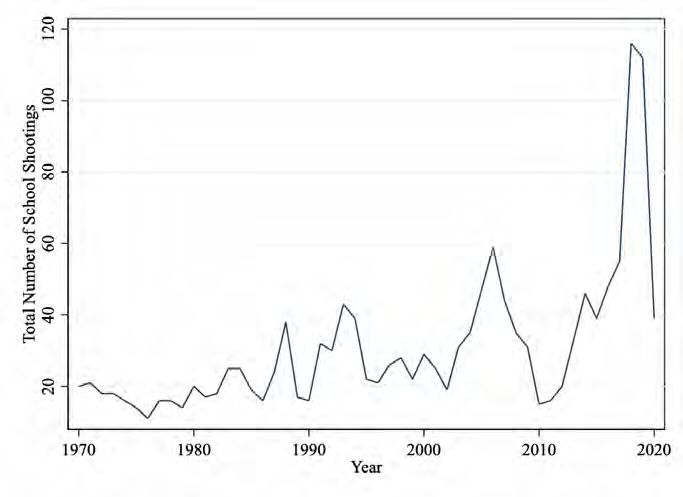
check, to determine eligibility to purchase for all types of firearms (Center, 2020). These
states include California, Colorado, Connecticut, Florida, Hawaii, Illinois, Nevada, New
Jersey, Oregon, Pennsylvania, Tennessee, Utah, Virginia, and Washington. Some states also
conduct more than one background check depending on the type of firearm (Center, 2020).
For example, Maryland, Nebraska, New Hampshire, Washington, and Wisconsin conduct
their background checks for individuals trying to acquire handguns (Center, 2020). There is
a great deal of variability in whether an individual is granted a gun license (Center, 2020).

II    Data
    I construct a novel data set using publicly available data from Google Trends, the Pew
Research Center, K-12 School Shooting Database operated by the Center for Homeland
Defense and Security, United States Census Bureau, and NICS database, gathering my data
at the state, year, and month level. I exclude 2020 from my analysis, given that the number of
school shootings decreased due to, in part, education’s transition to remote learning (Kumar,
2020).
    I manipulate and merge these data sets to estimate my Event Study Frameworks. Table 1
and 2 present my summary statistics of interest. Of interest, the mean number of NICS
background checks was 25,522, while the average number of search “hits” was 10.46. The
number of causalities for each school shooting ranged from 0 to 35.

A     Independent Variable: Proxies for Gun Ownership and Amer-
      ican’s Interest in Firearms
   I use NICS and Google Trends data as proxies for Gun Ownership and American’s Interest
in Firearms, respectively, merging them with my control variables when necessary for my
analysis.

A.1   National Instant Background Check System (NICS)

     As there is no comprehensive database containing the number of guns sold, I use the
National Instant Criminal Background Check System (NICS) database. While gun control
legislation varies by state, an individual who wishes to buy a firearm must undergo a criminal
background check through NICS. While people may be denied a permit to buy a gun, NICS
still documents the number of background checks conducted for each state and year. The
NICS data set may not reflect the actual number of firearms purchased; however, this data
set is the best available proxy for gun-ownership rates (Raphelson, 2018). I restrict my

                                              6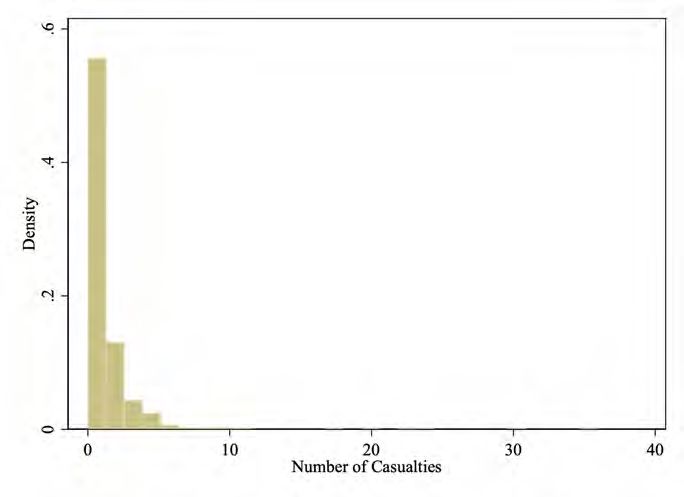
analysis periods from January 2000 to 2019 December, in monthly increments, given data
availability.

A.2     Google Trends Data

    To supplement my main analysis, which uses NICS data, I mine data from Google Trends,
gathering data on the relative number of searches for four-hundred and sixteen terms related
to gun manufactures and models for all fifty states and D.C. in monthly increments for my
analysis periods1 . I restrict my analysis periods from January 2004 to December 2019, as
Google Trends began collecting the most accurate data beginning in 2004. After mining
data, I am left with a search ”hits” index for each term by month, year, and state, which
ranges from 0 to 100, and measures the following:

        “The index does not capture the actual volume or magnitude of individual
        searches over time. Instead, it provides a measure of search activity relative
        to the month or week with the highest search volume level within the period
        examined. For example, an analysis of monthly search activity over a year would
        express each month’s search activity relative to the month with the highest search
        activity level. The month with the highest level of relative search activity is given
        a score of 100. An analysis of weekly search activity uses the same approach, but
        with weeks as the unit of comparison instead of months.” (Lam, 2018)

  After getting an index for each search term by month, year, and state, I calculate the
mean value of “hits” for all 416 terms by date and state. This variable serves as a proxy for
American citizens’ interest in guns and, more broadly, a measure of interest in firearms.

B       Control Variables
B.1     Center for Homeland Defense and Security K-12 School Shooting Database
        (SSDB), and U.S. Census Bureau Intercensal County Population Data

    I use data from the Center for Homeland Defense and Security K-12 School Shooting
Database, which documents the date, school, state, number of casualties, a reliability index,
firearm type, race of the shooter, victims’ race, and more. The database is unique in that it
documents “every instance a gun is brandished, is fired, or a bullet hits school property for
any reason, regardless of the number of victims, time of day, or day of the week” (Friedman,

    1
    I gather the list of terms from a Pew Research Study Center Study (Lam, 2018). The terms can be
found in this Google Drive folder linked here Google Trends search terms.

                                                 7
Jernegan and O’Neill, 2020). Given that there were instances where there were more than 1
school shooting in a month, I sum the total number of causalities from school shootings for
every given year-month in my data set. I then create a dummy variable C that takes on a
value of 1 if a school had more than 1 casualty and takes on a value of 0 if otherwise.
Further, I utilize the Census’ Intercensal County Population Data by Age, Sex, Race,
and Hispanic Origin, which contains data on each county’s demographic makeup from 1999
to 2020. Using this data set, I calculate the percentage of minority groups in each county.
Specifically, I sum the total number of African-Americans in a given county and year, then
divide that number by the respective state’s total population, multiplying this figure by
100. Studies have used different percentage thresholds to determine whether a community
is a majority POC neighborhood, ranging from 20% to 30% (Candipan, 2019). I use a less
conservative threshold than that of previous studies. I create a dummy variable, taking on
a value of 1 if more than 20% of a county’s population identify as Black, and 0 if otherwise
for each school shooting in my month-year time period, coding this variable as POC. In
instances where more than 1 school shooting occurred in a majority Black county, I code it
as 1. I merge this data set with my SSDB by time and county where the school was located
in.
I am left with a data set with monthly time increments from January 2000 to 2019
December and its associated dummy variables, C and POC. I merge this data set with my
independent variable databases, NICS and Google Trends Data.
III Empirical Strategy
To estimate the effect of school shootings on gun ownership rates, I estimate the following
event-study state-year-month fixed effects framework:
6
X −1
X
ln(P ermitit ) = βk ln(P ermitit+k ) ∗ Cit + γk ln(P ermitit+k ) ∗ Cit + δi + σt + εit (1)
k=1 k=−6
where ln(P ermitit ) is the proxy for the number of gun ownership rates in state i and
month-year t, as measured by the number of firearm background checks. The 50 U.S. states
and D.C. are indexed by i, while t spans periods in monthly increments from November
1998 to December 2019, inclusive. k indexes the number of firearm background checks k
months before and after a school shooting. I exclude the month of the school shooting to
avoid perfect multicollinearity. I seek to capture whether school shootings with one more
causalities induced an increase in firearm acquisition rates, interacting P ermits with C.
8I include state and time fixed effects, represented by δi and σt , respectively, capturing
time trends and societal factors that influence gun ownership rates.
My variables of interest are the lead interacted coefficients in the months following a
school shooting. I expect to find statistically positive or negative coefficients on the variables
mentioned above. On the one hand, in response to school shootings, communities may
respond with more vigilance, as evidenced by the widespread implementation of ALICE
protocols in schools, increasing gun acquisition rates. On the other hand, communities may
respond by purchasing fewer firearms, diverting resources to fund mental health initiatives,
and rehabilitative resources.
For causal identification, I assume that school shootings are exogenous. Depending on
the school shooting scale, school shootings become the headlines of major news outlets and
often shock a community social order, albeit many Americans, given the frequency of school
shootings, have become desensitized to such news (Person, 2019). Given the shock school
shootings induce upon communities, it can be assumed there is an element of surprise in
such events. Therefore, I assume that my event study will capture an exogenous shock
to the social order and capture the actual change in gun purchases in the aftermath of a
school shooting. Further, I assume that a school shooting’s effects will solely be captured
by changes in gun-ownership rates conditional on the control variables, considering that my
control variables will capture any confounding events that influence gun ownership rates.
There are, however, several threats to the identification. First, with its considerable
lobbying influence in D.C., the NRA has limited data collection and gun-related research
(Raphelson, 2018). Thus, NICS data is not the best proxy for gun ownership rates, resulting
in measurement error of my dependant and independent variables. As NICS records all gun
permit applications they receive, without regard to whether an individual is issued a license
or not, the NICS data does not reflect the actual number of gun purchases in the United
States. For example, guns can and are obtained through illegal means (Raphelson, 2020).
Furthermore, individuals who purchase firearms from a person’s home, internet, or gun
show are not subject to a background check Raphelson (2020). Such sales are thus not
included in the NICS dataset (Raphelson, 2020). Second, some states, including Califor-
nia, make it harder for individuals to acquire firearms, including enacting stricter firearm
legislation, mandatory firearm use training, and enhanced background checks (Raphelson,
2020). The factors mentioned above will lead to measurement errors in my dependant and
independent variables.
9A Extensions and Robustness Checks to Main Results
A.1 Robustness Check: Google Trends Data
To supplement my main results, which uses NICS data as a proxy for gun ownership rates,
I estimate a level-log event-study state-year-month fixed-effects framework, using Google
search data as my dependant variable:
6
X −1
X
Searchit = βk ln(Searchit+k ) ∗ Cit + γk ln(Searchit+k ) ∗ Cit + δi + σt + εit (2)
k=1 k=−6
The indexes subscripts and variables are the same as equation 1 besides the coefficient
Search and its indexing variable k. The variable Search is the log of the mean value of ”hits”
for all term searches for a given state, month, and year, calculating the average number of
”hits” for all search terms for guns for a given state and all periods that Google Trends has
data on. k indexes the average number of search ”hits” for gun manufacturers and models six
months before and after a school shooting, excluding the school shooting month and year of
the school shooting to avoid perfect multi-collinearity. As Google Trends began calculating
its data most accurate data starting in 2004, I restrict my analysis periods from January
2004 to December 2019 in monthly increments indexed by i.
For this event-study analysis, I do not seek to find a causal linkage between gun ownership
rates in the aftermath of school shootings. I strive to explore the relationship between Google
searches for terms before and after a school shooting, supplementing my main results, given
the issues with Google Trends data.
There are several issues with the Google Search index, which will bias my results. First,
approximately fifteen percent of the U.S. population do not have access to the internet,
implying that Google searches cannot truly represent the actual number of interest in guns
and firearm acquisitions (Lam, 2018). Second, searching for a term does not mean that an
individual seeks to buy a firearm without knowing the motivations for such searches, the
best conclusion that can be made from Google Trends data is American peoples’ interest in
firearms. Thus, I use Google Trends as a proxy for Americans’ interest in firearms.
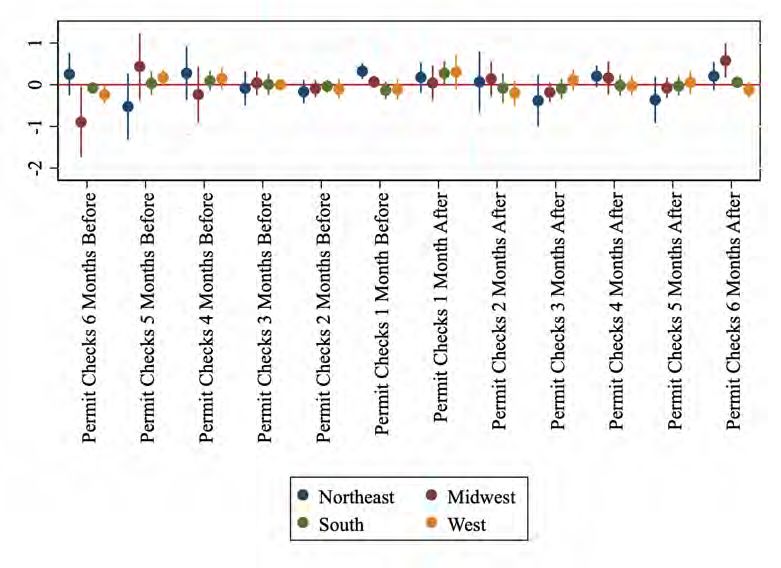
A.2 Extension to Main Results: Census Regions
Complementing my primary analysis of Event Study Framework 1, I estimate the hetero-
geneous effects of background checks for firearms by the four census regions (Agnich, 2014).2
2
The Census divides up the United States into four different areas. The Northeast region consists of
Connecticut, Maine, Massachusetts, New Hampshire, Rhode Island, Vermont, New Jersey, New York, &
10I estimate regression 1 but estimating four separate regressions based on the Census region.
A.3 Extensions to Main Results: County Demographics
Complementing my analyses, I seek to explore whether county demographics of where
a school shooting occurred impacts the number of firearm acquisition rates. I estimate two
event study analyses similar to that of framework 1, stratifying my sample into schools
located in majority-white and Black counties.
A.4 Extensions to Main Results: The Predictive Ability of Google Trends
Similar to that of framework 1, I seek to explore the relationship between permit appli-
cations and Google searches with Event Study Framework 3 with the following equation:
6
X −1
X
ln(Searchit ) = βk ln(P ermitit+k ) ∗ Cit + γk ln(P ermitit+k ) ∗ Cit + δi + σt + εit (3)
k=1 k=−6
The model variables and assumptions are the same as the analyses above.
IV Results
A Main Results
Figure 3 and Table 4 highlight the results of Event Study Framework 1. Consistent with
prior literature, I find that in the month following a school shooting, firearm acquisition rates
increases by up to 32% (pguns as measured by Google search data shows that firearms’ interest increases by 0.0123 index points (p
Second, schools located in a majority POC neighborhoods may experience higher crime rates
and, thus, more exposure to firearms (Hipp, 2007). To counter this issue, gathering data on
the demographics of each school and running my analyses with such data could yield more
economically meaningful results.

A.4   Predictive Ability of Google Trends

     Estimating the relationship between permit applications and Google searches, I find there
is little relationship between Google Searches for firearms and gun acquisitions, as evidenced
by 7. While there is a statistically coefficient in the month before a school shooting, implying
that a one-unit increase in one permit applications, increases Google Searches for firearms by
approximately 8%, when analyzing the coefficients in the months following a school shootings,
my statistically insignificant coefficients do not reveal a relationship between Google Searches
and gun permit applications.

V     Conclusion
    My study seeks to understand how communities respond to tragic events involving vio-
lence, analyzing school shootings’ impact on gun acquisition rates. Using data from NICS
and school shootings, I construct a novel data set, estimating an event-study analysis. In
line with existing literature, I find that in the month following a school shooting, NICS
background checks increases by 32% compared to the month of the school shooting. Despite
its data issues, my results reveal that Americans react similarly to school shootings, as they
do with mass shootings, responding with more vigilance and purchasing more firearms.
    Extending my analyses to heterogeneity across the four Census regions, I find little evi-
dence to suggest that region affects gun acquisition rates following a school shooting. How-
ever, I find weak evidence to suggest that schools located within majority-white counties
have higher levels of gun acquisition rates after a school shooting compared to majority-
Black counties.
    My study adds to existing research that touches on the relationship between firearm
acquisition rates and mass shootings, Google Trends data, and its predictive ability to fore-
cast future social events, including but not limited to unemployment rates (D’Amuri and
Marcucci, 2017; Lam, 2018; Nagao, Takeda and Tanaka, 2019).
    My results contribute to the existing literature on mass shootings and how society re-
sponds to them while also revealing new research questions. Given that firearm acquisition
rates increase in the months following a school shooting, it would be interesting to investigate
the cascading effects of increased firearm acquisitions, researching whether such increases in

                                              13
firearms cause more or less social turbulence. Furthermore, other avenues of research could
stratify my analysis at the county-state level, accounting for the additional variation of
firearm purchases at the county level.
When viewed in conjunction with existing literature that has documented the positive
relationship between firearms and gun violence, my results suggest that lawmakers should en-
act stringent gun control legislation, closing the loopholes that allow individuals to purchase
firearms (Raphelson, 2018; Reeping et al., 2019).
14References
Abouk, Rahi, and Scott Adams. 2013. “School shootings and private school enrollment.”
Economics Letters, 118(2): 297–299.
Addington, Lynn A. 2003. “Students’ fear after Columbine: Findings from a randomized
experiment.” Journal of Quantitative Criminology, 19(4): 367–387.
Agnich, Laura E. 2014. “A Comparative Analysis of Attempted and Completed School-
Based Mass Murder Attacks.” American Journal of Criminal Justice, 40(1): 1–22.
Candipan, Jennifer. 2019. “Neighbourhood change and the neighbourhood-school gap.”
Urban Studies, 56(15): 3308–3333.
Center, Giffords Law. 2020. “NICS Reporting Procedures.”
CNN. 2019. “10 years. 180 school shootings. 356 victims.”
Davis, Patti. 2019. “America’s Schools Are War Zones Now.”
D’Amuri, Francesco, and Juri Marcucci. 2017. “The predictive power of Google
searches in forecasting US unemployment.” International Journal of Forecasting,
33(4): 801–816.
Friedman, David, Eva Jernegan, and Desmond O’Neill. 2020. “About.”
Hipp, John R. 2007. “Income Inequality, Race, And Place: Does The Distribution Of Race
And Class Within Neighborhoods Affect Crime Rates?” Criminology, 45(3): 665–697.
Kaste, Martin. 2021. “Did Record Gun Sales Cause A Spike In Gun Crime? Researchers
Say It’s Complicated.”
Kramer, Margaret, and Jennifer Harlan. 2019. “Parkland Shooting: Where Gun Con-
trol and School Safety Stand Today.”
Kumar, Induja. 2020. “Coronavirus Has Stopped School Shootings, But Not Gun Vio-
lence.”
Kwon, Ik-Whan G., and Daniel W. Baack. 2005. “The Effectiveness of Legislation
Controlling Gun Usage.” American Journal of Economics and Sociology, 64(2): 533–547.
Lam, Onyi. 2018. “What Google searches can tell us about Americans? interest in guns.”
Liu, Gina, and Douglas J Wiebe. 2019. “A time-series analysis of firearm purchasing
after mass shooting events in the United States.” JAMA network open, 2(4): e191736–
e191736.
Luca, Michael, Deepak Malhotra, and Christopher Poliquin. 2020. “The impact of
mass shootings on gun policy.” Journal of Public Economics, 181: 104083.
15Moore-Petinak, N’dea, Marika Waselewski, Blaire Alma Patterson, and Tammy
Chang. 2020. “Active Shooter Drills in the United States: A National Study of Youth
Experiences and Perceptions.” Journal of Adolescent Health, 67(4): 509 – 513.
Muschert, Glenn W. 2007. “Teaching and Learning Guide for: Research in School Shoot-
ings.” Sociology Compass, 1(2): 840–846.
Nagao, Shintaro, Fumiko Takeda, and Riku Tanaka. 2019. “Nowcasting of the U.S.
unemployment rate using Google Trends.” Finance Research Letters, 30: 103–109.
O’Regan, Sylvia Varnham. 2020. “The Company Behind America’s Scariest School
Shooter Drills.”
Person. 2019. “Five mass shootings in five days: Is America officially desensitized to gun
violence?”
Porfiri, Maurizio, Raghu Ram Sattanapalle, Shinnosuke Nakayama, James
Macinko, and Rifat Sipahi. 2019. “Media coverage and firearm acquisition in the af-
termath of a mass shooting.” Nature human behaviour, 3(9): 913–921.
Raphelson, Samantha. 2018. “How The NRA Worked To Stifle Gun Violence Research.”
Raphelson, Samantha. 2020. “8 facts about gun control in the US.”
Reeping, Paul M, Magdalena Cerdá, Bindu Kalesan, Douglas J Wiebe, San-
dro Galea, and Charles C Branas. 2019. “State gun laws, gun ownership, and mass
shootings in the US: cross sectional time series.” British Medical Journal, l542.
Rostron, Allen. 2018. “The Dickey Amendment on Federal Funding for Research on Gun
Violence: A Legal Dissection.” American Journal of Public Health, 108(7): 865–867.
Studdert, David M, Yifan Zhang, Jonathan A Rodden, Rob J Hyndman, and
Garen J Wintemute. 2017. “Handgun acquisitions in California after two mass shoot-
ings.” Annals of internal medicine, 166(10): 698–706.
Suomalainen, Laura, Henna Haravuori, Noora Berg, Olli Kiviruusu, and Mauri
Marttunen. 2011. “A controlled follow-up study of adolescents exposed to a school
shooting–Psychological consequences after four months.” European Psychiatry, 26(8): 490–
497.
Vossekuil, Bryan, Robert A Fein, Marisa Reddy, Randy Borum, and William
Modzeleski. 2004.
Waldman, Michael. n.d.. “How the NRA Rewrote the Second Amendment.”
Wallace, Lacey N. 2014. “Castle Doctrine Legislation: Unintended Effects for Gun Own-
ership?” Justice Policy Journal, 11(2): 1–17.
Woolf, Christopher. 2017. “The origins of the Second Amendment.”
16Figures
Figure 1: Total Casualties from School Shootings between November 1998 - May 2020
Source: SSDB.
17Figure 2: School Shooting Count by Year in the United States
Source: SSDB.
Figure 3: School Shooting Map
Source: SSDB. Each circle represents a school shooting, while the size of the circle denotes the magnitude
of the school shooting. The data spans from January, 1970 to May, 2020
18Figure 4: Event Study Framework (1)
Source: SSDB Database. Event Study Analysis (1) conducted using NICS data as a proxy for gun acquisition
rates.
19Figure 5: Event Study Analysis using Google Trends Data (2)
Event Study Analysis conducted using Google Trends data as a proxy for Americans’ gun-ownership rates
and/or gun interest.
20Figure 6: Event Study Analysis by Census Region (3)
Event Study Analysis by the four Census regions using NICS data.
21Figure 7: Event Study Analysis by County Demographics (4)
Event Study Analysis by County Demographics.
22Figure 8: Predictive Ability of Google Trends
Event Study Analysis: Predictive Ability of Google Trends.
23Tables
Table 1: Summary Statistics I
Variable Mean Std. Dev. Min. Max. N
Number of Background Checks 25522.57 38256.97 1 541978 12232
Permit Checks Total (log) 9.47 1.29 0 13.2 12232
Permit Checks 6 Months Before (log) 9.43 1.33 0 13.2 12232
Permit Checks 5 Months Before (log) 9.45 1.3 0 13.2 12232
Permit Checks 4 Months Before (log) 9.46 1.3 0 13.2 12232
Permit Checks 3 Months Before (log) 9.46 1.29 0 13.2 12232
Permit Checks 2 Months Before (log) 9.47 1.29 0 13.2 12232
Permit Checks 1 Month Before (log) 9.47 1.29 0 13.2 12232
Permit Checks 1 Month After (log) 9.48 1.29 0.69 13.2 12232
Permit Checks 2 Months After (log) 9.48 1.29 0.69 13.2 12232
Permit Checks 3 Months After (log) 9.49 1.29 0.69 13.2 12232
Permit Checks 4 Months After (log) 9.49 1.29 0 13.2 12232
Permit Checks 5 Months After (log) 9.49 1.29 0 13.2 12232
Permit Checks 6 Months After (log) 9.5 1.29 0 13.21 12232
Total # of Casualties 1.5 2.67 0 35 722
Casualty Dummy 0.05 0.21 0 1 12232
Permit Checks 6 Months Before (Interaction) 0.48 2.19 0 13.2 12232
Permit Checks 5 Months Before (Interaction) 0.48 2.19 0 12.93 12232
Permit Checks 4 Months Before (Interaction) 0.48 2.19 0 12.93 12232
Permit Checks 3 Months Before (Interaction) 0.48 2.2 0 12.94 12232
Permit Checks 2 Months Before (Interaction) 0.48 2.2 0 12.93 12232
Permit Checks 1 Month Before (Interaction) 0.49 2.2 0 12.95 12232
Permit Checks 1 Month After (Interaction) 0.49 2.2 0 13.2 12232
Permit Checks 2 Months After (Interaction) 0.49 2.2 0 13.11 12232
Permit Checks 3 Months After (Interaction) 0.48 2.2 0 13.11 12232
Permit Checks 4 Months After (Interaction) 0.48 2.2 0 13.11 12232
Permit Checks 5 Months After (Interaction) 0.48 2.2 0 13.09 12232
Permit Checks 6 Months After (Interaction) 0.48 2.2 0 13.21 12232
People of Color (=1 if Majority Black) 1 0 1 1 250
People of Color (=0 if Majority White) 0 0 0 0 306
Source: NICS, U.S. Census Bureau Intercensal County Population Data, & SSDB Database. Analysis time
period ranges from January 2000 to December 2019.
24Table 2: Summary Statistics II
Variable Mean Std. Dev. Min. Max. N
Mean Hits 10.46 5.19 0 39.92 8536
Mean Hits 6 Months Before (log) 2.16 0.63 -0.84 3.69 8536
Mean Hits 5 Months Before (log) 2.17 0.63 -0.84 3.69 8536
Mean Hits 4 Months Before (log) 2.18 0.62 -0.84 3.69 8536
Mean Hits 3 Months Before (log) 2.18 0.61 -0.84 3.69 8536
Mean Hits 2 Months Before (log) 2.19 0.6 -0.84 3.69 8536
Mean Hits 1 Month After (log) 2.21 0.57 -0.84 3.69 8536
Mean Hits 2 Months After (log) 2.22 0.57 -0.84 3.69 8536
Mean Hits 3 Months After (log) 2.22 0.56 -0.84 3.69 8536
Mean Hits 4 Months After (log) 2.23 0.56 -0.84 3.69 8536
Mean Hits 5 Months After (log) 2.23 0.55 -0.84 3.69 8536
Mean Hits 6 Months After (log) 2.24 0.54 -0.73 3.69 8536
Casualty Dummy 0.05 0.23 0 1 8536
Total # of Casualties 1.53 2.78 0 35 591
Permit Checks 6 Months Before (Interaction) 0.12 0.53 0 3.47 8536
Permit Checks 5 Months Before (Interaction) 0.12 0.53 -0.69 3.51 8536
Permit Checks 4 Months Before (Interaction) 0.12 0.53 -0.71 3.62 8536
Permit Checks 3 Months Before (Interaction) 0.13 0.54 0 3.69 8536
Permit Checks 2 Months Before (Interaction) 0.13 0.54 0 3.62 8536
Permit Checks 1 Month Before (Interaction) 0.13 0.54 0 3.68 8536
Permit Checks 1 Month After (Interaction) 0.13 0.54 0 3.48 8536
Permit Checks 2 Months After (Interaction) 0.13 0.54 0 3.55 8536
Permit Checks 3 Months After (Interaction) 0.13 0.54 0 3.6 8536
Permit Checks 4 Months After (Interaction) 0.13 0.54 0 3.58 8536
Permit Checks 5 Months After (Interaction) 0.13 0.53 -0.34 3.62 8536
Permit Checks 6 Months After (Interaction) 0.13 0.53 0 3.47 8536
Source: Google Trends, U.S. Census Bureau Intercensal County Population Data, & SSDB Database. Anal-
ysis time period ranges from January 2004 to December 2019.
25Table 3: Event Study (1)
(1)
Permit Checks
Permit Checks 6 Months Before -0.121∗
(0.0494)
Permit Checks 5 Months Before 0.0633
(0.0670)
Permit Checks 4 Months Before -0.0672
(0.0955)
Permit Checks 3 Months Before -0.0411
(0.0487)
Permit Checks 2 Months Before -0.0556
(0.0453)
Permit Checks 1 Month Before 0.0781
(0.0614)
Permit Checks 1 Month After 0.320∗∗
(0.0959)
Permit Checks 2 Months After -0.157
(0.0884)
Permit Checks 3 Months After -0.0958
(0.0759)
Permit Checks 4 Months After -0.00113
(0.0712)
Permit Checks 5 Months After -0.0441
(0.0463)
Permit Checks 6 Months After 0.122
(0.0618)
Constant 9.472∗∗∗
(0.000836)
Observations 12232
Adjusted R2 0.956
Standard errors in parentheses and are cluster-robust at the state level.
∗
p < 0.05, ∗∗ p < 0.01, ∗∗∗ p < 0.001
26Table 4: Event Study Framework using Google Trends Data (2)
(1)
(mean) Hits
Permit Checks 6 Months Before 0.510
(0.440)
Permit Checks 5 Months Before -1.002∗
(0.383)
Permit Checks 4 Months Before 0.563
(0.325)
Permit Checks 3 Months Before -0.502
(0.389)
Permit Checks 2 Months Before 0.106
(0.507)
Permit Checks 1 Month Before 1.245∗
(0.560)
Permit Checks 1 Month After 0.245
(0.606)
Permit Checks 2 Months After -0.148
(0.432)
Permit Checks 3 Months After 0.266
(0.441)
Permit Checks 4 Months After 0.0847
(0.458)
Permit Checks 5 Months After -0.561
(0.476)
Permit Checks 6 Months After -0.941∗
(0.394)
Constant 10.48∗∗∗
(0.00572)
Observations 8536
Adjusted R2 0.822
Standard errors in parentheses and are cluster-robust at the state level.
∗
p < 0.05, ∗∗ p < 0.01, ∗∗∗ p < 0.001
27Table 5: Extension to Main Results: Census Regions (3)
(1) (2) (3) (4)
Northeast Midwest South West
Permit Checks 6 Months Before 0.255 -0.891∗ -0.0765 -0.237∗
(0.223) (0.386) (0.0471) (0.0937)
Permit Checks 5 Months Before -0.524 0.435 0.0319 0.173
(0.346) (0.367) (0.129) (0.0812)
Permit Checks 4 Months Before 0.276 -0.235 0.0936 0.153
(0.280) (0.306) (0.109) (0.114)
Permit Checks 3 Months Before -0.0841 0.0407 0.00748 0.000920
(0.177) (0.131) (0.117) (0.0510)
Permit Checks 2 Months Before -0.164 -0.0930 -0.0349 -0.104
(0.121) (0.0904) (0.0713) (0.108)
Permit Checks 1 Month Before 0.326∗∗ 0.0698 -0.135 -0.112
(0.0787) (0.0651) (0.0985) (0.113)
Permit Checks 1 Month After 0.176 0.0418 0.276 0.302
(0.160) (0.190) (0.141) (0.188)
Permit Checks 2 Months After 0.0701 0.142 -0.0814 -0.194
(0.318) (0.194) (0.170) (0.135)
Permit Checks 3 Months After -0.382 -0.180 -0.0956 0.113
(0.268) (0.107) (0.113) (0.118)
Permit Checks 4 Months After 0.205 0.164 -0.0175 -0.0267
(0.111) (0.183) (0.119) (0.107)
Permit Checks 5 Months After -0.361 -0.0742 -0.0281 0.0542
(0.241) (0.112) (0.109) (0.127)
Permit Checks 6 Months After 0.207 0.578∗∗ 0.0594 -0.125
(0.147) (0.186) (0.0665) (0.0854)
Observations 2178 2904 4004 3146
Adjusted R2 0.975 0.950 0.948 0.960
Standard errors in parentheses and are cluster-robust at the state level.
∗
p < 0.05, ∗∗ p < 0.01, ∗∗∗ p < 0.001
28Table 6: Extension to Main Results: County Demographics (4)
(1) (2)
Majority POC Majority White
Permit Checks 6 Months Before -0.497 -0.112
(0.305) (0.0966)
Permit Checks 5 Months Before 0.267 -0.258
(0.151) (0.140)
Permit Checks 4 Months Before -0.435∗ 0.299∗
(0.170) (0.147)
Permit Checks 3 Months Before -0.126 -0.0778
(0.119) (0.125)
Permit Checks 2 Months Before -0.110 -0.0954
(0.209) (0.176)
Permit Checks 1 Month Before 0.236 -0.106
(0.148) (0.120)
Permit Checks 1 Month After 0.561∗∗ 0.646∗∗∗
(0.160) (0.0633)
Permit Checks 2 Months After -0.109 -0.213
(0.249) (0.212)
Permit Checks 3 Months After 0.184 -0.255
(0.169) (0.193)
Permit Checks 4 Months After -0.0913 0.0988
(0.171) (0.180)
Permit Checks 5 Months After -0.132 -0.228
(0.113) (0.174)
Permit Checks 6 Months After 0.259 0.304∗
(0.154) (0.117)
Constant 10.35∗∗∗ 10.32∗∗∗
(0.0264) (0.0307)
Observations 250 306
Adjusted R2 0.950 0.955
Standard errors in parentheses and are cluster-robust at the state level.
∗
p < 0.05, ∗∗ p < 0.01, ∗∗∗ p < 0.001
29Table 7: Extension to Main Results: Predictive Ability of Google Trends (5)
(1)
ln(Search)
Permit Checks 6 Months Before -0.0380
(0.0650)
Permit Checks 5 Months Before -0.0661
(0.0793)
Permit Checks 4 Months Before -0.0188
(0.0669)
Permit Checks 3 Months Before 0.0112
(0.0947)
Permit Checks 2 Months Before 0.00264
(0.0703)
Permit Checks 1 Month Before 0.0349
(0.0731)
Permit Checks 1 Month After 0.0777∗
(0.0357)
Permit Checks 2 Months After -0.154
(0.0768)
Permit Checks 3 Months After 0.153
(0.0885)
Permit Checks 4 Months After -0.115
(0.0749)
Permit Checks 5 Months After 0.0677
(0.0877)
Permit Checks 6 Months After 0.0419
(0.0624)
Constant 2.144∗∗∗
(0.000582)
Observations 8955
Adjusted R2 0.772
Standard errors in parentheses and are cluster-robust at the state level.
∗
p < 0.05, ∗∗ p < 0.01, ∗∗∗ p < 0.001
30You can also read