Disruptions in Global Supply Chains and their Effects in Mexico's Regional Gross Output in the Context of the COVID-19 Pandemic
←
→
Page content transcription
If your browser does not render page correctly, please read the page content below
Disruptions in Global Supply Chains and their Effects in
Mexico’s Regional Gross Output in the Context of the
COVID-19 Pandemic*
June 2021

*/ The views expressed in this work are those of the authors and do not necessarily reflect those of Banco de México or its policy.

I. Introduction

II. Methodology

III. Identification of Supply Shocks in Imports of
 Intermediate Goods

IV. Results

V. Concluding Comments

 Determinantes de la Inflación 2
I. Introduction

n The first case of COVID-19 in Mexico was registered in February 27
 of 2020, more than two months after it was first identified in
 China (November 17, 2019), and about a month later of the first
 case detected in the United States (January 21, 2020).

n As the virus spread around the world, there was an increasing
 number of countries implementing, at different times, temporary
 closures of economic activity, which in turn led to disruptions in
 global supply chains [Yu et al, 2021; Guan et al, 2020; Kejzar y
 Velic, 2020; Ferreira et al, 2020].

n These disruptions could have affected, in turn, Mexican
 intermediate goods imports even before restrictions went into
 effect in April 1st of 2020. But how large they could have been?
 How sensitive are sectors and regions in Mexico to these shocks?
 3
I. Introduction: Motivation
n Imports of Intermediate goods (MIG) from:
 ü China Feb-Mar 2020 vs Feb-Mar 2019: - 12%
 ü United States April 2020 vs April 2019: -43%
 ü European Union April 2020 vs April 2019: -19%
 Annual Variation of Mexico’s Imports of Intermediate Goods
 Total Intermediate Goods Imports
 jan-20 feb-20 mar-20 apr-20 may-20 jun-20 jul-20 aug-20
 0%

 -10%

 -20%

 -30%

 -40%

 -50%

 -60%

 -70%

 TOTAL China USA Europe
 Source: Banco de México
 4
I. Introduction: Motivation
n Imports of Motor vehicle parts from:
 ü China Feb-Mar 2020 vs Feb-Mar 2019: - 58%
 ü United States April 2020 vs April 2019: -88%
 ü European Union April 2020 vs April 2019: -48%
 Annual Variation of Mexico’s Imports of Intermediate Goods
 Motor Vehicle Parts Imports
 jan-20 feb-20 mar-20 apr-20 may-20 jun-20 jul-20 aug-20
 40%

 20%

 0%

 -20%

 -40%

 -60%

 -80%

 -100%

 -120%

 Total China USA Europe

 Source: Banco de México
 5
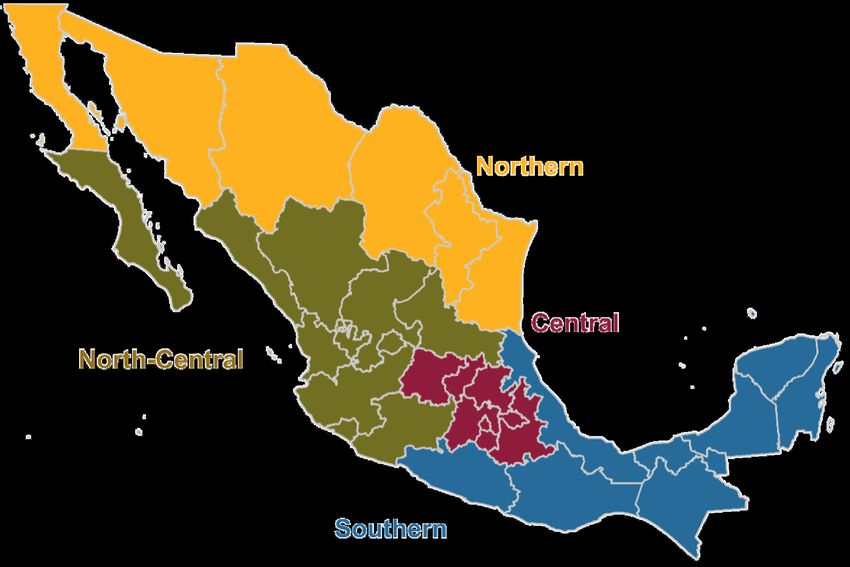
I. Introduction: Motivation
n We focus on how the initial disruption in the supply of MIG
 resulting from the pandemic, affected regional gross output in
 Mexico.
 Regional Manufacturing Production, 2019
 Regions Share of regional Share of regional
 Share of Regional
 Automotive Industry
 Manufacturing GDP Manufacturing GDP
 GDP in the National
 in Total GDP of the in National
 Automotive Industry
 region Manufacturing GDP
 GDP 1/
 Northern 26.2 37.6 39.2
 Central
 16.9 19.3 18.9
 North
 Central 14.4 34.4 41.8
 Southern 8.5 8.8 0.08*/
 National 16.7 100.00 100.00
 Source: INEGI
 1/ The estimated data for the automotive industry is based on INEGI’s 2018 Economic Census.
 The other estimates use the 2019 National Accounts data.
 */The Southern region has some Motor Vehicle Parts Manufacturing.

 At least one Car Assembler

 Source: Banco de México and Automotive News

 6
I. Introduction: Motivation
 n We assume that disruptions in regional MIG in Mexico emerged from reductions
 in MIG from China, the United States and the European Union; and these
 disruptions interfered, in turn, with the regional output of other goods and
 services.

 n The shock in Chinese MIG capture more closely a supply-side disruption. Those
 from the EU and the US may be capturing also demand side disruptions.
 However, we will treat the contractions in the latter also as supply side shocks.

Supply Shocks February March April
 (China) (China) (USA and EU)

Demand Shocks ?

 6
I. Introduction: Motivation

• A key aspect of our work has to do with estimating MIG at the
 regional level, as they are not available for the case of Mexico.
 We indicate ahead how we tackled this issue.

• We use Regional Input-Output Matrices to derive the effects
 on Gross Output at the sectoral, regional and national levels
 in Mexico, which could have resulted from the supply shock in
 MIG due to the pandemic.

 8
I. Introduction

II. Methodology

III. Identification of Supply Shocks in Imports of
 Intermediate Goods

IV. Results

V. Concluding Comments

 Determinantes de la Inflación 9
II. Methodology

n We use the Ghosh Supply Model, which proposes that sector Gross Output
 in region R equals the sum of regional consumption of intermediate goods
 produced in such region, plus value added, taxes, purchases of
 intermediate goods from other regions, and imports of intermediate goods:

n For a regional economy with “n” goods, the above can be expressed in
 matrix notation as:
 Intersectoral trade of goods and services within
 region R: ! is the “allocation matrix”, containing the
 proportions of sales of sector i to sector j

 = + (1)

 Row vector of value added, taxes, purchases
 Row vector of sectoral
 of inputs to other regions, and imports of
 Gross Output in region R
 intermediate goods by sector in region R.

 8
II. Methodology

n Solving (1) for ! :

 Row vector of sectoral imports of
 intermediate goods, in region R

 = ( − )" (2)

 Row vector of sectoral !
 Inverse Ghosh Matrix, with elements "#
Gross Output in region R which indicate the change in Gross Output of
 sector j in region R given a unit change in .

 !
 "# are known as the input multipliers.

 9
I. Introduction

II. Methodology

III. Identification of Supply Shocks in Imports of
 Intermediate Goods

IV. Results

V. Concluding Comments

 Determinantes de la Inflación 12
III. Identification and Allocation of Supply
 Shocks in Imports of Intermediate Goods
n Since there is no data of MIG ( ! ) by country at the state level, two
 assumptions were made: (1) The structure of MIG by country at the
 regional level equals the structure of country imports at the national
 level:

 !",$ = !%,$ ∗ !" (3)
 1
 MIG of sector i in region R MIG of sector i in region
 from country C R. Data obtained from
 Share of MIG from Regional Input-Output
 country C in national MIG Matrices

 (2) Percentage changes in regional MIG of sector i from country
 “C” are equal to the percentage changes in MIG of sector i at the
 national level for each sector :
 2 ∆% !" = ∆% !# (4)
 11
III. Identification and Allocation of Supply
 Shocks in Imports of Intermediate Goods
n The previous assumptions and the use of the Regional Input-Output
 Matrices imply that the effects in Gross Output stemming from the
 shock in MIG by sector and region depend on the structure of Gross
 Output according to how intensive is each region in the use of MIG
 by sector.

 ü For instance, a disruption in Motor vehicle parts imports will have a larger
 effect in the overall economy of a region in which Motor vehicle
 manufacturing has a greater weight (i.e., Northern, and Central), relative
 to those in which such activity is less relevant (South).

 12
III. Identification and Allocation of Supply
 Shocks in Imports of Intermediate Goods
n The initial “supply” shock is defined as the contraction in MIG at
 the start of the pandemic, and is given by the three shocks :

 D- MIGiChina
 D- MIGiUSA D- MIGiEU
 Feb-Mar 2020 vs.
 April 2020 vs. April 2019 April 2020 vs. April 2019
 Feb-March 2019

 ∆ !",$ = ∆% !%,$ ∗ !",$ (5)

 Changes in the value of MIG of Value of MIG of sector i in
sector i in region R from country C. region R from country C
 Percentage changes in MIG of sector i
 at the national level, from country C.

 13
III. Identification and Allocation of Supply
 Shocks in Imports of Intermediate Goods
n Once the shock in monetary terms in the value of MIG is
 identified, we apply the Ghosh Matrix.

n The effects in Gross Output in sector j given a change in the
 !,+
 value of MIG of sector i from country C (∆ () ) are calculated as:

 ",& ",& "
 ∆ !$ = ∆ ! ∗ !$ (6)

 14
III. Identification and Allocation of Supply
 Shocks in Imports of Intermediate Goods

n The total effect in gross output of sector j as a result of the initial
 disruptions in the intermediate goods imports of all sectors from
 United States, China and the European Union in a given region is
 calculated as:

 ) +
 Sum of the effects in sector j’s
 %,&
 (7) $% = # # ∆ *$ Gross Output due to the
 interruption in sector i’s supply
 &'( *'( of inputs from country C.

 Total effect in sector j’s Gross Output
 in region R as a result of the initial
 interruption in the supply chains of
 all sectors that supply production
 inputs to sector j.

 15
I. Introduction

II. Methodology

III. Identification of Supply Shocks in Imports of
 Intermediate Goods

IV. Results

V. Concluding Comments

 Determinantes de la Inflación 18
IV. Results
 Graph 1
 Contributions of Disruptions in the Supply Chains of China, the European
 Union and United States to México’s Gross Output Contraction
 Percentage points

 European Union China United States Total
 0.0
 -0.1
 -0.4
 -1.0

 -2.0
 -2.1

 -3.0 -2.7

 Source: Own estimates.

 17
IV. Results

 Graph 2 Graph 3
 Estimated Fall in Regional's Gross Output due to the Regional Contribution to the Estimated Decrease in Domestic
 Contraction in Intermediate Goods Imports at the Beginning Gross Output Due to the Contraction in Intermediate
 of the Pandemic Goods Imports at the Beginning of the Pandemic
 Percentage points Percentage

 North
 Northern Central Central Southern National -4.4
 0

 -1 -0.7
 -30.5
 -2
 -50.3
 -2.2 -2.2
 -3 -2.7

 -4
 -14.8
 -5
 -5.0
 -6 Northern North Central Central Southern

Source: Own estimates. Source: Own estimates.

 18
IV. Results
 Graph 4
 Sector Contribution to the Estimated Contraction in Manufacturing Gross Output due
 to the Contraction in Intermediate Goods Imports at the Beginning of the Pandemic
 Percentage
 Northern
 Norte North
 CentroCentral
 Norte Central
 Centro Southern
 Sur National
 Nacional
 0 -0.2
 Motor Vehicle
 Manuf. -1 -1.7 -2.4
 Machinery, Electronic, -3.5
 -2 -4.1 -0.2 -4.0
 Electric Prods., and -0.3
 Transport Equip. Manuf. -5.4 -6.4
 (except auto sector) -3
 -6.5 -7.2
 -4 -1.2
 Petroleum and Coal
 Prods., Chemicals, -5 -9.5 -1.4 -1.8
 -0.7
 and Plastic and -0.3 -0.2
 Rubber Prods. -6 -0.3 -0.7 -0.6
 Manuf. -0.4 -0.3
 -7 -2.9 -0.5
 Primary Metal and
 Metal Prods. Manuf.
 -8
 -0.4
 -9 -0.4
 Other Manufacturing -0.4
 -10
 Source: Own estimates.

 19
I. Introduction

II. Methodology

III. Identification of Supply Shocks in Imports of
 Intermediate Goods

IV. Results

V. Concluding Comments

 Determinantes de la Inflación 22
V. Final Comments
n We identified heterogeneous regional effects of MIG shocks due to the
 initial transmission channel of the sanitary crisis.

n The Northern region was the most affected, and the Southern the least.

n The manufacturing sector showed, in turn, the largest contraction,
 particularly, Motor vehicle manufacturing.

n In the South, the largest relative effect was estimated in the Oil and
 carbon derivatives, chemistry, and plastic and rubber.

n These results imply that current global supply chains disruptions such as
 international logistic problems and microchips shortages, in the context of
 the COVID-19 pandemic, may be inducing heterogeneous responses in
 regional economic activity.

 21
V. Final Comments
n It must be kept in mind that for our shocks to capture disruptions in
 supply chains, we assume that they are not being influenced by demand
 side effects, something that may not be the case, particularly in the case of
 the US and the European Union.

n Hence, these results should be viewed as an estimate of a shock on
 economic activity that could have emerged as a consequence of the
 strong contraction in imports of intermediate goods, beyond that of other
 effects that may have had a preponderant role on output.

n Additionally, these results emerge from a model which implies that:
 ü The Leontief coefficients may vary arbitrarily
 ü Value added is assumed fixed
 ü Changes in final demand lead to changes in gross output, which in turn
 modify the allocation matrix.
 ü The economy retains the 2013 regional economic structure, as captured
 in the Regional Input-Output Matrices estimated by Banco de Mexico.

 22
VI. Additional comments
n In the previous presentation, we received some interesting feedback on the
 estimates presented here:

1. Find amplified effects since the disruptions in global chains are a common
 worldwide shock.
 Ø To consider shocks on other economies, we require a world input-output
 matrix, since this captures all trading relations between countries by sector.
 However, since we are interested in the effects in the Mexican regions, we
 consider shocks that may have affected the Mexican economy.
2. Fluctuations in the real exchange rate may have triggered some demand
 effects.
 Ø Although the shocks on supply could be contaminated by shocks on demand,
 mainly in the case of the US and the EU given real exchange rate fluctuations,
 we think these effects are being softened since the value of imports of
 intermediate goods, measured in US dollars, were transformed to constant
 Mexican pesos using the averages of the FIX exchange rate and the GDP price
 deflator.

 22
Table 1
 Intermediate Goods Imports by Sector and Country of Origin
 Annual percentage change
 Feb-Mar 2020 vs.
 April 2020 vs. April 2019
 Feb-Mar 2019
 Sector
 United European
 China
 States Union
Mining (except Oil and Gas) - - -27.9
Electric Power Generation, Transmission and Distrib. -53.2 - -
Textile Mills and Textile Product Mills -46.2 -26.3 -30.7
Apparel and Leather and Allied Product Manufacturing -73.8 -41.7 -
Wood Produc Manufacturing -33.6 -26.6 -28.0
Paper Manufact / Printing and Related Support Activities -18.7 -2.0 -5.0
Petroleum and Coal Products, Chemicals, and Plastic and
 -39.8 -7.9 -19.0
Rubber Prods.
Nonmetallic Mineral Product Manufacturing -43.9 -16.5 -18.4
Primary Metal and Metal Product Manufacturing -39.7 -22.2 -14.9
Mach., Electron., Electric Prods, and Transp. Equip. (except
 -56.6 -26.8 -8.9
Motor Vehicle Parts)
Motor Vehicle Parts Manufacturing -87.8 -48.4 -58.4
Furniture and Related Product Manufacturing -55.5 -28.8 -26.0
Miscellaneous Manufacturing -27.5 -15.8 -42.1
No te: Empty spaces indicate the secto r did no t have any effet o r had an increase in impo rts o f intermediate go o ds in the
perio d analyzed. To classify by SCIA N secto rs, the TIGIE-SCIA N 2019 Co rrelatio n Table fro m INEGI was used.

So urce: P repared by B anco de M éxico with data fro m SA T, SE, B anco de M éxico , INEGI. Co mmercial B alance o f Go o ds o f
M exico . SNIEG. Info rmatio n o f Natio nal Interest.

 24
You can also read