EAST AFRICAN REGIONAL ANALYSIS OF YOUTH DEMOGRAPHICS - GOV.UK
←
→
Page content transcription
If your browser does not render page correctly, please read the page content below

EAST AFRICAN
REGIONAL ANALYSIS OF
YOUTH DEMOGRAPHICS

                       I

EAST AFRICAN
REGIONAL ANALYSIS OF
YOUTH DEMOGRAPHICS

      May 2018
Disclaimer: This document is an output from a project funded by the UK Department for International Development (DFID) through the Research for
Evidence Division (RED) for the benefit of developing countries. However, the views expressed and information contained in it are not necessarily
       those of, or endorsed by DFID, which can accept no responsibility for such views or information or for any reliance placed on them.
Table of Contents
                   LIST OF FIGURES.................................................................................................VII

                   LIST OF TABLES...................................................................................................VIII

                   ABBREVIATIONS..................................................................................................IX

                   EXECUTIVE SUMMARY......................................................................................XI

                1. INTRODUCTION................................................................................................2

                2. RATIONALE, PROBLEM STATEMENT.............................................................4

                3. DEMOGRAPHY OF THE FOUR EAC COUNTRIES....................................8

                   3.1. Demographic Profiles .............................................................................. 8
                   3.2. Pathways to a Youth Bulge ................................................................... 10
                   3.3. Priority Policy Areas Necessary to Harness a
                        Sizeable Demographic Dividend .........................................................13

                4. YOUTH CHALLENGES IN THE EAC.............................................................15

                   4.1. Health Challenges for Youth....................................................................15

           		               Policy and programmatic responses to the health challenges.........16

                   4.2. Education.....................................................................................................17

           		               Policy and programme responses to education challenges............18

                   4.3. Economy, Employment and Job Creation.......................................... 20

           		               Actions to grow jobs in the EAC ......................................................... 22

                   4.4. Urbanisation............................................................................................. 24

           		                Policy and programme responses to challenges of urbanisation..24

                5. FUTURE SCENARIOS...................................................................................... 26

                   5.1. Population projections............................................................................. 26

                   5.2. Timing of the first Demographic Dividend............................................ 28

                   5.3. Future demands for services.................................................................... 31

           		              Demand for quality education and skills development..................... 31

           		              Demand for modern methods of contraception................................. 32

                            Youth not in "Employment, Education, or Trainings”.......................... 33

                6. MODELLING THE POTENTIAL IMPACT OF THE DEMOGRAPHIC
                   DIVIDEND IN EAST AFRICA.......................................................................... 35

                   6.1. DEMDIV results........................................................................................ 36
                        KENYA....................................................................................................... 37

           		              RWANDA.................................................................................................. 38

           		               TANZANIA............................................................................................... 39

           		              UGANDA.................................................................................................. 40

                   6.2. Business-as-Usual Scenario: What are the risks of inaction?.......... 41

                7. SUMMARY AND RECOMMENDATIONS............................................... 43
                  Recommendations to EAC governments: Priority Areas for Investment... 44

                   Recommendations to DFID and Development partners............................. 45

                                                                         East African Regional Analysis of Youth Demographics
                                                                                                                                           V
REFERENCES........................................................................................................ 48

             APPENDICES........................................................................................................ 52

                        APPENDIX 1: Methods ......................................................................... 52

                       APPENDIX 2: Population Projections................................................... 55

     		   APPENDIX 3: Summary Results on the Association
       		             between Fertility and Education, and Fertility
                       and Household Wealth............................................... 57

                        APPENDIX 4: Key Findings from Population Projections ................ 58

     		                 APPENDIX 5: The Demographic Window of Opportunity
                                    for Developing Countries in Advanced
                                    Demographic Transition............................................... 60

     		   APPENDIX 6: DemDiv Demographic Dividend Modelling
       		             Policy Scenarios and Variables for Kenya,
                      Rwanda, Tanzania,and Uganda................................ 61

VI          East African Regional Analysis of Youth Demographics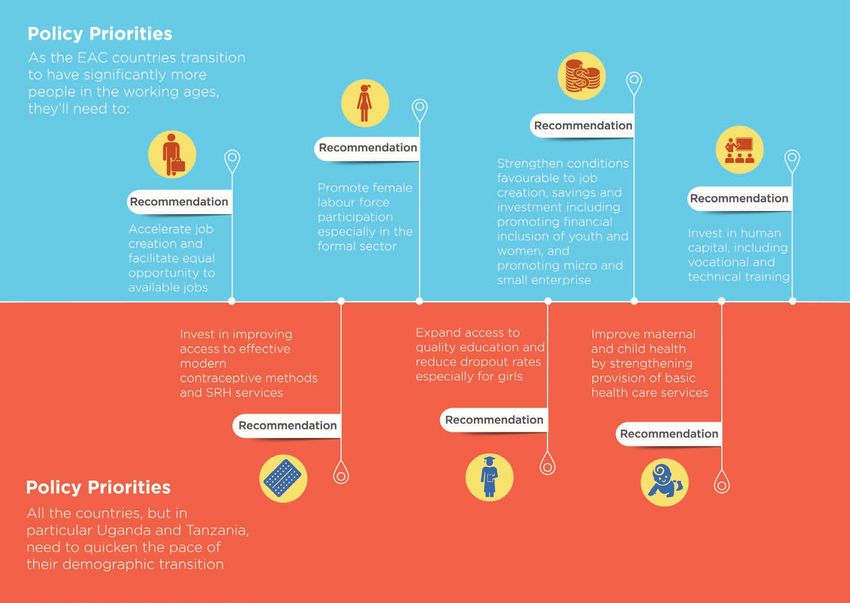
List of Figures
                  Figure 1: Africa’s share of the world population, 2015-2063.
                            UN Medium Variant Scenario, 2017 Revision and
                             share of Gross Domestic Product in 2015..................................... 5

                  Figure 2: Simplified Conceptual Framework: Youth Bulge and the
                            Demographic Dividend...................................................................... 6

                  Figure 3: Population pyramids of Kenya, Rwanda, Tanzania, and
                            Uganda compared with Malaysia and South Korea, 2015...... 9

                  Figure 4: Growth of global youth population (15-24 years), by regions of
                            the world. UN Medium Variant scenario, 2017 Revision...........10

                  Figure 5: Pathways to the youth bulge in East Africa.....................................11

                  Figure 6: Estimated changes in Senegal’s Support Ratio and
                            First Demographic Dividend, 1950-2050 (CREFAT, 2015).......12

                  Figure 7: Deaths per 10,000 youth population (10-24 years)...................15

                  Figure 8: Age-specific fertility rates for four EAC countries, DHS/MIS
                           2014-2016............................................................................................16
                  Figure 9: Unmet need for contraception among sexually
                            active 15-24 year old women by marital status,
                            DHS 2014 -16.................................................................................... 16

                  Figure 10: GDP growth rate trends for Kenya,
                             Rwanda,Tanzania and Uganda.................................................. 20

                  Figure 11: Projected population pyramids by 2050 for
                             the four EAC countries under varying scenarios...................... 28

                  Figure 12: Theoretical ratio of producers (20-64 years) to
                             young and old dependents (0 -19 and 65+)............................29

                  Figure 13: Rate of change in the theoretical support ratio
                            (Producers 20-64 years to Dependents 0-19 and 65+
                           years)................................................................................................... 29
                  Figure 14: Estimated number (thousands) of secondary
                             school places under two scenarios, 2015-2065..................... 31

                  Figure 15: Number of youth, 15-34 years (‘000s) in
                             need of modern contraception, 2015-2065............................ 32

                  Figure 16: Projected numbers of youth (‘000s) Not in Education,
                             Employment or Training [NEET] ................................................. 33

                  Figure 17: Kenya - Projected Per capita GDP (in US$).............................. 37

                  Figure 18: Kenya - Projected Human Development Index......................... 37

                  Figure 19: Rwanda - Projected Per capita GDP (in US$).......................... 38

                  Figure 20: Rwanda - Projected Human Development Index ................... 38

                  Figure 21: Tanzania - Projected Per capita GDP...........................................39

                  Figure 22: Tanzania- Projected Human Development Index.................... 39

                  Figure 23: Uganda - Projected Per capita GDP...........................................40
                  Figure 24: Projected Human Development Index.........................................40

                  Figure 25: Priority investment areas to harness the
                             demographic dividend ................................................................. 43
                  Figure 26: “Business-as-usual” or disinvestment in youth........................... 43

                                                                        East African Regional Analysis of Youth Demographics
                                                                                                                                          VII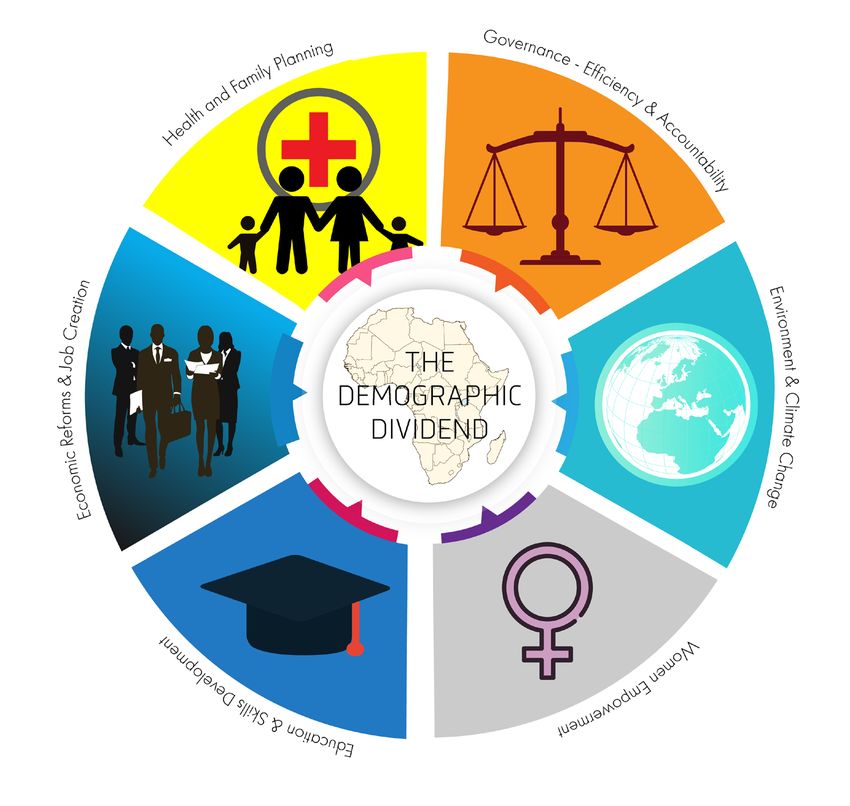
List of Tables
   Table 1: Demographic profiles of EAC countries.......................................... 8

   Table 2: Comparison of select socio-economic and demographic
            indicators for EAC countries, Malaysia and South Korea............10

   Table 3: Health policies and their objectives targeting youth in the
            EAC........................................................................................................ 17

   Table 4: Enrolment rates in primary, secondary and tertiary institutions
            in the four countries............................................................................. 18

   Table 5: Education policies and their objectives targeting youth
            in the EAC............................................................................................. 19
   Table 6: Youth unemployment rates in the EAC............................................ 21

   Table 7: Ranking EAC countries on economic competitiveness............... 22
   Table 8: Employment and related policies and their objectives
             targeting youth in the EAC............................................................... 22

   Table 9: Selected current and projected urbanisation indicators
            in the four countries..............................................................................24

   Table 10: Results - Scenario modelling...........................................................27
   Table 11: Key Characteristics of the Policy Scenarios
             used in the modelling........................................................................36

VIII         East African Regional Analysis of Youth Demographics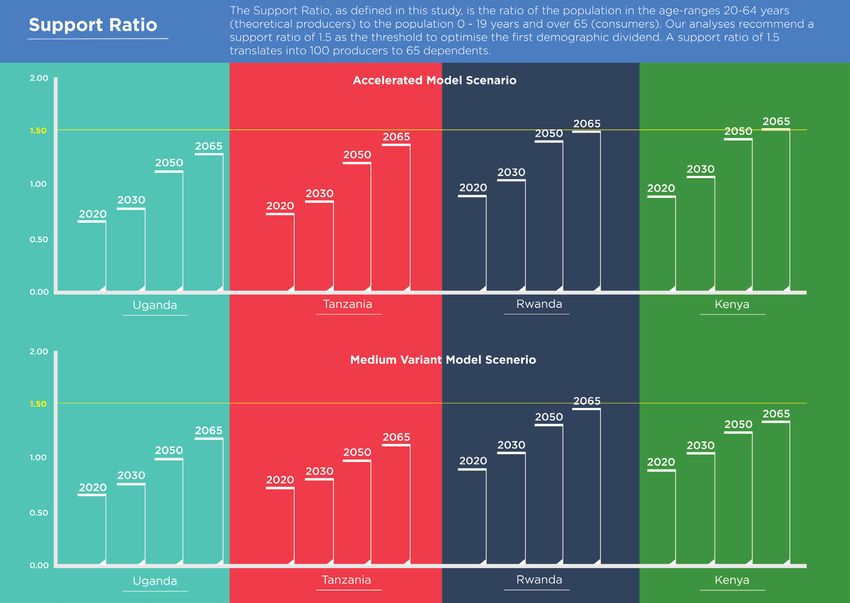
Abbreviations
 AFIDEP		     African Institute for Development Policy

 AU		         African Union

 AUC		        African Union Commission

 CPR		        Contraceptive Prevalence Rate

 CSOs		       Civil Society Organisations

 DD		         Demographic Dividend

 DFID		       UK Department for International Development

 DHS		        Demographic and Health Survey

 EAC 		       East African Community

 EARF		       East Africa Research Fund

 ECE 		       Early Childhood Education

 FDI		        Foreign Direct Investment

 FP		 Family Planning

 GAF 		       Gender Analysis Framework

 GCI		        Global Competitiveness Index

 GDP 		       Gross Domestic Product

 HDI 		       Human Development Index

 HIV/AIDS		   Human Immuno-deficiency Virus /Acquired Immuno-deficiency Syndrome

 HPP		        Health Policy Project

 ICT 		       Information and Communication Technology

 ILFS		       Integrated Labour Force Survey

 ILO		        International Labour Organisation

 IMR 		       Infant Mortality Rate

 JAB		        Joint Admissions Board

 LSMS		       Living Standards and Measurement Survey

 mCPR 		      Modern Contraceptive Prevalence Rate

 MDG 		       Millennium Development Goals

 MICS		       Multiple Indicator Cluster Surveys

 MMR		        Maternal Mortality Ratio

 NAYS		       National Adolescents and Youth Survey

 NBS		        National Bureau of Statistics

                                                               East African Regional Analysis of Youth Demographics
                                                                                                                      IX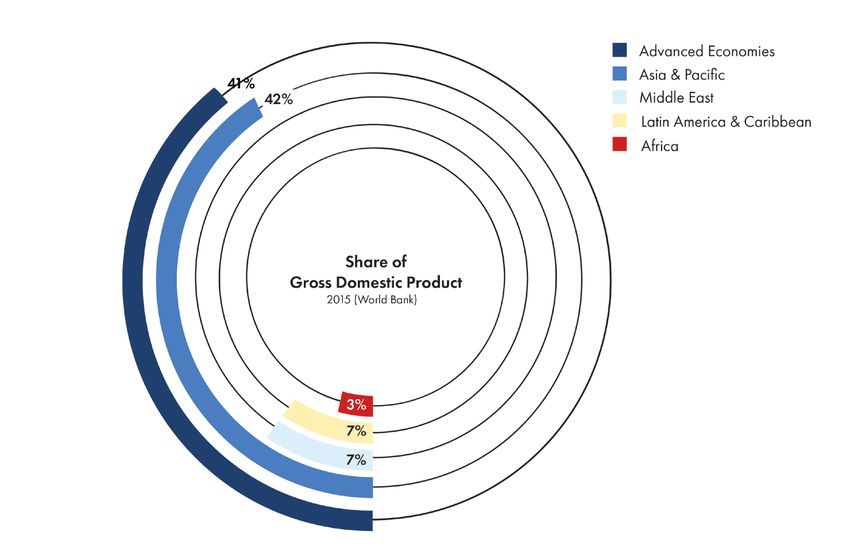
NCDs 		               Non-Communicable Diseases

     NEET 		               Not in Education, Employment or Training

     NER		                 Net Enrolment Rate

     NGOs		                Non-governmental Organisations

     NTA		                 National Transfer Accounts

     NYS		                 National Youth Service

     ReAYD		               Regional Analysis of Youth Demographics

     SDG		                 Sustainable development Goals

     SRH		                 Sexual and Reproductive Health

     SSA		                 Sub-Saharan Africa

     SWTS		                School to Work Transition Survey

     TFR		                 Total Fertility Rate

     TVET 		               Technical and Vocational Education and Training

     U5MR 		               Under-Five Mortality Rate

     UBEP		                Undugu Basic Education Programme

     UK		                  United Kingdom

     UN		                  United Nations

     UNDP 		               United Nations Development Programme

     UNFPA 		              United Nations Population Fund

     USAID		               United States Agency for International Development

     WEF 		                World Economic Forum

     WHO 		                World Health Organization

     YTCs		                Youth Training Centres

X   East African Regional Analysis of Youth Demographics
Executive Summary
According to the United Nations (UN) projections, the world’s population (developed by the United States Agency for International Development-
will reach 10 billion by 2055 and more than 95% of this growth will funded Health Policy Project implemented by Futures Group) to show,
happen in low and middle - income countries. Of the 2.45 billion people under different scenarios, the short, medium, and long-term implications
expected to be added to the global population between 2017 and of youth population dynamics on the countries’ socioeconomic status up
2055, more than 1.4 billion (57%) will be added in Africa. Decades of to 2050. Finally, we developed recommendations which bring together
very high fertility in Africa, coupled with rapidly declining child mortality evidence from the literature, data review, and the scenario modelling to
have created a population age-structure dominated by young people highlight the policy and implementation implications for each of the four
under the age of 25. The demographics of the East African Community countries and for the region, to benefit from the youth bulge.
(EAC), particularly those of Kenya, Rwanda, Tanzania and Uganda,
mirror those of Africa. Around 20% of the 127 million people in these four Future Youth Demographics in EAC Countries
countries are between the ages of 15 and 24, and can be labelled as
The results from the cohort component population projections show that
“youth” according to the United Nations definition. In the last population
in all the four countries, as indeed is the case for most African countries,
and housing censuses in the four countries conducted between 2009
there will be a significant increase in the total population for the next
and 2014, about 40% of the Rwandese population were children below
30-50 years, irrespective of what population and social development
the age of 15, and the corresponding percentages were 43% in Kenya,
policies the countries adopt. This is because the decades of high fertility
45% in Tanzania, and 52% in Uganda. Such youthful population, if
have created a high population momentum, implying that even if total
healthy, skilled, and gainfully employed, can be a catalyst for accelerated
fertility reached replacement level (2.1 children per woman) in the next
social and economic development. When the ratio of the working-age
few years, there will still be large numbers of women added to the pool
population to dependents increases, a window of opportunity opens for
of reproductive women every year. Childbearing among these women
accelerated economic growth, a phenomenon called the demographic
will add to the population size for several decades. However, the pace
dividend (DD).
of growth and the level at which the population will be stable can be
Economists have estimated that the demographic dividend contributed influenced by policies that countries make today. Under the UN Medium
25-33% to the Asian Tigers’ economic growth in the 1980s. However, Variant scenarioi, Rwanda’s youth population (age 15-34) will increase
the demographic dividend is not automatic. Firstly, a slow pace of fertility from 4.2 million in 2015 to 7.1 million in 2050 and 7.7 million by 2065;
decline is insufficient to open the window of opportunity to capture the in Kenya, the numbers will increase from 17 million in 2015 to 24 million
demographic dividend since the ratio of the working-age population to and 35 million in 2050 and 2065 respectively; in Tanzania, the change
young dependents will continue to be unfavourable. Secondly, even with will be from 17.9 million in 2015 to 47.4 million by 2050 and to 62.3
rapid declines in fertility and child mortality, countries can squander the million by 2065; while for Uganda the youth population will increase
opportunity if they do not invest in human capital and create an enabling from 23 million in 2015 to 38 million and 48 million by 2050 and 2065
environment for savings, investments, and creation of jobs. For example, respectively. Under the Accelerated Modelii, the corresponding growth
some economists have claimed that the demographic bonus has been of youth population by 2065 will be 7.2 million in Rwanda, 30 million
squandered by Tunisia and South Africa since their windows of opportunity in Kenya, 48 million in Tanzania, and 42 million in Uganda. It should be
are about to close. Critically, there should be equitable access to jobs for noted that except for Rwanda, none of the other EAC countries will reach
young people that is devoid of any form of discrimination or favouritism. replacement level fertility by 2065 under the Medium Variant Scenario.
Rather than the youth becoming catalysts for transformational development, Under the Accelerated Model, the most realistic scenario is that Rwanda
there is the real risk that, due to lack of strategic and timely action to and Kenya will reach replacement level fertility by 2065, but Uganda
invest in them in the EAC in particular and Africa in general, this youthful and Tanzania will have higher fertility. The consequences of the growth
population may become a major burden or even a threat to the continent’s in population size and high dependency ratio will be pressure on basic
security and economic development, with spill-over effects for the rest of services such as primary and secondary school places, health care,
the world. housing and infrastructure. Rapid population growth will also put pressure
on land, water, and other natural resources and this could contribute to
This report summarises the findings of research on the socioeconomic
food insecurity and resource-based conflicts.
implications of youth demographics in four East African Community (EAC)
countries namely: Kenya, Rwanda, Tanzania, and Uganda. For the study, Demand for quality education and skills development:
we used systematic mapping approaches to conduct a review of existing Between 2015 and 2065, the secondary school age population in
literature and data sources, and to develop a conceptual framework of Tanzania will more than double from 4.8 to 14.2 million under the Medium
the pathways through which youth demographics affect access to and Variant or to 9.7 million under the Accelerated Model. In Uganda, the
demand for basic and critical services including schooling, housing, health secondary school age population will increase from 5.8 to 16.2 million
care, and jobs. In addition, we employed modelling techniques including under the Medium Variant or to 13.4 million under Accelerated Model.
cohort component population projections and the DemDiv model On the other hand, because of significant drops in fertility in Kenya and
i ii
The UN Medium Variant Scenario assumes that increases in contraceptive use and education will result in The Accelerated Model assumes that countries intensify efforts to lower fertility significantly by 2065 including
lower fertility in patterns similar to the experience of other countries that have gone through the demographic significantly reducing early childbearing, unmet need for modern contraception, and child mortality.
transition.
East African Regional Analysis of Youth Demographics
XIRwanda, there will be declines in the school-age population by 2050 in same, the projected number of NEETS in the four East African countries will
both countries. All of the EAC countries will need to significantly invest in increase from 9.8 million to nearly 23 million by 2050 (Kenya, from 4.9
increasing the number of places for primary and secondary schools while to 9.1 million; Tanzania,3.1 to 9.2; Uganda, 1.5 to 4 million; and Rwanda
at the same time improving the quality of education and skills training. 310,000 -532,000).
Demand for modern methods of contraception: Using Modelling the Potential Impact of the
the UN Medium Variant population projections, we estimated the total Demographic Dividend in EAC
demand for contraception among sexually active female youth (married
and unmarried) in the four EAC countries. The results indicate that the The DemDiv modelling tool was used in the four EAC countries to estimate
demand for contraception among female youth will increase significantly. the impact on development indicators of adopting different investment
For example, in Rwanda, among the female youth 15-19 years, the scenarios as follow:
demand for contraception will grow more than 8-fold by 2065, from i) Business as Usual: Characterised by maintaining the status quo across
35,000 women in 2015 to over 331,000. In Uganda, among young all sectors.
females aged 30-34, the demand will rise almost four times from 805,000
ii) Economic Emphasis: Economic reforms to enhance productive
women in 2015 to 3.9 million by 2065.
efficiency and accelerate economic growth, job creation, and poverty
Employment and “NEETs”: Unemployment among youth is a reduction.
widespread problem in Africa and EAC is no exception. For example, in iii) Social Emphasis: Combining economic reforms as in (ii) above and
Uganda, youth unemployment is around 21% among women and 11% investing in education to achieve universal secondary education and at
among men, while in Tanzania, roughly 14% of those 15-24 years old are least two years post-secondary education.
unemployed, with females having 1.5 times higher unemployment rates
iv) Combined Emphasis: Concurrently emphasising economic reforms
than males. Furthermore, many are in vulnerable employment, thus they are
and education and prioritising family planning to achieve contraceptive
unlikely to have access to benefits or social protection programmes. The
prevalence rate of at least 64% by 2050-55.
share of young people who are not in education, employment or training
(NEET) provides a broad measure of the untapped potential of young The results show that under the “Business as Usual” Scenario, rapid
people who could contribute to national development through work. The population growth will continue to put serious pressure on development
International Labour Organisation (ILO) argues that this group deserves and a youth bulge will not be achieved over the next few decades. Under
attention since the youth are neither improving their future employability this scenario, human development will remain low and the countries will
through investments in skills nor gaining experience through employment. remain stuck at low-income levels (see Figure i).
If the levels of employment, school enrolment, and training remain the
Figure i: Demographic Dividend versus Status Quo by 2050
$927
Uganda
$3,483
$2,063
Tanzania
$3,878
$2,264
Rwanda
$3,457
$896
Kenya
$4,595
$0 $500 $1,000 $1,500 $2,000 $2,500 $3,000 $3,500 $4,000 $4,500 $5,000
Business-as-usual
Demographic dividend. (difference in per capita GDP between the Combined scenario and Economic emphasis only)
XII East African Regional Analysis of Youth DemographicsOn the other hand, under the Combined Investment Scenario, the four ii. Promote innovation hubs and facilitate the financial inclusion of
countries could quickly witness a change in their age structures to have youth to stem unemployment in the EAC.
a youth bulge and subsequent working-age bulge that would reduce iii. Provide decent livelihood opportunities to prevent crime and
young age dependency and allow them to maximise the benefits of insecurity among the youth and discourage the brain drain of young
the demographic dividend. The four countries could harness sizeable people moving to other countries in search of jobs.
demographic dividends if they invested in: comprehensive sexuality
iv. Develop agribusiness and encourage greater youth participation in
education and providing universal access to contraception and
the sector.
healthcare; access to basic quality education for all and significantly
improved access to tertiary training and skills development; economic v. Eliminate any form of discrimination in access to available jobs,
reforms that spur entrepreneurship and job creation, with equitable access particularly in the formal sector to promote equity.
to available jobs; and strengthening the rule of law, good governance and
Women’s and girls’ empowerment
accountability.
i. Empower girls to participate in secondary and tertiary education
Policy responses and recommendations and in science, technology, and mathematics.
This report provides two sets of recommendations: to the governments ii. Outlaw practices that affect women’s empowerment such as child
of the EAC countries, and to DFID and other development partners marriages and gender-based violence and ensure these are
and are in line with the African Union’s roadmap for harnessing the enforced.
demographic dividend which has identified four pillars: employment and
Environment and climate
entrepreneurship; education and skills development; health and wellbeing;
and rights, governance, and youth empowerment. i. Work with youth to raise awareness of environmental issues and
good stewardship of natural resources.
Recommendations for priority investments by ii. Urban planning should take into consideration both natural growth
governments of EAC countries and rural-to-urban migration. Rural development schemes that offer
attractive livelihood opportunities for youth can help to manage
Family planning and health rapid urbanisation.
i. Child survival programmes such as immunisation programmes
and efforts to eradicate malaria, to improve human capital and to
Governance and accountability
accelerate fertility decline. i. Improve governance and accountability to improve security and
shared prosperity.
ii. Universal access to contraception to address the high unmet need,
especially among those living in rural areas, urban slums, and ii. Include youth in decision-making spaces especially on matters that
among the youth. affect them.
iii. Prevention of new HIV infections among youth and treatment of Recommendations to DFID and Development
those who are infected to improve human capital.
partners
iv. Good nutrition and promoting active life-styles to prevent
overweight/obesity epidemic among youth. To support countries in the region to benefit from the demographic
dividend, strategic technical and financial support from development
Education and skills development partners should focus on the following areas:
i. Invest in school-construction projects to match the growth in i. In-depth policy prioritisation analysis: Development partners should
population. provide the technical support for in-depth prioritisation analysis
ii. Put in place measures to evaluate and improve learning outcomes of population and development policies. In particular there is
aimed attaining quality education and training. need to provide such guidance at sub-national level as significant
differences on population and development outcomes exist across
iii. Increase female participation in secondary and tertiary education.
regions and within countries.
iv. Involve employers in curriculum reforms for tertiary and Technical
ii. Systems thinking and integrated planning capacity: Supporting
and Vocational Education and Training (TVET) institutions to ensure
capacity development for planning officials and programme
that appropriate transferable skills form part of the training.
designers on systems thinking and integrated planning. Systems
Economic reforms that promote job creation thinking is an approach to problem solving that views “problems” as
part of a wider dynamic system. It demands deeper understanding
i. Create an enabling environment for the creation of jobs, youth of linkages, relationships, interactions and behaviours among the
entrepreneurship, and encourage savings for pensions. elements that characterise the entire system.
East African Regional Analysis of Youth Demographics
XIIIiii. Cost-benefit analysis: Provide technical expertise and support v. Coordination and accountability systems: Provide support for
for cost-benefit analyses of interventions aimed at harnessing the the development/enhancement and implementation of strong
demographic dividend. coordination and accountability systems for population and
development. Examples include the creation of strong national
iv. Sustainable funding for demographic dividend interventions:
councils for population or councils for population and development
The Combined Emphasis Scenario which provides the best
to coordinate the implementation of programmes on population and
options for harnessing a sizeable demographic divided can be
development-- including universal access to effective contraception.
a daunting undertaking given the multiple linkages across social
and economic development sectors. Development partners should vi. Role of the private sector and other stakeholders: Engage the private
support innovative funding aimed at providing sustainable funds for sector, civil society and other critical ministries like education, youth,
interventions to harness the demographic dividend. labour, and industrial development in the agenda to harness the
demographic dividend and integrate population dynamics in their
existing policies and planning.
XIV East African Regional Analysis of Youth Demographics1
East African Regional Analysis of Youth Demographics
1Introduction
The African Institute for Development Policy (AFIDEP), in partnership WP 2: Scenario modelling using secondary data sources to show, under
with the University of Southampton and local collaborators, conducted different scenarios, the short, medium, and long-term implications of youth
a desk-based analysis project in 2017 titled “Regional Analysis of population dynamics on the countries’ economic development;
Youth Demographics” (ReAYD) which was funded by the East African WP 3: Developing recommendations which bring together evidence
Research Fund of the United Kingdom (UK) Department for International from the literature and scenario modelling to highlight the policy and
Development (DFID). The main purpose of the project was to understand implementation implications of youth demographics for each of the four
the implications of the present and future changes to the demography countries and for the region;
of youth (15-24 years) in the East Africa Community (EAC) on basic
WP 4: Use data visualisation to communicate the findings to policymakers
services, labour force, and socio-economic development. The East African
and youth in the region including web-accessible interactive maps,
Community is a regional inter-governmental partnership between five
infographics, and videos.
countries (Burundi, Kenya, Rwanda, Uganda, and the United Republic
of Tanzania). It was originally conceived in 1967 by three founder states The detailed methodology applied in this study are provided in Appendix
(Kenya, Uganda, and Tanzania), and formally established in 2000 1 and Appendix 2.
by a treaty. The pillars of integration, which are at various stages of
implementation, include a customs union, common market, monetary union,
and ultimately political federation.
The Terms of Reference of the ReAYD project specified that the project
should focus on four EAC countries: Kenya, Rwanda, Tanzania and
Uganda. The project was implemented through the following work
packages (WP):
WP 1: Systematic mapping of existing literature to develop a conceptual
framework of the pathways through which youth demographics affect
access to and demand for basic and critical services including schooling,
housing, healthcare, and jobs;
2 East African Regional Analysis of Youth Demographics2
East African Regional Analysis of Youth Demographics
3Rationale and Problem Statement
According to population projections by the United Nations (UN), the 2015, compared with 41% globally).1 Such youthful population, if healthy,
world will reach 10 billion people by 2055 and more than 95% of this skilled, and gainfully employed can be a catalyst for accelerated social
growth will happen in low and middle-income countries.1 Of the 2.45 and economic development. When fertility and childhood mortality fall
billion people expected to be added to the global population by 2055, sharply so that the ratio of dependents to economically active people
more than 1.4 billion (57%) will be added in Africa and by 2063, decreases, a window of opportunity opens for accelerated economic
there will be more than 3.2 billion people living in Africa (see Figure 1). growth, a phenomenon called the demographic dividend. In theory,
Decades of very high fertility in Africa, coupled with rapidly declining child countries benefit since resources that would have been used for building
mortality, have led to high population growth rates (currently averaging extra schools, hospitals and other services can be invested in human
2.5% per annum). As a result, the age-structure of many African countries capital to increase productivity or saved, while productive adults facilitate
has a high percentage of people under the age of 25 (average of 60% in increased Gross Domestic Product (GDP).
The Youth Bulge and the Demographic Dividend
A youth bulge is a temporary demographic phenomenon which occurs when child mortality declines and
fertility falls rapidly so that the previous cohort of births is larger than subsequent cohorts. As the large cohorts of
births move into the working ages (15-64 years), we get a bulge in the population pyramid.
If the youth are skilled and productively employed, There are a number of caveats.
the youth bulge can lead to the demographic
dividend, a temporary economic benefit which a) A youth bulge requires both child mortality and
can span five or more decades. The benefits of the fertility to decline sharply. A fall in child mortality
demographic dividend include: alone is not sufficient to achieve a youth bulge.
• Higher consumption per capita. • If fertility remains high, subsequent cohorts
will continue to grow and the ratio of young
• Increase in savings. dependents to working ages will continue to be
unfavourable.
• More resources for infrastructure and increase
in productivity. • The slow decline in fertility maintains high
young-age dependency age structures whose
• Potential for a second, larger demographic effect on economic growth is modest or
dividend. negative.
The first demographic dividend eventually wanes • Sustained fall in fertility to replacement level
because falling birth rates mean that there is a fertility (2.1) is the best option for maximising the
reduction in the number of people joining the labour benefits of the demographic dividend.
force. Also, higher living standards can lead to
longer life expectancy and an ageing population b) Converting the youth bulge into a demographic
which increases old-age dependency. dividend is not automatic. A country can
As the first demographic dividend is waning, a “squander away” this opportunity if:
second demographic dividend, potentially larger • Youth are under-educated or unskilled leading
and lasting longer, can happen if appropriate to low productivity.
actions and policies are in place to encourage
savings and asset accumulation for older ages and • There is high youth unemployment or under-
investing in higher labour productivity. employment.
The second demographic dividend can lead to a • Youth who are not economically productive
permanent increase in living standards. become disenchanted and cause civil unrest.
4 East African Regional Analysis of Youth DemographicsFigure 1: Africa’s share of the world population, 2015-2063. UN Medium Variant Scenario, 2017 Revision and share of Gross Domestic Product in
2015
Figure 2 is a simplified diagram demonstrating the potential relationship what investments to make and what policies are needed to move from
between population dynamics and economic development. The this optimism to action. For example, the necessity of significantly investing
first demographic dividend can last up to 50 years. If during the first in family planning to accelerate fertility decline as a pre-condition for
demographic dividend people are encouraged to invest or save for older harnessing a sizeable demographic dividend is being underplayed both
ages, a second demographic dividend, which is longer and more durable, at the AU level and in most countries. Secondly, even though the four
can occur. Economists have estimated that the demographic dividend EAC countries have youth policies, these show lack of awareness of the
contributed 25-33% to the economies of South-East Asian countries (South short and long-term implications of the youth demographics on basic
Korea, Taiwan, Singapore) in the 1980s.2, 3 and critical services. Instead of reaping a demographic dividend, African
countries may find that the youthful population is a bane especially if they
Over the past five years, the African Union (AU) and multilateral agencies adopt “business-as-usual” actions. In the less benign situation, the window
have led the agenda on harnessing the demographic dividend in Africa. of opportunity may pass by without countries realising the economic
This agenda has brought some optimism among many African leaders benefit from the demographic age-structure as is the case of South Africa
and led to demands for national analyses on the prospects of harnessing and Tunisia.4, 5 In the worst-case scenario, the large youthful population
the demographic dividend. However, there is lack of understanding on could translate into an army of discontented unemployed youth who might
East African Regional Analysis of Youth Demographics
5Figure 2: Simplified Conceptual Framework: Youth Bulge and the Demographic Dividend increase social risks and tensions.6 Other consequences of this worst-case major challenges: (1) Address the doubling or even tripling by 2050 of scenario include effects on the environment, unplanned urbanisation, and their working-age population; and (2) Better prepare for the future of their poverty (see Figure 2). Each of the EAC countries must today confront two upcoming young generations. 6 East African Regional Analysis of Youth Demographics
3

East African Regional Analysis of Youth Demographics
                                                       7
Demography of the Four EAC
Countries
This section looks at the population characteristics of the four countries. It first outlines the demographic
profiles, comparing the population age structures with other Asian countries that have benefited
from the demographic dividend. The projected population growth in different regions of the world is
presented next, followed by the concept of the youth bulge and how it is created. Finally, we present
the policy options that have been shown to increase the magnitude of the demographic dividend
earned in countries that have gone through the demographic transition.
3.1. Demographic Profiles
The demographic characteristics of the four countries are shown in Table 1. women, which was made possible through public family planning
Roughly, the four countries make up over 10% of the continent’s population. programmes. Modern contraceptive prevalence rate (mCPR), which is
Approximately 20% of the population of these countries (i.e. about 25.5 the percentage of married women who are using modern contraception,
million) are youth aged 15-24, the official United Nations definition of is highest in Kenya and there have been large increases in all the four
youth. This definition varies: the EAC uses 15-34 years; Rwanda uses 16- countries.
30 years; Tanzania 15-35 years; Kenya uses 18-34 years; and Uganda Currently, the population age-structures of the four countries are typical
uses 15-30 years. In the report, we use the UN and EAC age-ranges so of most African countries, with a large base of young people (see Figure
that data are comparable with other youth studies. 3). In comparison, the population pyramids of Malaysia and South Korea
The average number of children that an East African woman can expect to show that the two countries are well advanced in their demographic
have during her lifetime (total fertility rate [TFR]) ranges from 3.9 in Kenya transitions, reflecting a much more favourable ratio of working-age
to 5.4 in Uganda (see Table 1) compared with averages of 4.4 for Africa population to dependents. These two countries had the same population
and between 1.6 and 2.3 for the rest of the world. Although fertility rates pyramids and roughly similar total fertility rates as the EAC countries in the
are still high in EAC, there has been some decline since 1990. Between 1960s. While Malaysia’s and South Korea’s total fertility rates dropped
1990 and 2015, TFRs declined by 45% in Kenya; 33% in Rwanda; 27% in from about six children in 1960 to below two children in 2015, fertility rates
Uganda; and 13% in Tanzania. Much of the decline in fertility is attributed for the EAC countries during this period only dropped by about one to two
to the significant increase in the use of modern contraceptives by married children.
Table 1: Demographic profiles of EAC countries
Country Total Youth, Children, Total fertility rate Percentage of Under-five mortality-
population 15-24 0 -14 years married women deaths/1000 live
in millions years as a % (15-49 years) births
(2015)a as a % of total using modern
of total population contraceptives
population (2015) Early 2014-16c Early 2014-16 Early 2014-16
(2015) 1990sc 1990s 1990s
Kenya 44.2 20% 42% 6.7 3.9 27 53 90 52
Rwanda 11.3 20% 40% 6.2 4.2 13 48 151 50
Tanzania 53.9 19% 45% 6.2 5.2 7 32 141 67
Uganda 35.5 21% 47% 7.4 5.4 3 35 177 64
Africa 1256b 19% 41% 5.7 4.4 10 33 167 75
Sources: (a) National Population and Housing Census projection Reports (Kenya, 2012), Rwanda (2014), Tanzania (2015), Uganda (2016); (b) United Nations, 2017 Revision, World Population Prospects;
(c) Demographic and Health Surveys/ Multiple Indicator Surveys.
8 East African Regional Analysis of Youth DemographicsFigure 3: Population pyramids of Kenya, Rwanda, Tanzania, and Uganda compared with Malaysia and South Korea, 2015
AGE KENYA, 2015 RWANDA, 2015
AGE
100+ yrs.
100+ yrs.
95-99 yrs.
95-99 yrs.
90-94 yrs.
85-89 yrs.
Male Female 90-94 yrs. Male Female
85-89 yrs.
80-84 yrs.
80-84 yrs.
75-79 yrs.
75-79 yrs.
70-74 yrs.
70-74 yrs.
65-69 yrs.
65-69 yrs.
60-64 yrs.
60-64 yrs.
55-59 yrs.
55-59 yrs.
50-54 yrs.
50-54 yrs.
45-49 yrs.
45-49 yrs.
40-44 yrs.
40-44 yrs.
35-39 yrs.
35-39 yrs.
30-34 yrs.
30-34 yrs.
25-29 yrs
25-29 yrs
20-24 yrs 20-24 yrs
15-19 yrs. 15-19 yrs.
10-14 yrs. 10-14 yrs.
5-9 yrs. 5-9 yrs.
0-4 yrs. 0-4 yrs.
10 8 6 4 2 0 2 4 6 8 10 10 8 6 4 2 0 2 4 6 8 10
PERCENT PERCENT
AGE UGANDA, 2015
AGE TANZANIA, 2015 100+ yrs.
100+ yrs. 95-99 yrs.
95-99 yrs. 90-94 yrs.
90-94 yrs. 85-89 yrs. Male Female
85-89 yrs.
Male Female 80-84 yrs.
80-84 yrs. 75-79 yrs.
75-79 yrs. 70-74 yrs.
70-74 yrs. 65-69 yrs.
65-69 yrs. 60-64 yrs.
60-64 yrs.
55-59 yrs.
55-59 yrs.
50-54 yrs.
50-54 yrs.
45-49 yrs.
45-49 yrs.
40-44 yrs.
40-44 yrs.
35-39 yrs.
35-39 yrs.
30-34 yrs.
30-34 yrs.
25-29 yrs 25-29 yrs
20-24 yrs 20-24 yrs
15-19 yrs. 15-19 yrs.
10-14 yrs. 10-14 yrs.
5-9 yrs. 5-9 yrs.
0-4 yrs. 0-4 yrs.
10 8 6 4 2 0 2 4 6 8 10 10 8 6 4 2 0 2 4 6 8 10
PERCENT PERCENT
AGE
MALAYSIA, 2015 SOUTH KOREA, 2015
AGE 100+ yrs.
100+ yrs. 95-99 yrs.
95-99 yrs. 90-94 yrs.
90-94 yrs. Male Female 85-89 yrs. Male Female
85-89 yrs. 80-84 yrs.
80-84 yrs. 75-79 yrs.
75-79 yrs.
70-74 yrs.
70-74 yrs.
65-69 yrs.
65-69 yrs.
60-64 yrs.
60-64 yrs.
55-59 yrs.
55-59 yrs.
50-54 yrs.
50-54 yrs.
45-49 yrs.
45-49 yrs.
40-44 yrs.
40-44 yrs.
35-39 yrs. 35-39 yrs.
30-34 yrs. 30-34 yrs.
25-29 yrs 25-29 yrs
20-24 yrs 20-24 yrs
15-19 yrs. 15-19 yrs.
10-14 yrs. 10-14 yrs.
5-9 yrs. 5-9 yrs.
0-4 yrs. 0-4 yrs.
10 8 6 4 2 0 2 4 6 8 10 10 8 6 4 2 0 2 4 6 8 10
PERCENT PERCENT
The population pyramids capture the total population of a country by 5-year age groups (y-axis). The pyramid depicts the percentage contribution
of each five-year age group to the total population (x-axis).
East African Regional Analysis of Youth Demographics
9Table 2: Comparison of select socio-economic and demographic indicators for EAC countries, Malaysia and South Korea
2015 (or latest available year )
Indicator
Kenya Rwanda Tanzania Uganda Malaysia S. Korea
Per Capita GDP ($) 1350 721 872 674 10,829 27,108
Total Fertility Rate 3.9 4.2 5.4 5.4 1.98 1.3
Under five mortality (deaths/1000 births) 52 50 67 64 5 4
Net Secondary School Enrolment Rate (%) 44 23 (2013) 24.7 24 68.8 96.6
Gross Tertiary Enrolment Rate (%) 5 7.5 (2013) 5.2 5.4 37 93.2
Sources: World Bank WDI; UN World Population Prospects, The 2017 Revision; Demographic and Health Surveys/ Multiple Indicator Surveys.
Figure 4: Growth of global youth population (15-24 years), by regions of the world. UN Medium Variant scenario, 2017 Revision
1,400,000
1,200,000
1,000,000
Population in thousands
800,000
600,000
400,000
200,000
-
2017 2020 2023 2026 2029 2032 2035 2038 2041 2044 2047 2050
Africa Asia Latin America & the Caribbean Rest of the world
3.2. Pathways to a youth bulge and economic development.8-10This is driven by changing norms and
perspective on the importance of many children. In agrarian societies,
Except for Africa, the youth population in the rest of the regions of the
many children are preferred as a source of labour, with minimal cost on
world will be declining by 2100, all things being equal (see Figure 4). In
human development. However, as societies move away from agriculture
fact, the youth population has started declining already in Europe and Latin
to industrialised societies due to economic improvement, the need for
America and the Caribbean such that the populations of these regions are
large families dissipates, and the cost of investment in human capital
ageing. The economic impact of an ageing population can potentially
development (including education and skills development) increases,
be negative if there are insufficient investments and savings to support
thus changing the perspectives on family size norms. A growing stream
pensions and other social safety nets for older people.
of evidence also shows that factors that improve the socio-economic
The transition to lower fertility in Africa is happening at a slower pace wellbeing of women, including education and labour force participation,
than the experience of the other regions of the world. Only Mauritius, have been shown to contribute to lower child mortality and fertility rate.11-13
Seychelles and Réunion in Africa have fertility below the world average of
2.6 children per woman. When child mortality is high, couples adopt “insurance” or “replacement”
Figure 5 summaries the pathways to a youth bulge focusing on strategies to compensate for child losses. When child mortality rates start
key determinants to fertility reduction. Low levels of socioeconomic falling, couples adjust their fertility downwards.14,15
development, low female education and early marriage, high child With increases in female education and mCPR, fertility has started falling in
mortality and weak family planning programmes are the factors that have Africa, but at the same time, couples are abandoning traditional practices
traditionally kept fertility high in Africa7. Earlier studies and recent reviews such as long periods of postpartum abstinence and breastfeeding which
show that in general, fertility rate declines with the increased level of social have depressing effects on fertility.16-18
10 East African Regional Analysis of Youth DemographicsThe impact of urbanisation on changes in fertility is thought to operate in fertility rates by education for SSA as a whole and across different
through changes in female education and empowerment, marriage countries is illustrated in Appendix 3 (authors own analyses). In Rwanda,
patterns and fertility desires, and uptake of contraceptive use. Rural- increase in educational attainment during the last decade explained much
urban differences in fertility rates exist in most African countries and of the fertility decline, along with significant increase in contraceptive use,
the challenges in tackling high rural fertility remain invariably the same improvement in living conditions and progressive shifts towards non-
across Africa: poor access to family planning services; lack of progress agricultural employment.23, 24
in educational attainment, lack of basic infrastructure and poor road In summary, exposure to modern school-based education has overriding
networks and transport systems, and the vicious cycle of poverty. The future strong independent effect on uptake of modern contraception and
of fertility transition in most parts of Africa inevitably requires concerted reducing fertility when controlled for other factors such as residence,
efforts and programme interventions to reduce fertility in rural and remote income and religion.25
regions.16 For instance, the use of the community-based distribution of
Wealth status has a similar effect on fertility to female education. Our
contraceptives in the difficult to reach areas in Ethiopia, Rwanda and
analyses using DHS data from SSA show that fertility among women in
Malawi is credited for the observed rapid increase in contraceptive
the poorest wealth quintile is twice as high as women in the wealthiest
uptake and subsequent fertility decline in these countries.19, 20
quintile (Appendix 3). A larger proportion of the poorest women do not
Figure 5: Pathways to the youth bulge in East Africa
The role of female education in reducing fertility is thought to operate use contraception even when they want to avoid additional childbearing
through a number of pathways including, delayed entry into marriage, because family planning services are too far, they are afraid of side effects
participation in wage employment which lowers desired fertility size, of contraceptives, or their preferred method is out-of-stock7. The benefits
confidence to use modern health services and contraception, and of effective contraceptive use go beyond fertility reduction. Modern
empowerment which increases women’s autonomy and decision-making contraception is estimated to successfully avert 33% of all maternal deaths
within a household or a community (see Figure 6).21 Evidence from 22 in Africa annually.26
countries in Sub-Saharan Africa (SSA) shows that increasing women’s The timing of when a country attains a youth bulge depends on the pace
education across different socio-economic groups is very effective in of fertility decline and improvements in child survival. The conversion of a
reducing overall fertility levels.22 youth bulge to a demographic dividend is not automatic since countries
However, a few years of schooling are not sufficient for meaningful fertility can squander this opportunity if the youth are uneducated and do not
reduction. For the most recent Demographic and Health Surveys (DHS) have equitable access to decent jobs.4 The creation of jobs to meet the
conducted in SSA between 2000 and 2016, the results show that primary demands of large youth populations requires both local and foreign
education is associated with only 7.3% lower fertility when compared with domestic investment, enabling environments for entrepreneurship, and
women with no education. Secondary and tertiary education, on the other good governance and accountability.27 Governance and accountability
hand, are associated with 35.3% and 54.2% lower fertility respectively are particularly important in ensuring that youth have equitable access to
than that of women with no education. The variation in relative differences available jobs, particularly in the formal sector.
East African Regional Analysis of Youth Demographics
11Debates at many population conferences indicate that experts are divided The support ratio (red series) significantly decreased in the 1980s and
on the actual timing when countries begin to reap the demographic 1990s when the child dependency burden in Senegal was at its highest
dividend with some arguing that even small declines in fertility have a as a result of past high fertility. However, as child dependency begins to
positive benefit, while others are more pessimistic. However, all agree decline slowly after the turn of the century to coincide with the drops in
that the support ratio, which is a ratio of effective producers (workers) to fertility and mortality, the support ratio begins to increase rapidly and is
consumers (young and old dependents), needs to increase to achieve projected to continue doing so for several decades even as the rate of
a sizeable benefit in economic growth. Furthermore, economists who change slows down after 2030. As a result of the positive increase in the
have used the National Transfer Accounts (NTA) demographic dividend support ratio from the 1990s, this analysis demonstrates that in fact Senegal
modelling approach suggested that a one percentage point increase has been benefitting from the first demographic dividend (rate of change
in the support ratio leads to a one percentage point increase in the of the support ratio in the blue series) over the last two decades and the
standard of living in the population, all other things being equal.28 The opportunity to maximise the demographic dividend will peak between
first demographic dividend is thought to be positive when the ratio of 2020 and 2030 before the rate of change slows down as the growth
producers to consumers is rising; as this ratio peaks, the dividend equals of those in the working ages slows down. However, first demographic
zero; and as it begins to decline, the dividend becomes negative, implying dividend will still be positive at the end of the projection period in 2050.
that the demographic change acts as a brake on economic growth rather
than an impetus for economic growth.4 Figure 6 illustrates estimates of
Senegal’s support ratio and first demographic dividend between 1950
and 2050.
Figure 6: Estimated changes in Senegal’s Support Ratio and First Demographic Dividend, 1950-2050 (CREFAT, 2015)
0.75 0.80
Support Ratio
0.70 Growth rates of support ratio (first dividend) 0.60
0.65 0.40
0.60 0.20
Growth rate of the support ratio (%)
Support Ratio
0.55 0.00
0.50 -0.20
0.45 -0.40
0.40 -0.60
1950 1960 1970 1980 1990 2000 2010 2020 2030 2040 2050
Year
12 East African Regional Analysis of Youth Demographics3.3. Priority Policy Areas Necessary to Harness a These policy priority areas are aligned to the AU roadmap (2017) on
Sizeable Demographic Dividend harnessing the demographic dividend through investments in youth. It is
notable that the AU roadmap subsumes family planning within the health
Countries in the EAC do not currently have a youth bulge but there is a pillar. However, the importance of achieving rapid fertility decline should
window of opportunity if the EAC invests in universal access to family merit greater emphasis on family planning and advocacy for universal
planning and human capital development. Thus, for the EAC countries access to modern contraception as a pathway to faster demographic
to reap the demographic dividend, pre-requisite policy changes and transition in the EAC.
programme actions leading to significant investments and therefore
improvements in the following areas are required:
• Health and family planning.
• Education and skills development for all.
• Women’s empowerment.
• Job creation and equitable access to available jobs (focusing on
the youth).
• Good governance.
East African Regional Analysis of Youth Demographics
134 14 East African Regional Analysis of Youth Demographics
Youth Challenges in the EAC
      Youth in Rwanda, Tanzania, Kenya and Uganda face similar social and economic challenges: high
      birth rates, poverty, unemployment and underemployment and health problems. However, the patterns
      and severity of these challenges vary by country and sub-country. This section focuses on health,
      education, employment, and migration and urbanisation challenges facing the youth. Efforts have been
      made to identify existing policies as well as the policy gaps in each of the sectors discussed.

4.1 Health Challenges for Youth                                                    Another major challenge is early childbearing which has implications for
                                                                                   total achieved fertility, maternal mortality and morbidity, child survival,
Youth in Africa face many daunting challenges to their health and
                                                                                   and women’s empowerment. The age-specific fertility rates for the four
wellbeing including the burden of infectious diseases such as HIV/AIDS
                                                                                   countries (Figure 8 overleaf) show that Rwandese youth (15-24 years)
and malaria, and non-communicable conditions including the impact of
                                                                                   have a lower fertility compared to the other three countries, but older
childhood malnutrition, depression and preventable injuries and accidents.
                                                                                   Rwandese women have a higher fertility than their Kenyan counterparts
As a result, it is not surprising that the continent has the highest death rate
                                                                                   so that the total fertility for Rwanda is higher than Kenya’s. Child marriages
among adolescents and youth (10-24 years old) (see Figure 7 from Patton
                                                                                   contribute significantly to the high adolescent childbearing in the EAC. The
et al. 2016).29 Among adolescents aged 10-19, the mortality has been
                                                                                   most recent DHS in the four countries show that among females aged 20-
increasing instead of decreasing. During the period 2011-2015, there were
                                                                                   24, 40% in Uganda, 31% in Tanzania, 23% in Kenya and 7% in Rwanda
6.4 adolescent deaths per 100 population in Africa compared 6.1 and
                                                                                   were married by their 18th birthday.
5.4 per 100 for the periods 2005-2010 and 2000-2005 respectively.30

Figure 7: Deaths per 10,000 youth population (10-24 years) (see Patton et al. 2016)

                        Western Pacific                         80

                         South East Asia                                                       187

                                 Europe                                101

                  Eastern Mediterranean                                                  169

                               Americas                                    109

                                  Africa                                                                                          305

                   High income countries              45

                                           0         50              100          150           200           250           300            350

In the EAC, HIV/AIDS, diarrhoeal diseases, malaria, lower respiratory              Poor access to sexual and reproductive health services is another factor
tract infections and tuberculosis are the main causes of death.31 Factors          which contributes to high adolescent fertility in EAC. Young people,
contributing to poor health outcomes for youth in the EAC include: the             especially those who are not married, have a high unmet need for
high cost of health services, lack of youth-friendly services, lack of relevant    contraception (see Figure 9 overleaf). (Women with unmet need are those
health information and harmful cultural practices such as female genital           who are want to stop or delay childbearing but are not using any method
mutilation (FGM) and early marriages.                                              of contraception.) Even though all the four countries acknowledge this to
Among women aged 15-24, HIV infection ranges from 1.3% in Rwanda to                be a problem in their family planning or SRH policies, actual provision of
4.9% in Uganda, while among older female youth, 25-34 years, 4.2% in               contraception among unmarried youth has been relatively unsuccessful
Rwanda are infected, compared with 10% in Kenya and Uganda. Among                  because of cultural and religious sensitivities and objections.
men, HIV prevalence for 15-24-year-olds is between 0.6% and 2%, while              Other health challenges for the youth in EAC are the rising prevalence
among men 25-34 years, the prevalence is between 2% and 7%.                        of people who are overweight or obese, which may lead to increases
                                                                                   in non-communicable diseases such as hypertension and diabetes.32 For

                                                                                               East African Regional Analysis of Youth Demographics
                                                                                                                                                                    15
You can also read