ECB Contact Group Market update

Page created by Oscar Wolf
 
CONTINUE READING
ECB Contact Group Market update
CURRENCIES
ECB Contact Group Market update                            GLOBAL

CURRENCIES – November 2020

                             Richard Oliver              Issuer of report: HSBC Bank plc
                             Head of EMEA FX Trading
                             HSBC Bank plc
                             richard.oliver@hsbcib.com    Disclosures & Disclaimer: This report must be read with the
                             +44 20 7991 5082             disclosures and the analyst certifications in the Disclosure
                                                          appendix, and with the Disclaimer, which forms part of it
ECB Contact Group Market update
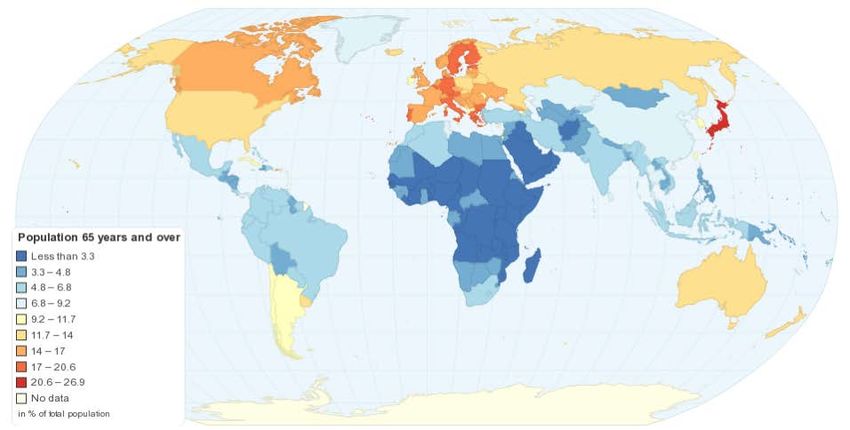
1. Topics of discussion in the FX market

 Source: Refinitiv Datastream, HSBC FX *We use a Machine Learning Process to extract key words in Reuters articles
ECB Contact Group Market update
2. Topics of discussion in the FX market excluding Election and Covid
   Related Themes.

 Source: Refinitiv Datastream, HSBC FX Research. *We use a Machine Learning Process to extract key words in Reuters articles. Our data range is from 1
 January 2020 to 5 November 2020. We scanned nearly 21000 FX articles
3. The US election – now what?

 Probability of Republican Senate control has shifted higher         Lower volatility in financial markets should boost fund
                                                                                     flows into risky assets
100
        Probability (%)                                               2.5
                                                                            Cumulative flows (USD trn)
 80                                                                   2.0
                                                                      1.5
 60                                                                   1.0
                                                                      0.5
 40                                                                   0.0
                                                                     -0.5
 20                                                                  -1.0
                                                                     -1.5
  0                                                                  -2.0
  Jan-20          Mar-20        May-20      Jul-20     Sep-20           Jan-15 Jan-16 Jan-17 Jan-18       Jan-19 Jan-20
             President elect Biden             Rep. Senate control            Active Equity Funds        Passive Equity Funds
             Dem. Senate control               Dem. Sweep                     Money Market Funds

  Source: Bloomberg, Predictt, EFPR, HSBC
4. Biden – policies and China

     Clean sweeps usually see greater legislation passed but                     Implied tariffs on China and USD-CNY;
                                           not always                                lower tariffs could boost the CNY
                     Percentage of legislation enacted by party
     9%                        in the White House                             7.60
                                                               Shaded areas
     8%                                                         mark clean    7.40
     7%                                                           sweep       7.20
     6%                                                                       7.00
     5%                                                                       6.80
     4%                                                                       6.60
     3%                                                                       6.40
     2%                                                                       6.20
     1%                                                                          Apr-18   Oct-18      Apr-19   Oct-19   Apr-20     Oct-20
                                                                                          USD-CNY reference rate
     0%                                                                                   USD-CNY spot
          1978 1982 1986 1990 1994 1998 2002 2006 2010 2014 2018                          Upper limit for USD-CNY spot
            Carter      Reagan Bush Snr.    Clinton     Bush   Obama Trump                Theoretical USD-CNY values (based only on tariffs)

 Source: Predictit.org, Bloomberg, HSBC
5. US-China tensions to persist

                Number of China-related legislative proposals and resolutions introduced into US Congress

                     300                                          House    Senate                         ytd by mid-Aug

                     250

                     200

                     150

                     100

                      50

                       0
                            1990 1992 1994 1996 1998 2000 2002 2004 2006 2008 2010 2012 2014 2016 2018 2020

                                                  …annualized from mid-August, 2020 China legislative proposal on track to rise
                                                                                                              30% over 2019
Source: US Congress, HSBC
6. The scarring from Covid & the recovery

                              Economic scarring set to be less evident in low debt countries and the US
                                                     2020                            2021
                     110                                                                                  110
                                                             GDP level, 2019 = 100
                     106                                                                                  106

                     102                                                                                  102

                      98                                                                                  98

                      94                                                                                  94

                      90                                                                                  90

                      86                                                                                  86
                           UK SP SA   IT   FR   IN   EZ JN BR GE CA US SW NZ AU NO CHF TU SK TA CH
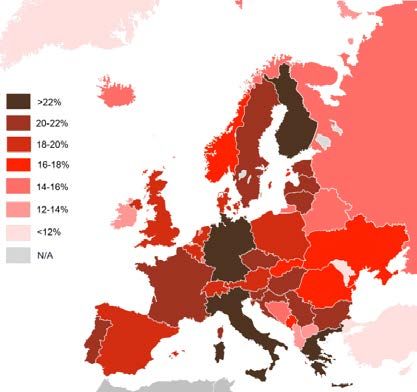
Source: Bloomberg, HSBC
7. The Demographic Investment Story

  Global look at populations > 65 years                  A closer look at Europe

            Sources: http://chartsbin.com/view/1239
        https://en.wikipedia.org/wiki/Ageing_of_Europe
8. The EUR is in focus too
                          ECB references to the exchange rate have been rising lately

Source: Bloomberg, HSBC
China & the RMB
9. China’s economic recovery is broadening

          China’s recovery is broadening from production                China’s import demand is also broadening from
                         to consumption                                       tech-led to include other products

                25%          % y/y
                                                                        30%       China imports, % y/y, 3mma
                20%
                15%
                                                                        20%
                10%
                 5%                                                     10%
                 0%
                -5%                                                       0%
               -10%
               -15%                                                    -10%
               -20%
               -25%                                                    -20%
                        08 09 10 11 12 13 14 15 16 17 18 19 20             Jan-14 Jan-15 Jan-16 Jan-17 Jan-18 Jan-19 Jan-20
                            Credit impulse   IP       Retail sales                        Tech imports         Other non-oil imports

   Source: Bloomberg, HSBC                                           Source: CEIC, HSBC
10. RMB – a strong current account position

                          China’s trade surplus is very wide                 Strong exports to ‘G3’

               250          USD bn                                          USD bn
                                                                     250
               200                                                   200
               150                                                   150
               100                                                   100
                                                                      50
                 50
                                                                       0
                   0
                                                                     -50
                -50                                                 -100
              -100                                                  -150
                       07 08 09 10 11 12 13 14 15 16 17 18 19 20           07 08 09 10 11 12 13 14 15 16 17 18 19 20
                            Oil and Gas             Technology              G3              China+HK        Asia-ex-China
                            Non-oil, non-tech       Trade balance
                                                                            ROW             Trade balance

Source for both charts: CEIC, HSBC
11. RMB – More sensitive to portfolio flows

     Foreigners’ bond investments have increased due in                            Net Stock Connect flows
                   part to index inclusion

   30         Foreign bond inflows, USD bn                             15 Stock Connect flows,          Inflows to China
                                                                            USD bn
                                                                       10
   25
                                                                        5
   20
                                                                        0
   15
                                                                       -5
   10                                                                 -10
     5                                                                -15
     0                                                                -20                 Outflows from China
    -5                                                                -25
  -10                                                                 -30
    Jan-15                  Mar-16    May-17     Jul-18      Sep-19      Jan-15 Jan-16 Jan-17 Jan-18 Jan-19 Jan-20
                              Change in Bonds held by foreigners               Northbound            Southbound          Net flows

Source for both charts: CEIC, HSBC
12. Chinese corporates & hoarding USDs

                                              Net FX settlement for goods trade purposes in China

            USD bn
     80
                         75% conversion ratio pre "trade war"                    35% conversion ratio amid "trade war"        42% during
     60                                                                                                                       'Phase 1'

     40

     20

      0

     -20

     -40

     -60
           Jan-17 Apr-17 Jul-17 Oct-17 Jan-18 Apr-18 Jul-18 Oct-18 Jan-19 Apr-19 Jul-19 Oct-19 Jan-20 Apr-20 Jul-20 Oct-20
                                      Net FX sales by corps (trade conversion)                                Trade balance

                Source: CEIC, HSBC
13. History of the PBoC’s counter cyclical FX policy tools

                                                    Guiding the RMB without direct intervention

  110         RMB appreciation                                                                                                                 6.1
                                                                            Jan 2018 first cut
  108         RMB depreciation                                              of CCF to neutral                                                  6.2
                                                            Sept 2017                                                                          6.3
  106                                                       first cut of
                                                            reserve ratio                                                                      6.4
  104
                                                            to zero                         August 2018 re-                                    6.5
  102                                                                                       application of reserve          Oct 2020 cut
                                             May 2017 first                                                                                    6.6
                                                                                            charge + CCF                    reserve ratio to
  100                                        introduction of CCF                                                                               6.7
                                                                                                                            zero again
        Sept 2015                                                                                                                              6.8
   98   first
        introduction                                                                                                                           6.9
   96
        of reserve                                                                                                                             7.0
   94   charge                                                                                                                                 7.1
   92                                                                                                                                          7.2
   90                                                                                                                                          7.3
     Jul-15     Jan-16              Jul-16    Jan-17      Jul-17      Jan-18       Jul-18        Jan-19      Jul-19   Jan-20      Jul-20
                                     CFETS RMB Index               USD-CNY fix                USD-CNY spot (RHS, reverse scale)

                 Source: Bloomberg, HSBC
14. History of CNH and onshore CNY FX points and effective cost of 20%
reserve charge
                                                      Reserve charge is adjusted according to FX flow condition

         4000                                                                                                                                                                 500
                       pip                                                                                                                                       pip
         3000                                                                                                                                                                 400

         2000                                                                                                                                                                 300

         1000                                                                                                                                                                 200

              0                                                                                                                                                               100

        -1000                                                                                                                                                                 0
            Jan-15           Jul-15     Jan-16        Jul-16      Jan-17        Jul-17      Jan-18       Jul-18       Jan-19       Jul-19       Jan-20       Jul-20
                        USD-CNH 12m forward points                               USD-CNY 12m forward points                              Forex reserve charge (RHS)

Source: Bloomberg, HSBC *Note: The red line represents, for example, the additional cost of buying the one-year USD forward onshore with the 20% reserve charge; for instance, the
additional cost on 1y RHS outright forward is currently around 50pip (20%*35*6.70), assuming 1y US libor at 35bp.
Asia FX liquidity
15. Top-of-book spreads during Asia hours

                           USDCNH                             USDHKD                   USDSGD                    USDTHB
                 5                                                                                                                 5
                                                        Weekly median primary* top-of-book spreads during Asia hours
                 4                                                                                                                 4
  Spread (bps)

                 3                                                                                                                 3

                 2                                                                                                                 2

                 1                                                                                                                 1

                 0                                                                                                                 0
                 Jan-20   Feb-20      Mar-20         Apr-20    May-20    Jun-20    Jul-20    Aug-20    Sep-20    Oct-20   Nov-20

Source: HSBC,
* EBS for USDCNH and Reuters for USDHKD, USDSGD and USDTHB
16. Traded volume

                             USDCNH                                    USDHKD                     USDTHB                USDSGD
70,000                                                                                                                                 70,000
                                                            Weekly total traded volume* (millions of USD) during
60,000                                                                             Asian Hours                                         60,000

50,000                                                                                                                                 50,000

40,000                                                                                                                                 40,000

30,000                                                                                                                                 30,000

20,000                                                                                                                                 20,000

10,000                                                                                                                                 10,000

        0                                                                                                                              0
        Jan-20           Feb-20         Mar-20          Apr-20         May-20   Jun-20   Jul-20    Aug-20   Sep-20   Oct-20   Nov-20

Source: HSBC
*On EBS, Reuters, Hotspot, Currenex, LMAX, ParFX, Gain GTX and FXall
17. Intraday traded FX volume

                                           USDCNH                                USDHKD                                      USDSGD                                         USDTHB
              2,500                                                                                                                                                                                         2500
                                              Average intraday traded volume* profiles between 2020.01.06 and 2020.11.06
              2,000                                                                                                                                                                                         2000
Volume ($M)

              1,500                                                                                                                                                                                         1500

              1,000                                                                                                                                                                                         1000

               500                                                                                                                                                                                          500

                 0                                                                                                                                                                                          0

                                                                                            10:00
                                                                                                    11:00
                                                                                                            12:00
                                                                                                                    13:00
                                                                                                                            14:00
                                                                                                                                    15:00
                                                                                                                                            16:00
                                                                                                                                                    17:00
                                                                                                                                                            18:00
                                                                                                                                                                    19:00
                                                                                                                                                                            20:00
                                                                                                                                                                                    21:00
                                                                                                                                                                                            22:00
                                                                                                                                                                                                    23:00
                      0:00
                             1:00
                                    2:00
                                           3:00
                                                  4:00
                                                         5:00
                                                                6:00
                                                                       7:00
                                                                              8:00
                                                                                     9:00

 Source:
 *On EBS, Reuters, Hotspot, Currenex, LMAX, ParFX, Gain GTX and FXall
DISCLAIMER

 The information contained in this material is intended for the sole use of the recipient and is not for general distribution. The author is a member of the sales and trading department
   and not of the research department of HSBC Bank plc and/or HSBC UK Bank plc. The sales and trading department of HSBC Bank plc and/or HSBC UK Bank plc is engaged in
    selling and trading in securities to which this material relates or is relevant. Accordingly, recipients of this should not regard it as an objective or independent explanation of the
   matters contained in it. This has not been prepared in accordance with regulatory requirements designed to promote the independence of investment research. Any information
contained in this is not and should not be regarded as investment research for the purposes of the rules of the FCA. Any recommendations in this material are based on the individual
opinions of the sender and may be changed at any time without notice. Opinions expressed may differ from the opinions expressed by other divisions of HSBC Bank plc and/or HSBC
                                                                        UK Bank plc, including its research department.
                                                                                     HSBC Bank plc
                      Authorised by the Prudential Regulation Authority and regulated by the Financial Conduct Authority and the Prudential Regulation Authority
                                                                            Registered in England No. 14259
                                                        Registered Office: 8 Canada Square, London, E14 5HQ, United Kingdom
                                                                                  Member HSBC Group
You can also read