Bangkok Urban Regeneration Experience under COVID-19 Pandemic and Emerging 'New Normal' Trends
←
→
Page content transcription
If your browser does not render page correctly, please read the page content below
International Webinar: Rebuilding Cities Post COVID-19
Topic 1: Urban Regeneration Post COVID-19
24 October 2020
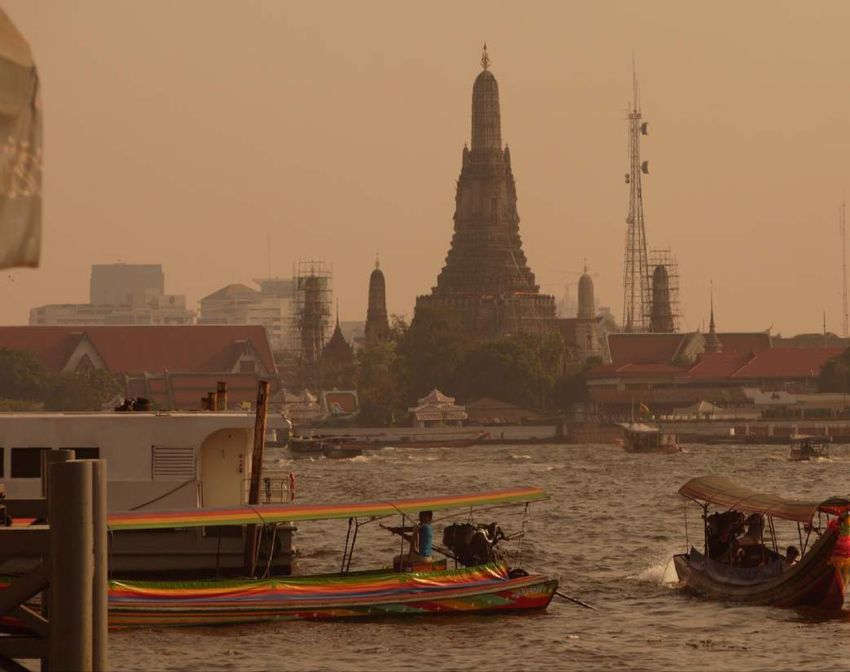
Bangkok Urban Regeneration
Experience under COVID-19 Pandemic
and Emerging ‘New Normal’ Trends
Hideaki Iwasaki
Country Director for Thailand
Asian Development Bank
*Views expressed are the author’s and do not necessarily reflect the views of ADB. 1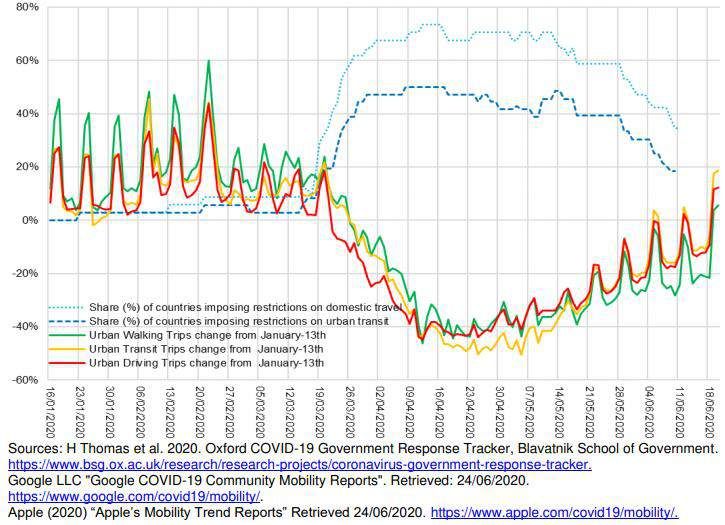
Cities: Urbanization and its Challenges
Bangkok

  Urbanization is often linked to:
  - improved economic opportunities
  - better access to health and education services
  - better living conditions

  Urbanization, if uncontrolled, could exacerbate:
  - environmental degradation
  - increased social inequality
  - disaster risks
  - massive shortfalls in urban infrastructure
  Source: ADB. 2019. Strategy 2030 Operational Plan for Priority 4 Making Cities More Livable, 2019–2024

                                                                                                           2
                                                                                                           2
Bangkok

Bangkok:
-     is the capital of Thailand, and its economic, political and
      administrative center.
-     is also a regional hub for many corporations operating
      internationally and multilateral/international organizations.
-     was the most visited city in 2018 with more than 22 million
      international overnight visitors.*
-     generates 47% of GDP of the country.

Basic data of Bangkok**
Population: 16.8 million in 2018 (24.3% of the country)
Land area : 7,762 square km (1.5% of the national land area)
Gross Regional Product per capita in 2018: $14,156
(93% higher than the national GDP per capita of $7,329)
Source:
* Mastercard Global Destination Cities Index 2019
** Bangkok Metropolitan Region comprising Bangkok, Nakhon Pathom, Nonthaburi, Pathum Thani, Samut Prakan and Samut Sakhon
Other data: NESDC
                                                                                                                                3
                                                                                                                            3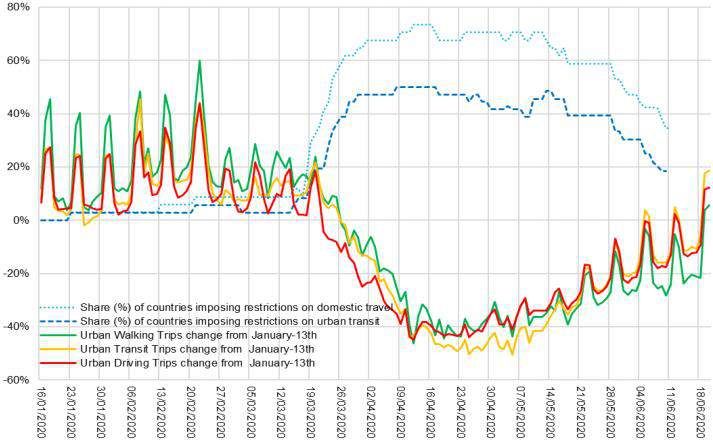
What happened during COVID-19: Asia and the Pacific
Impact of COVID-19 on Transport in Asia and the Pacific

                                                                                  4
                                                             3                    4

From ADB. 2020. Guidance Note on COVID-19 and Transport in Asia and the Pacific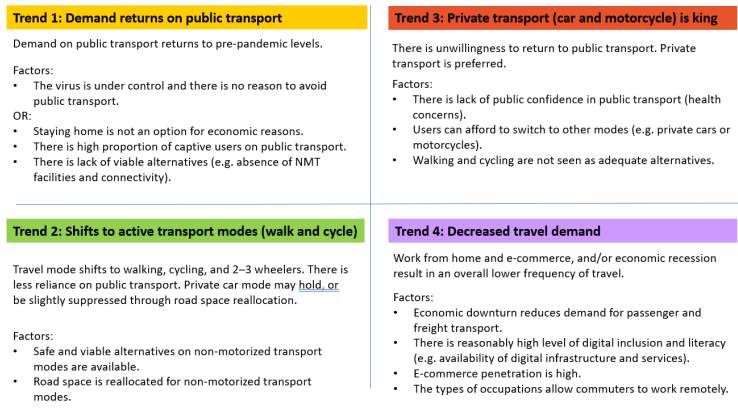
What will happen post COVID-19: Asia and the Pacific

Possible post COVID-19 Trends for Transport Sector in ADB
Member Countries

 Source: ADB. 2020. Guidance Note on COVID-19 and Transport in Asia and the Pacific   5
                                                                                      5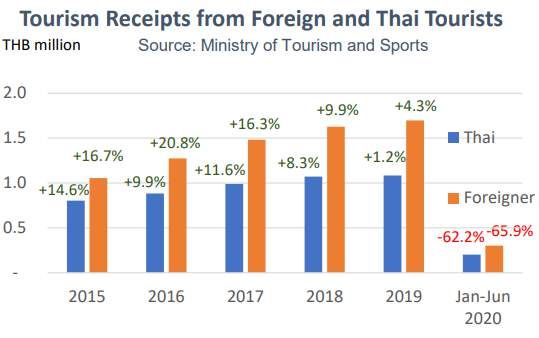
Thailand: What happened during COVID-19
  Macroeconomic situation:
Thailand’s management of COVID-19 is one of
the most successful in the world
- Strong national health care system
- Significant experience in managing recent
pandemics
- Successful precautionary measures
implemented by government

Data on 22 October 2020
10 new cases (all imported cases)
Total 3,719 confirmed cases
         59 deaths
      3,514 recoveries

…………………HOWEVER…………………….

It has caused Thailand’s first economic
contraction since the Global Financial Crisis.
- Total economic loss caused by COVID-19
estimated at $45.9 billion
- GDP growth estimated to be around -8%
- Thailand may be the region’s worst hit economy         6
by COVID-19 in 2020                                  6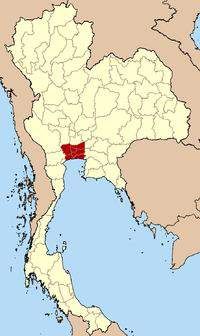
Bangkok: What is happening now

                           Asia and the Pacific
                                                                                      Impact of COVID-19 on Mobility

                                                                                                                              7
                                                                                                                              7
Data source: Apple. 2020 “Apple’s Mobility Trend Reports” Retrieved on 19/10/2020. https://www.apple.com/covid19/mobility/.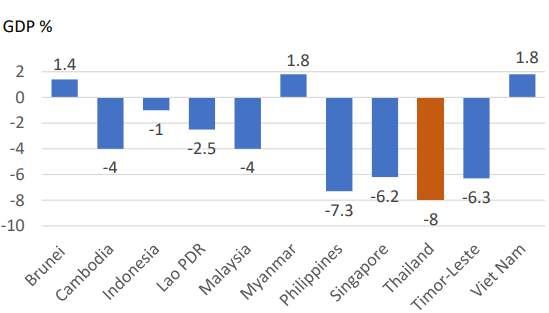
Bangkok: What is happening now

                           Asia and the Pacific
                                                                                      Impact of COVID-19 on Mobility

                                                                                           - In Bangkok, restrictions on movement were
                                                                                           imposed on 3 April, gradually reduced and fully
                                                                                           lifted on 15 June.

                              Bangkok (Jan-Jun)
  60.0%                              Night curfew                     Night curfew
                                    introduced on                       lifted on
  40.0%
                                        3 April                          15 June
  20.0%

    0.0%
      1/13/2020   2/13/2020    3/13/2020    4/13/2020   5/13/2020    6/13/2020
  -20.0%

  -40.0%

  -60.0%

  -80.0%

 -100.0%                                                                                                                             7
                                  Series1
                                  Driving        Series2
                                                  Walking                                                                            8
Data source: Apple. 2020 “Apple’s Mobility Trend Reports” Retrieved on 19/10/2020. https://www.apple.com/covid19/mobility/.
Bangkok: What is happening now
Asia and the Pacific
Impact of COVID-19 on Mobility
- In Bangkok, restrictions on movement were
imposed on 3 April, gradually reduced and fully
lifted on 15 June.
- Even after restrictions are lifted, impacts on
mobility appear to be continuing.
100.0%
Bangkok (Jul-Oct)
Bangkok (Jan-Jun) 80.0%
60.0% Night curfew Night curfew 60.0%
introduced on lifted on
40.0% 40.0%
3 April 15 June
20.0% 20.0%
0.0% 0.0%
1/13/2020 2/13/2020 3/13/2020 4/13/2020 5/13/2020 6/13/2020 7/1/2020 8/1/2020 9/1/2020 10/1/2020
-20.0% -20.0%
-40.0% -40.0%
-60.0% -60.0%
-80.0% -80.0%
-100.0%
Series1
Driving Series2
Walking 7
Series1
Driving Series2
Walking 9
Data source: Apple. 2020 “Apple’s Mobility Trend Reports” Retrieved on 19/10/2020. https://www.apple.com/covid19/mobility/.Bangkok: What is happening now
Impact of COVID-19 on Mobility: Closer Look at Location Data
Comparison with the baseline day = median value from 5 weeks pre-Pandemic 2020 (Jan3-Feb6)
- Workplace: around 10% below baseline
- Residential areas: slightly but constantly above than baseline
- Transit stations: 20 to 30% below the baseline
Google mobility data (percentage change from baseline)
20 Transit Stations Workplaces (original) Workplaces (smoothened) Residential
10
0
-10
-20
-30
-40
27 Jul- Extra Holiday 4 Sep - Extra
-50
Holiday 7 Sep- Extra
6 Jul- Holiday 12 Aug- Holiday 13 Oct- Holiday
28 Jul- Holiday Holiday
-60
6-Jul-20 21-Jul-20 5-Aug-20 20-Aug-20 4-Sep-20 19-Sep-20 4-Oct-20
8
Data source: Google. 2020. COVID-19 Community Mobility Reports. Retrieved on 19/10/2020. https://www.google.com/covid19/mobility/ 10
Note: Workplaces graph is smoothened by removing the data fluctuations that appear to be due to holiday data compared with workday baseline.Bangkok: What is happening now
Impact of COVID-19 on Mobility: Ridership/Traffic Data
BEM MRT Av. Daily Ridership (thousand trips) BEM Toll Road Av. Daily Traffic (in thousand)
450 1400
400 1200
350
1000
300
250 800
200 600
150
400
100
50 200
0 0
JAN FEB MAR APR MAY JUN JUL AUG SEP OCT NOV DEC JAN FEB MAR APR MAY JUN JUL AUG SEP OCT NOV DEC
2018 2019 2020 2018 2019 2020
Data source: https://investor.bemplc.co.th/en/ridership-report/ridership Retrieved on 19/10/2020 Data source: https://investor.bemplc.co.th/en/traffic-report/traffic-volume Retrieved on 19/10/2020
BTS Skytrain Monthly Ridership (million trips)
25
20
15
10
5
0
JAN FEB MAR APR MAY JUN JUL AUG SEP OCT NOV DEC 9
2018 2019 2020 11
Data source: SET Announcements available at https://www.btsgif.com/en/home Retrieved on 19/10/2020Bangkok: What is happening now
Impact of COVID-19 on Resource Usage: Electricity Usage Data
Large general service electricity usage Small general service electricity usage
(GWh) (GWh)
1,800 800
1,600 700
1,400 600
1,200
500
1,000
400
800
600 300
400 200
200 100
0 0
Jan Feb Mar Apr May Jun Jul Aug Sep Oct Nov Dec Jan Feb Mar Apr May Jun Jul Aug Sep Oct Nov Dec
2019 2020 2019 2020
Specific business service* Residential electricity usage
(GWh) (GWh)
*Hotels & other businesses providing lodging 2,000
250 1,800
1,600
200
1,400
150 1,200
1,000
100 800
600
50 400
200
0 0
Jan Feb Mar Apr May Jun Jul Aug Sep Oct Nov Dec Jan Feb Mar Apr May Jun Jul Aug Sep Oct Nov Dec
2019 2020 2019 2020
Data source: Metropolitan Electricity Authority website. Retrieved on 20/10/2020. https://www.mea.or.th/en/profile/122/125
10
12Emerging Trends in Early Post-Pandemic Bangkok
It may still be too early to say what will be ‘New Normal’ but
certain trends appear to be emerging.
From mobility, ridership and traffic data:
- Trend 1: Demand returns on public transport not happening (yet?)
- Trend 2: Shifts to active transport modes (walk and cycle) not happening (yet?)
- Trend 3: Private transport (car and motorcycle) is king highly likely happening
- Trend 4: Decreased travel demand yes and continuing (so far)
.
11
13Emerging Trends in Early Post-Pandemic Bangkok
It may still be too early to say what will be ‘New Normal’ but
certain trends appear to be emerging.
From mobility, ridership and traffic data:
- Trend 1: Demand returns on public transport not happening (yet?)
- Trend 2: Shifts to active transport modes (walk and cycle) not happening (yet?)
- Trend 3: Private transport (car and motorcycle) is king highly likely happening
- Trend 4: Decreased travel demand yes and continuing (so far)
From location data and electricity usage data:
- People spend more time staying home (or in residential areas) and consume more
urban services and resources there.
- Some people have not returned to workplaces (or some workplaces remain closed),
and less resources are consumed at workplaces.
11
14Emerging Trends in Early Post-Pandemic Bangkok
Are the emerging trends good news or bad news?
12
15Emerging Trends in Early Post-Pandemic Bangkok
Are the emerging trends good news or bad news?
Good news
- Public transport will be less
congested (lower/flattened peak)
- Roads are still less congested
(hopefully so).
- Overall, people travel less, meaning
less environmental footprints.
- Infrastructure capacity in residential
areas/suburbs may be utilized more
fully.
- Less demand for city-center facilities
and infrastructure (less pressure for
further expansion).
12
16
Source: AuthorEmerging Trends in Early Post-Pandemic Bangkok
Are the emerging trends good news or bad news?
Good news Bad news
- Public transport will be less - Public transport projects may face
congested (lower/flattened peak) further financial viability challenges.
- Roads are still less congested - Roads may eventually get more
(hopefully so). congested (people continue to shy
away from using public transport).
- Overall, people travel less, meaning
less environmental footprints. - Less travels mean less consumption
slowing economic recovery.
- Infrastructure capacity or service
- Infrastructure capacity in residential
level in residential area/suburbs may
areas/suburbs may be utilized more
not be sufficient to serve higher
fully.
demand for longer hours.
- Less demand for city-center facilities
- City-center facilities and
and infrastructure (less pressure for
infrastructure (existing/being
further expansion).
expanded) may not be fully utilized.
17
Source: Author 12Thailand: Looking beyond Bangkok’s boundaries
Some interesting trends in country-wide and provincial data
are also emerging. 1500
SME electricity usage (GWh)-Provinces*
House Price Index - Thailand
(Jan 2009 = 100) 1000
200
180 500
Jan Feb Mar Apr May Jun Jul Aug Sep Oct Nov Dec
160 2019 2020
Source: Provincial Electricity Authority
*Provinces excluding Bangkok, Nonthaburi and Samut Prakan
140
Employment – Thailand
120 (thousand persons)
30,000
100 25,000
20,000
15,000
10,000
Single-detached house (including land) 5,000
-
Town house (including land)
Condominium 13
Land Source: Bank of Thailand Agriculture Non-Agriculture
Source: National Statistical Office of ThailandFor Post COVID-19 Urban Regeneration
It is still too early to recommend any concrete actions, but here
are some initial thoughts and ideas for post COVID-19 urban
regeneration:
1. Continue to monitor and identify emerging trends using data and technologies
that are newly available now – big data, satellite imagery, data from smart
utilities, etc.
2. Challenge the existing assumptions for urban development, considering the
changed (and changing) responses to the pandemic (and to similar types of risk)
by different economic and social sectors, and in different geographical areas.
3. Primate cities are important, but let’s not forget about the rest of the country,
including the secondary cities and rural communities (these are all inter-linked).
4. Good lessons can be learned among similar-sized cities in the region. Further
information sharing would be useful. 14
19
Source: AuthorThank you. Terima Kasih. ขอบคุณคร ับ For further inquiries, please contact: hiwasaki@adb.org
You can also read