U.S. Credit Update - May 4, 2021 - Arbor Data Science
←
→
Page content transcription
If your browser does not render page correctly, please read the page content below
U.S. Credit Update – May 4, 2021

•   Sector Performance Recap
•   Industry Total Returns and Spread Performance
•   Reported Data and Real Time Indicators
•   Weekly Feature – Stagnant Mobility
•   Issuance Recap

                                                                   A Division of

                                                                   Benjamin Breitholtz,
                                                                   Anthony Rizzo, and Scott Hirth
                                                                   datascience.arborresearch.com

                               © 2021 Arbor Research & Trading, LLC. All Rights Reserved
                                                                                                    1
                                                    05-04-2021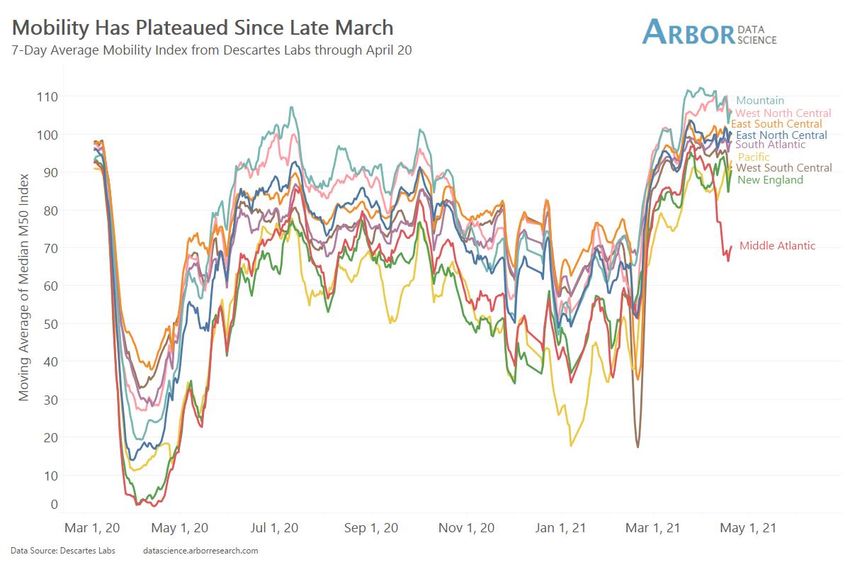
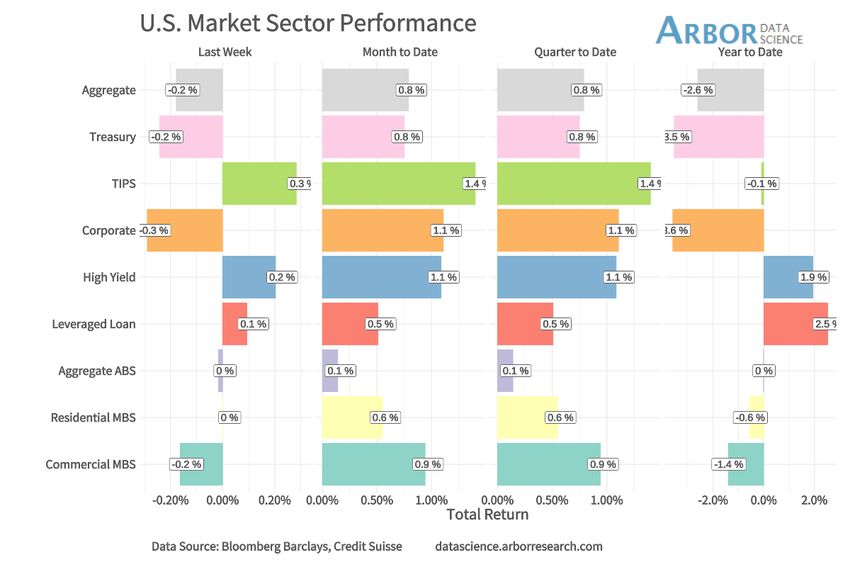
Sector Total Returns

  TIPS Back on Top Last Week

  TIPS had the highest returns last week in a
  weak 5th week of Q2.

  Safer assets remain in a hole for the year.
  Investment grade corporates are -3.6% for
  the year and USTs at -3.5%. TIPS fared
  better with a total return loss of only -0.1%.

  Riskier assets continue to hold the lead with
  high yield +1.9% and leveraged loans
  +2.5% for 2021.

© 2021 Arbor Research & Trading, LLC. All Rights Reserved   05-04-2021   2
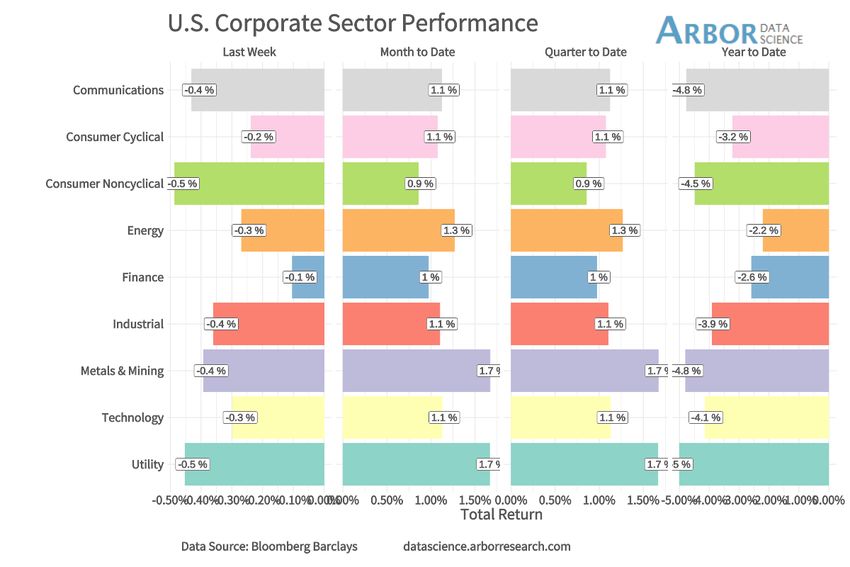
Sector Total Returns

  Finance and Consumer Cyclical Outperform

  Last week saw negative performances across the
  board with Finance being the only sector with
  better performance than the week prior. Finance
  and Consumer Cyclical were the best performing
  sectors last week, losing 0.1% and 0.2%
  respectively on the week. Energy is still the best
  performing sector for 2021 with a total return
  loss of -2.2%.

© 2021 Arbor Research & Trading, LLC. All Rights Reserved   05-04-2021   3
Industry Excess Returns – Higher Beta Outperforms

Spread movement was limited this week as
issuance was light and there were not any
earnings surprises. Dealers generally reported
better buying by clients into month-end and they
were not uncomfortable accommodating in
anticipation of a decent new issue pipeline in
May. We would expect spread movement in May
to remain anchored as demand continues to be
solid. The biggest variable for issuance is
inflation and what impact it might have on rates.
If rates jump, do issuers still need to come to
market, or would they be content waiting?

The chart shows three-month excess returns over
benchmark Treasuries versus weighted average
duration for Bloomberg Barclays investment grade
indices.

© 2021 Arbor Research & Trading, LLC. All Rights Reserved   05-04-2021   4
Industry Spread Performance – Safety Underperforming

  Consumer non-cyclical and utilities were the
  two poorest performing sectors this week,
  though the moves were not significant. PCG
  4.55 7/30 was one of the most active in utility
  space. Spreads there backed up +5 basis
  points to +193/190. Shorter duration PCG was
  little changed to a basis point tighter.
  Consumer finance tightened slightly, but
  domestic banks gave up some of last week’s
  gains to widen a basis point or two. This is
  likely attributable to minor sector adjustments
  at month-end.

  The chart shows one-month changes in index
  option-adjusted spread (OAS) versus weighted
  average duration for Bloomberg Barclays
  investment grade indices.

© 2021 Arbor Research & Trading, LLC. All Rights Reserved   05-04-2021   5
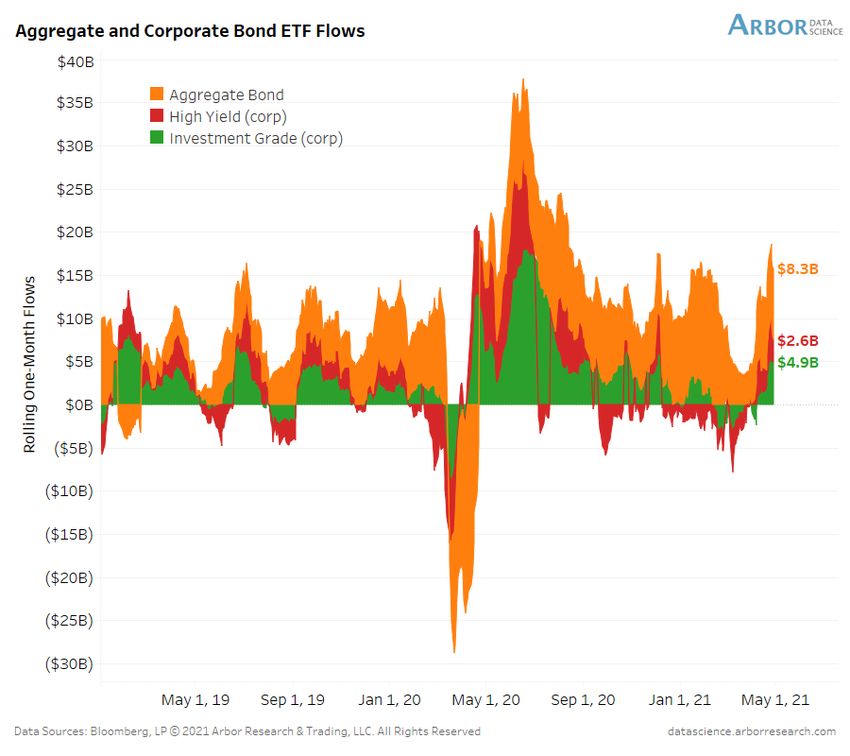
Reported Economic Data – Aggregate and Corporate Bond ETF Flows

ETF flows into corporate bonds were mixed last
week. High Yield corporate bond ETFs saw
decreased flows while Investment Grade corporate
ETFs saw significantly increased flows.

The chart shows stacked rolling one-month flows
into bond ETFs.

© 2021 Arbor Research & Trading, LLC. All Rights Reserved   05-04-2021   6
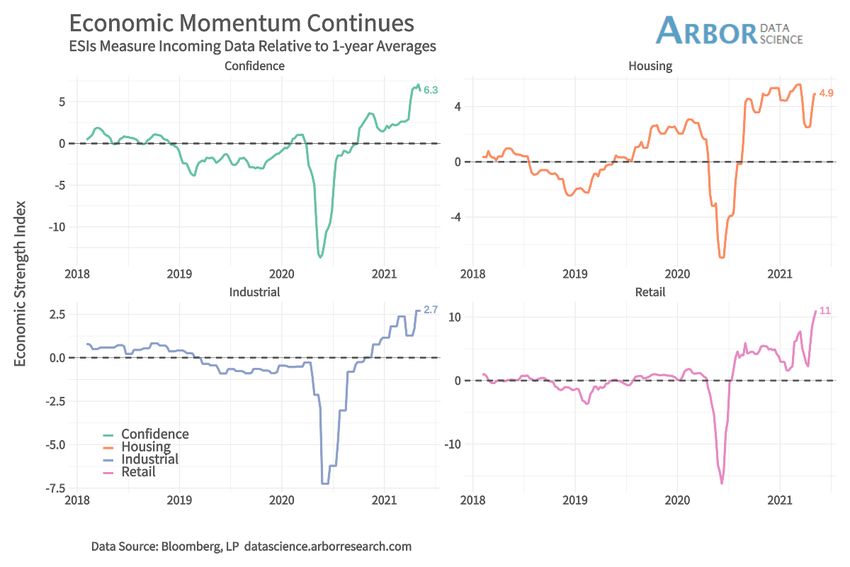
Reported Economic Data - Economic Strength Indices

 Consumer confidence took its first downturn
 in recent weeks but remains far above the 1-
 year average.

 Retail strength, on the other hand, has
 continued to grow as consumers get out and
 spend their accumulated savings.

 The chart shows our Economic Strength Indices
 for global industrial activity by region. ESIs
 measure incoming data relative to one-year
 averages.

© 2021 Arbor Research & Trading, LLC. All Rights Reserved   05-04-2021   7
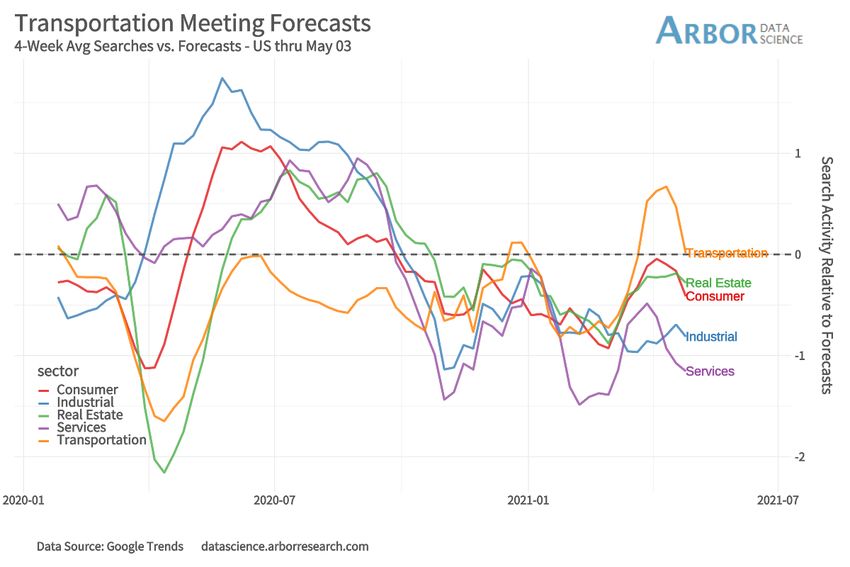
Real Time Indicators – Google Search Activity

US Google search activity took a downturn
last week. Transportation remained at
forecasted levels after a sharp drop from the
week before. Consumer and real estate
searches trail slightly behind projected.
Industrial and services continue to
significantly lag forecasts with some early sign
of industrial recovery.

Supply chain frictions and lockdowns abroad
will continue to be constraints, but the US
economy is still chugging along in the second
quarter.

The chart aggregates Google searches across
several dozen categories, showing the four-
week average of search activity relative to
forecasts in five key sectors.

© 2021 Arbor Research & Trading, LLC. All Rights Reserved   05-04-2021   8
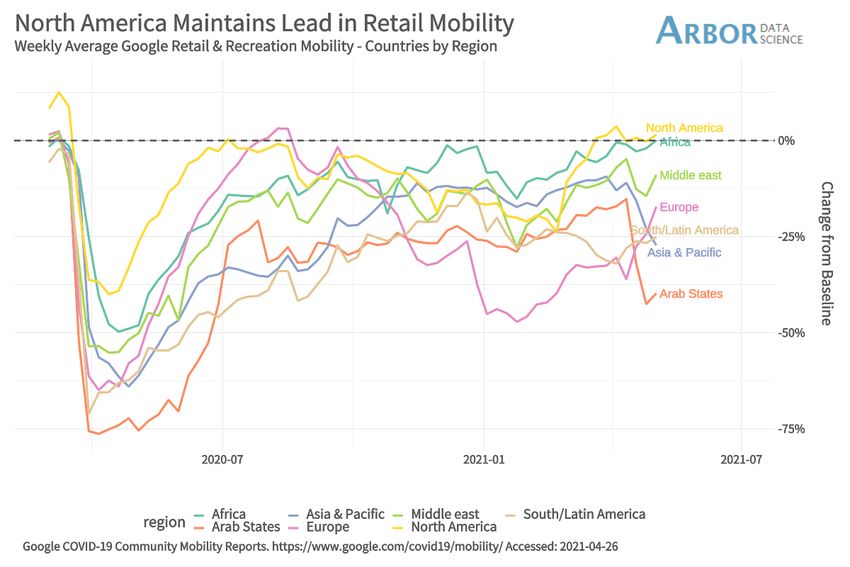
Real Time Indicators – Mobility

Globally, Google’s retail & recreation mobility is
mixed. North America still leads the pack in
mobility with Africa a close second. Mobility in
Europe and the Middle East is increasing as well
but remains lower than the baseline.

The Arab States mobility plummeted last week
but has again started inching upward. Mobility
continues to decline in Asia Pacific likely due to
the massive COVID wave in India.

The chart shows 7-day averages of Google’s retail
& recreation mobility relative to the pre-
lockdown baseline globally by census region.

© 2021 Arbor Research & Trading, LLC. All Rights Reserved   05-04-2021   9
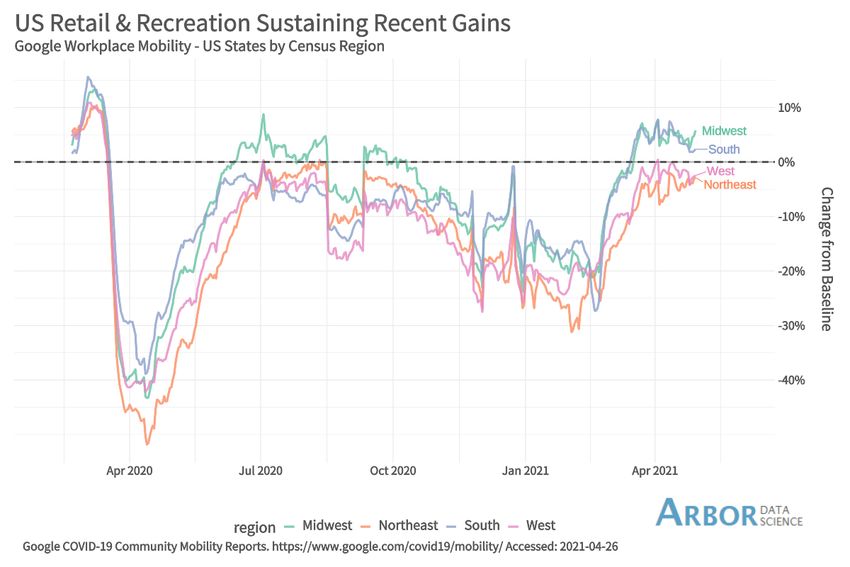
Real Time Indicators – Mobility

Workplace mobility in the US remains highest in
the South and Midwest

Americans continue to return to work but there
continue to be indications that offices will never
see their old numbers. Working from home
seems be the better option for many US
workers, particularly for those whose kids
haven’t returned to school.

The chart shows 7-day averages of Google’s
workplace mobility relative to the pre-lockdown
baseline in US by census region.

© 2021 Arbor Research & Trading, LLC. All Rights Reserved   05-04-2021   10
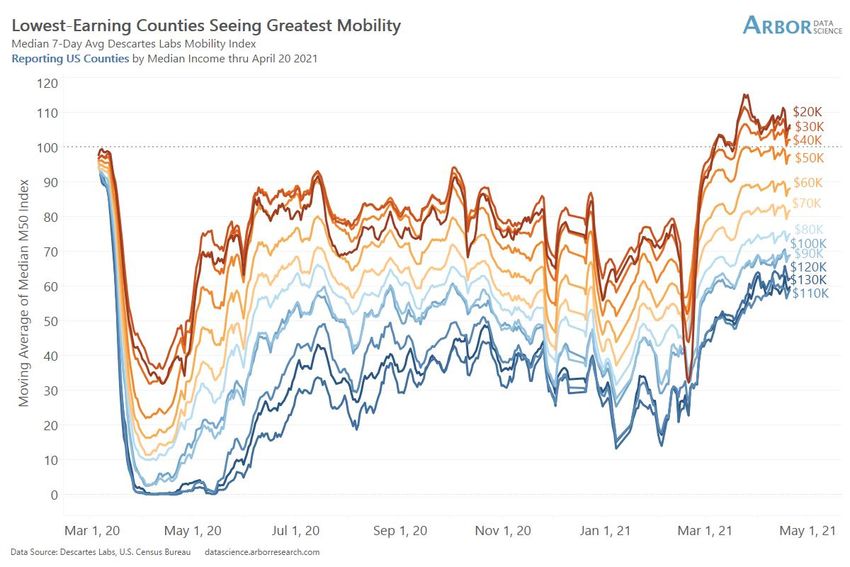
Weekly Feature – Stagnant Mobility

The greatest gains in mobility occurred across
higher-income counties over the past month. Lower
income mobility was the first to recover and remain
the highest.

Lower-income county mobility, however, has
plateaued and, in some cases, fallen over the past
few weeks. Vaccine hesitancy is one possible culprit
as it mostly occurs in lower-income, lower-
education communities.

© 2021 Arbor Research & Trading, LLC. All Rights Reserved   05-04-2021   11
Weekly Feature – Stagnant Mobility

  The Plateau is even more apparent when
  breaking down by region.

  Increasing mobility is likely on the horizon as
  the summer months begin as consumers
  continue to return to work, travel, and shop.

  For more: Is the WFH Movement Reaching a
  Turning Point?

© 2021 Arbor Research & Trading, LLC. All Rights Reserved   05-04-2021   12
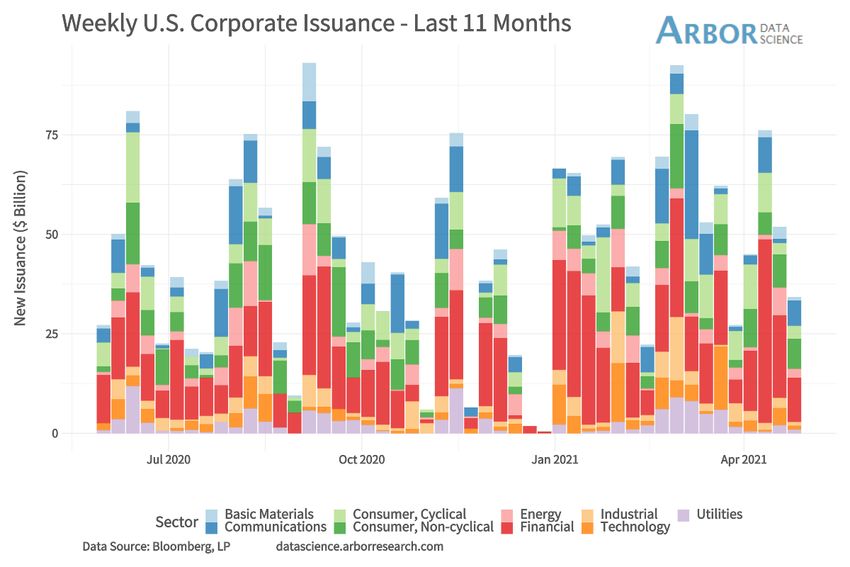
Issuance Recap

  Primary market activity fell a bit this week.
  Total new supply came in above $30 billion.

  Financial Issuance was still the highest last
  week followed by Consumer Non-Cyclical.

  Last April saw $285 billion as the Fed
  debuted its support measures for credit
  markets. This brought stabilization to
  domestic credit and issuers were quick to
  take advantage of the liquidity that was
  abruptly turned off in March. April 2021
  issuance fell 53% vs. April 2020 and YTD we
  are now -10% vs. the first four months of
  2020. Expectations for May are robust but
  will pale in comparison May 2020.

© 2021 Arbor Research & Trading, LLC. All Rights Reserved   05-04-2021   13
Issuance Recap

© 2021 Arbor Research & Trading, LLC. All Rights Reserved   05-04-2021   14
Issuance Recap

© 2021 Arbor Research & Trading, LLC. All Rights Reserved   05-04-2021   15
Contact Us
Give us a call for more information about our services and products

Ben Breitholtz – Data Scientist
ben.breitholtz@arborresearch.com

Anthony Rizzo – Data Scientist
anthony.rizzo@arborresearch.com

Arbor Research & Trading, LLC
22333 Classic Court
Lake Barrington, IL 60010
847 756 3575

datascience.arborresearch.com

Copyright 2021 Arbor Research & Trading, LLC. This message is intended only for the
personal and confidential use of the designated recipient(s) named above. If you are not the
intended recipient of this message you are hereby notified that any review, dissemination,
distribution or copying of this message is strictly prohibited. This communication is for
information purposes only and should not be regarded as an offer to sell or as a solicitation
of an offer to buy any financial product, an official confirmation of any transaction, or as an
official statement of Broadstone Insights. Email transmission cannot be guaranteed to be
secure or error-free. Therefore, we do not represent that this information is complete or
accurate and it should not be relied upon as such. All information is subject to change
without notice.

                                   © 2021 Arbor Research & Trading, LLC. All Rights Reserved
                                                                                                  16
                                                        05-04-2021
You can also read